SmogRank / World / Europe / Belgium / Flanders
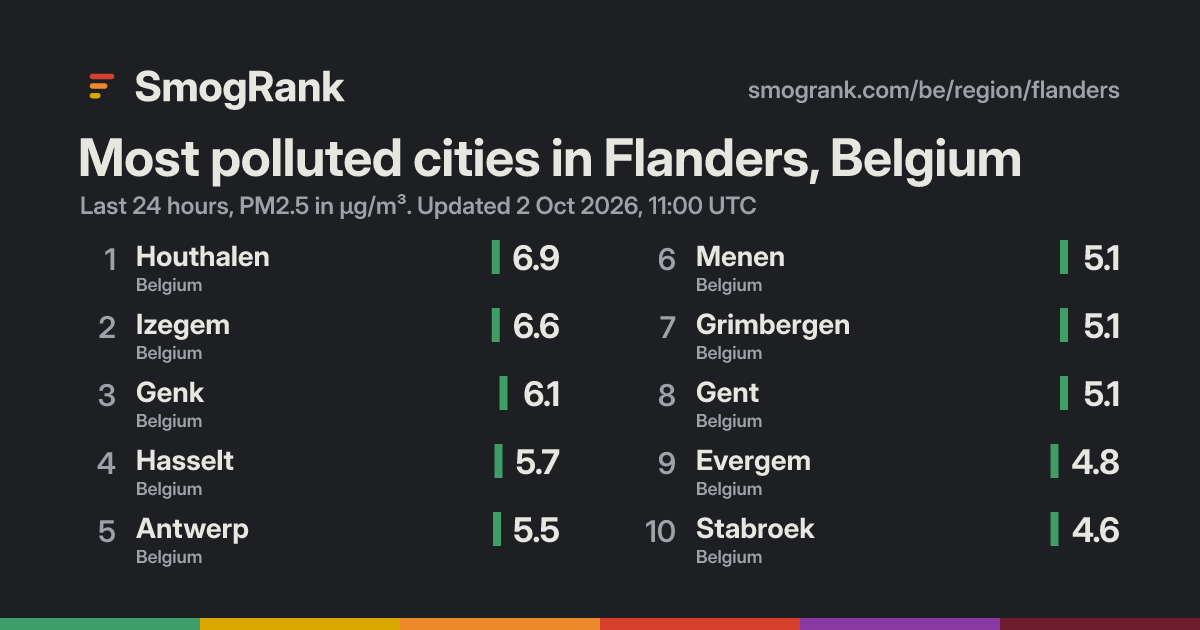
Most polluted cities in Flanders, Belgium
18 measured cities, last 24 hours; 0 above the WHO 24-hour guideline. Worst: Izegem at 7.4 µg/m³, #651 in the world.
- 1Izegem 7.40.5×
- 2Houthalen 6.10.4×
- 3Genk 5.90.4×
- 4Antwerp 5.90.4×
- 5Hasselt 5.50.4×
- 6Grimbergen 5.40.4×
- 7Gent 5.10.3×
- 8Zwijndrecht 4.80.3×
- 9Zaventem 4.70.3×
- 10Stabroek 4.70.3×
- 11Beveren 4.70.3×
- 12Evergem 4.60.3×
- 13Aarschot 4.50.3×
- 14Menen 4.40.3×
- 15Knokke-Heist 4.40.3×
- 16Kortrijk 4.20.3×
- 17Roeselare 4.00.3×
- 18Maldegem 3.70.2×
PM2.5 in µg/m³, coloured by the US EPA's PM2.5 categories. Show values as: µg/m³ · US AQI · India AQI · China AQI · European AQI · UK DAQI · Canada AQHI+. About the scales
Estimated: cities without a monitor
Flanders cities we can't measure, with model estimates for the last 7 days. Listed by population, not ranked: estimates aren't precise enough to rank. Model estimates from the Copernicus Atmosphere Monitoring Service (CAMS), adjusted to measured cities nearby where there are any. Adjusted, a single day lands within ×1.5 of what a monitor would read about two times in three; unadjusted, it can be off by half or double. Treat them as a guide, not a measurement.
| City | 7-day estimate |
|---|---|
| Brugge | ≈ 9 µg/m³ |
| Leuven | ≈ 7 µg/m³ |
| Deurne | ≈ 9 µg/m³ |
| Aalst | ≈ 8 µg/m³ |
| Ostend | ≈ 9 µg/m³ |
| Sint-Niklaas | ≈ 9 µg/m³ |
| Borgerhout | ≈ 9 µg/m³ |
| Dendermonde | ≈ 9 µg/m³ |
| Merksem | ≈ 9 µg/m³ |
| Turnhout | ≈ 9 µg/m³ |
| Berchem | ≈ 9 µg/m³ |
| Lokeren | ≈ 9 µg/m³ |
| Wilrijk | ≈ 9 µg/m³ |
| Beringen | ≈ 8 µg/m³ |
| Dilbeek | ≈ 8 µg/m³ |
| Heist-op-den-Berg | ≈ 8 µg/m³ |
| Sint-Truiden | ≈ 8 µg/m³ |
| Brasschaat | ≈ 9 µg/m³ |
| Vilvoorde | ≈ 8 µg/m³ |
| Maasmechelen | ≈ 8 µg/m³ |
| Waregem | ≈ 9 µg/m³ |
| Ieper | ≈ 10 µg/m³ |
| Ninove | ≈ 8 µg/m³ |
| Geel | ≈ 8 µg/m³ |
| Halle | ≈ 8 µg/m³ |
| Hoboken | ≈ 9 µg/m³ |
| Schoten | ≈ 9 µg/m³ |
| Lier | ≈ 9 µg/m³ |
| Sint-Amandsberg | ≈ 9 µg/m³ |
| Lommel | ≈ 9 µg/m³ |
| Oudenaarde | ≈ 9 µg/m³ |
| Tienen | ≈ 8 µg/m³ |
| Heusden | ≈ 8 µg/m³ |
| Wevelgem | ≈ 10 µg/m³ |
| Geraardsbergen | ≈ 8 µg/m³ |
| Sint-Pieters-Leeuw | ≈ 8 µg/m³ |
| Kessel-Lo | ≈ 7 µg/m³ |
| Blauwput | ≈ 7 µg/m³ |
| Helchteren | ≈ 8 µg/m³ |
| Tongeren | ≈ 8 µg/m³ |
Use this board
SmogRank, most polluted cities in Flanders, Belgium, PM2.5, last 24 hours to 2 Oct 2026, 06:00 UTC, smogrank.com/be/region/flanders.
You're welcome to reuse a single chart, image or figure with this citation and a link. Terms.
Updated 2026-10-02 06:07 UTC. Values are PM2.5 (fine particles), the median of each city's monitors in µg/m³.