SmogRank / World / Chile / July 2025
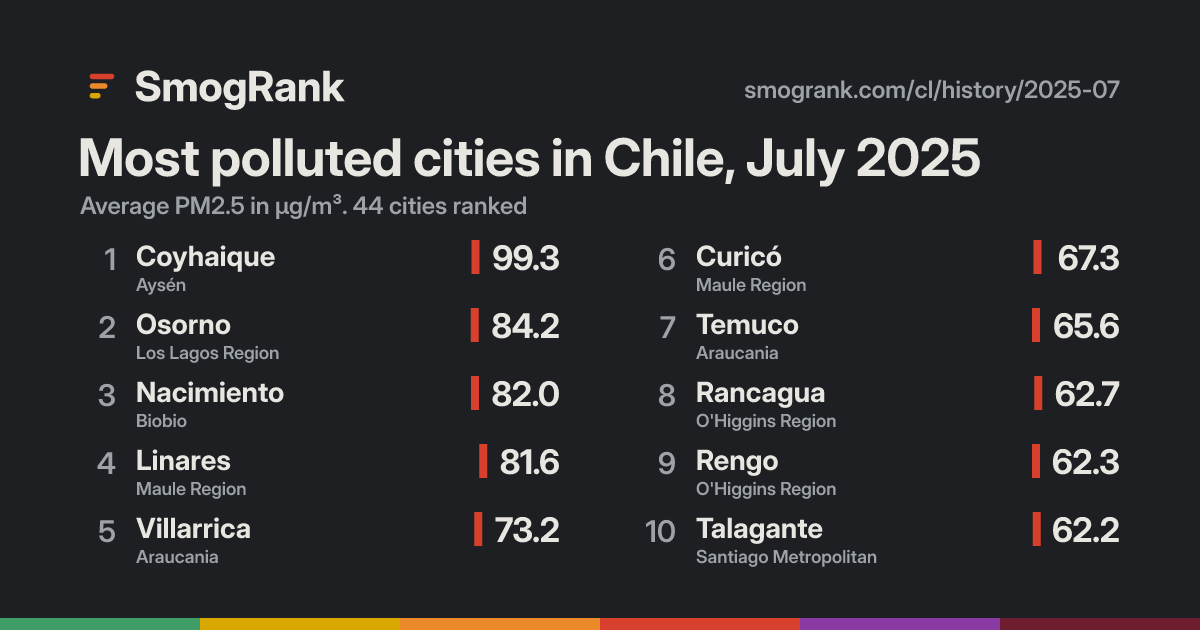
Most polluted cities in Chile, July 2025
44 cities in Chile ranked by their average PM2.5 over the 31 days. Worst: Coyhaique at 99.3 µg/m³, #2 of 2,499 cities in the world. Cleanest: Calama at 17.7. A city needs measurements on 70% of the days to be ranked.
← Coyhaique 99.3
- 1CoyhaiqueAysén 182
- 2OsornoLos Lagos Region 171
- 3NacimientoBiobio 170
- 4LinaresMaule Region 169
- 5VillarricaAraucania 163
- 6CuricóMaule Region 159
- 7TemucoAraucania 158
- 8RancaguaO'Higgins Region 156
- 9RengoO'Higgins Region 156
- 10TalaganteSantiago Metropolitan 156
- 11Puerto VarasLos Lagos Region 155
- 12ValdiviaLos Ríos Region 153
- 12SantiagoSantiago Metropolitan 153
- 14San CarlosÑuble 153
- 15ChillánÑuble 146
- 16HualpénBiobio 145
- 17Puente AltoSantiago Metropolitan 143
- 18TalcaMaule Region 143
- 19Los ÁngelesBiobio 141
- 20HualquiBiobio 135
- 21CoronelBiobio 135
- 22Puerto AysénAysén 130
- 22La UniónLos Ríos Region 130
- 24Puerto MonttLos Lagos Region 123
- 25QuilpuéValparaiso 118
- 26CauquenesMaule Region 117
- 27CuranilahueBiobio 115
- 28QuillotaValparaiso 111
- 29TalcahuanoBiobio 99
- 30QuinteroValparaiso 95
- 31ConcónValparaiso 95
- 32ConcepciónBiobio 92
- 33ChiguayanteBiobio 90
- 34ToméBiobio 88
- 35San Pedro de la PazBiobio 86
- 36Viña del MarValparaiso 84
- 37CoquimboCoquimbo Region 83
- 38La SerenaCoquimbo Region 80
- 39CopiapóAtacama 80
- 40TocopillaAntofagasta 77
- 41AricaArica y Parinacota Region 75
- 42Alto HospicioTarapacá 70
- 43LotaBiobio 67
- 44CalamaAntofagasta 67
Good0–50
Moderate51–100
Sensitive groups101–150
Unhealthy151–200
Very unhealthy201–300
Hazardous301+
The US EPA's Air Quality Index for PM2.5 (2024 breakpoints). Show values as: µg/m³ · US AQI · India AQI · China AQI · European AQI · UK DAQI · Canada AQHI+. About the scales
All cities in the world, July 2025 · Chile now
Use this board
SmogRank, most polluted cities in Chile, PM2.5, July 2025, smogrank.com/cl/history/2025-07 (accessed 2 Oct 2026).
You're welcome to reuse a single chart, image or figure with this citation and a link. Terms.