SmogRank / Chile / Biobio
Air quality in Lota
No new readings from Lota's monitors since 1 Oct. Some networks publish days late. The figures below are from before then; they update when the data returns.
Biobio, Chile. PM2.5 from 1 reference monitor. None of them reported in the last 24 hours.
17.2µg/m³
Moderate Mean for 1 Oct, the most recent day with readings, 1.1× the WHO 24-hour guideline.
Rank, worst first 24 hours – not enough data
7 days #219 of 2,603, at 18.6 µg/m³, 7 days to 1 Oct
30 days #368 of 2,623, at 20.7 µg/m³, 27 days to 1 Oct
This year #451 of 2,447, at 21.7 µg/m³, to 1 Oct
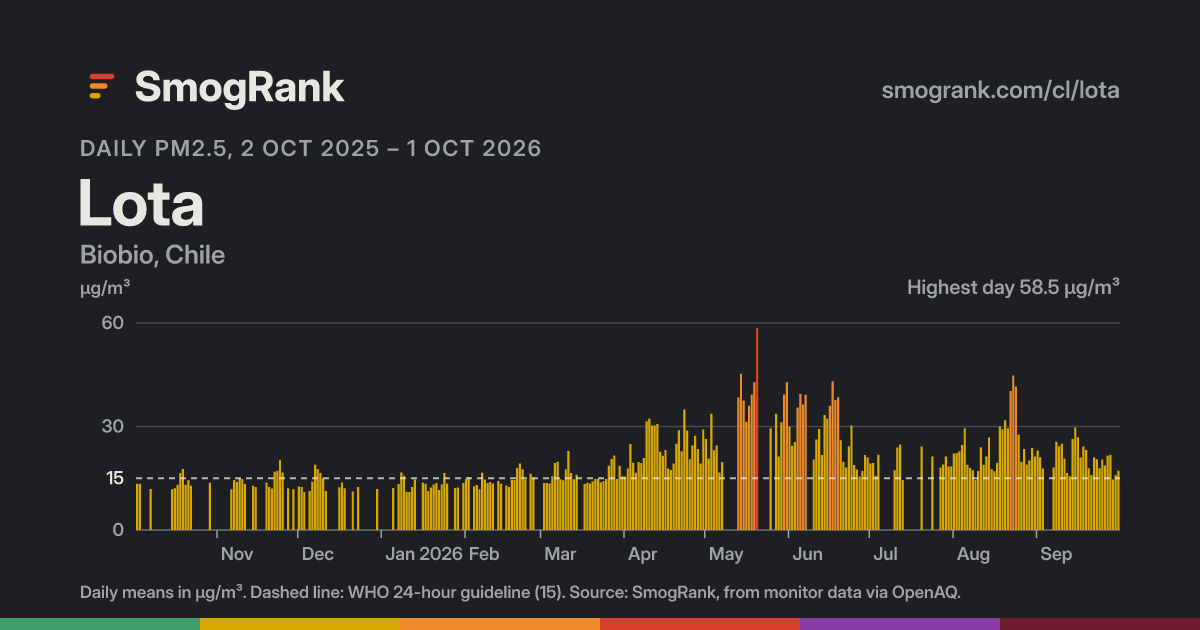
Why it ranks here Seasonal. Over the past year its worst months were May, June, averaging up to 32.9 µg/m³ against 13.2 in its cleanest month. Seasonal peaks usually come from heating, crop burning, fire or dust seasons.
Based on Lota's own measurements; causes are the usual kinds for a pattern like this, not a confirmed source.
The last 12 months, day by day
1 10 20 31 Nov 2025 Dec Jan 2026 Feb Mar Apr May Jun Jul Aug Sep Oct 2025-11-01: no data 2025-11-02: no data 2025-11-03: no data 2025-11-04: no data 2025-11-05: no data 2025-11-06: 11.8 µg/m³ 2025-11-07: 14.5 µg/m³ 2025-11-08: 13.9 µg/m³ 2025-11-09: 15.1 µg/m³ 2025-11-10: 14.8 µg/m³ 2025-11-11: 13.3 µg/m³ 2025-11-12: no data 2025-11-13: no data 2025-11-14: 12.8 µg/m³ 2025-11-15: 12.5 µg/m³ 2025-11-16: no data 2025-11-17: no data 2025-11-18: no data 2025-11-19: 13.8 µg/m³ 2025-11-20: 12.5 µg/m³ 2025-11-21: 12.0 µg/m³ 2025-11-22: 16.9 µg/m³ 2025-11-23: 17.2 µg/m³ 2025-11-24: 20.3 µg/m³ 2025-11-25: 16.7 µg/m³ 2025-11-26: no data 2025-11-27: 12.1 µg/m³ 2025-11-28: no data 2025-11-29: 11.8 µg/m³ 2025-11-30: no data 2025-12-01: 12.6 µg/m³ 2025-12-02: 12.5 µg/m³ 2025-12-03: 11.0 µg/m³ 2025-12-04: no data 2025-12-05: 11.3 µg/m³ 2025-12-06: 14.0 µg/m³ 2025-12-07: 18.9 µg/m³ 2025-12-08: 17.7 µg/m³ 2025-12-09: 16.5 µg/m³ 2025-12-10: 14.9 µg/m³ 2025-12-11: 11.3 µg/m³ 2025-12-12: no data 2025-12-13: no data 2025-12-14: no data 2025-12-15: no data 2025-12-16: 12.4 µg/m³ 2025-12-17: 13.8 µg/m³ 2025-12-18: 12.1 µg/m³ 2025-12-19: no data 2025-12-20: no data 2025-12-21: 11.2 µg/m³ 2025-12-22: no data 2025-12-23: 12.5 µg/m³ 2025-12-24: no data 2025-12-25: no data 2025-12-26: no data 2025-12-27: no data 2025-12-28: no data 2025-12-29: no data 2025-12-30: 11.9 µg/m³ 2025-12-31: no data 2026-01-01: no data 2026-01-02: no data 2026-01-03: no data 2026-01-04: no data 2026-01-05: 12.2 µg/m³ 2026-01-06: no data 2026-01-07: 13.3 µg/m³ 2026-01-08: 16.7 µg/m³ 2026-01-09: 15.7 µg/m³ 2026-01-10: 11.1 µg/m³ 2026-01-11: 11.0 µg/m³ 2026-01-12: 12.5 µg/m³ 2026-01-13: 14.6 µg/m³ 2026-01-14: no data 2026-01-15: no data 2026-01-16: 13.8 µg/m³ 2026-01-17: 13.4 µg/m³ 2026-01-18: 11.3 µg/m³ 2026-01-19: 12.3 µg/m³ 2026-01-20: 13.2 µg/m³ 2026-01-21: 13.6 µg/m³ 2026-01-22: 11.6 µg/m³ 2026-01-23: 13.2 µg/m³ 2026-01-24: 16.5 µg/m³ 2026-01-25: 13.5 µg/m³ 2026-01-26: no data 2026-01-27: no data 2026-01-28: 12.2 µg/m³ 2026-01-29: 12.3 µg/m³ 2026-01-30: no data 2026-01-31: 13.6 µg/m³ 2026-02-01: 14.8 µg/m³ 2026-02-02: 15.3 µg/m³ 2026-02-03: no data 2026-02-04: 12.7 µg/m³ 2026-02-05: 13.0 µg/m³ 2026-02-06: 11.8 µg/m³ 2026-02-07: 16.6 µg/m³ 2026-02-08: 14.6 µg/m³ 2026-02-09: 13.6 µg/m³ 2026-02-10: 13.9 µg/m³ 2026-02-11: 13.5 µg/m³ 2026-02-12: no data 2026-02-13: 14.2 µg/m³ 2026-02-14: 13.4 µg/m³ 2026-02-15: no data 2026-02-16: 12.9 µg/m³ 2026-02-17: 12.5 µg/m³ 2026-02-18: 14.5 µg/m³ 2026-02-19: 14.5 µg/m³ 2026-02-20: 18.0 µg/m³ 2026-02-21: 19.3 µg/m³ 2026-02-22: 17.6 µg/m³ 2026-02-23: 14.6 µg/m³ 2026-02-24: no data 2026-02-25: 16.3 µg/m³ 2026-02-26: 15.2 µg/m³ 2026-02-27: no data 2026-02-28: no data 2026-03-01: no data 2026-03-02: 13.6 µg/m³ 2026-03-03: 13.6 µg/m³ 2026-03-04: 13.5 µg/m³ 2026-03-05: 15.6 µg/m³ 2026-03-06: 19.4 µg/m³ 2026-03-07: 19.8 µg/m³ 2026-03-08: 14.7 µg/m³ 2026-03-09: 14.4 µg/m³ 2026-03-10: 17.6 µg/m³ 2026-03-11: 22.9 µg/m³ 2026-03-12: 16.5 µg/m³ 2026-03-13: 14.7 µg/m³ 2026-03-14: 16.0 µg/m³ 2026-03-15: no data 2026-03-16: no data 2026-03-17: 13.3 µg/m³ 2026-03-18: 13.7 µg/m³ 2026-03-19: 13.5 µg/m³ 2026-03-20: 14.1 µg/m³ 2026-03-21: 14.8 µg/m³ 2026-03-22: 14.8 µg/m³ 2026-03-23: 13.8 µg/m³ 2026-03-24: 14.2 µg/m³ 2026-03-25: 14.8 µg/m³ 2026-03-26: 18.6 µg/m³ 2026-03-27: 20.6 µg/m³ 2026-03-28: 21.6 µg/m³ 2026-03-29: 14.8 µg/m³ 2026-03-30: 18.6 µg/m³ 2026-03-31: 15.6 µg/m³ 2026-04-01: 15.5 µg/m³ 2026-04-02: 17.8 µg/m³ 2026-04-03: 24.9 µg/m³ 2026-04-04: 19.5 µg/m³ 2026-04-05: 16.6 µg/m³ 2026-04-06: 19.7 µg/m³ 2026-04-07: 19.4 µg/m³ 2026-04-08: 20.9 µg/m³ 2026-04-09: 31.5 µg/m³ 2026-04-10: 32.3 µg/m³ 2026-04-11: 30.3 µg/m³ 2026-04-12: 30.3 µg/m³ 2026-04-13: 30.7 µg/m³ 2026-04-14: 22.7 µg/m³ 2026-04-15: 21.5 µg/m³ 2026-04-16: 23.2 µg/m³ 2026-04-17: 17.8 µg/m³ 2026-04-18: 17.4 µg/m³ 2026-04-19: 19.3 µg/m³ 2026-04-20: 25.0 µg/m³ 2026-04-21: 28.9 µg/m³ 2026-04-22: 22.8 µg/m³ 2026-04-23: 34.9 µg/m³ 2026-04-24: 28.8 µg/m³ 2026-04-25: 20.5 µg/m³ 2026-04-26: 24.5 µg/m³ 2026-04-27: 27.3 µg/m³ 2026-04-28: 23.5 µg/m³ 2026-04-29: 19.3 µg/m³ 2026-04-30: 29.1 µg/m³ 2026-05-01: 26.4 µg/m³ 2026-05-02: 20.7 µg/m³ 2026-05-03: 33.7 µg/m³ 2026-05-04: 23.1 µg/m³ 2026-05-05: 24.5 µg/m³ 2026-05-06: 16.7 µg/m³ 2026-05-07: 19.7 µg/m³ 2026-05-08: no data 2026-05-09: no data 2026-05-10: no data 2026-05-11: no data 2026-05-12: no data 2026-05-13: 38.4 µg/m³ 2026-05-14: 45.3 µg/m³ 2026-05-15: 37.5 µg/m³ 2026-05-16: 31.4 µg/m³ 2026-05-17: 36.0 µg/m³ 2026-05-18: 39.3 µg/m³ 2026-05-19: 42.8 µg/m³ 2026-05-20: 58.5 µg/m³ 2026-05-21: no data 2026-05-22: no data 2026-05-23: no data 2026-05-24: no data 2026-05-25: 29.5 µg/m³ 2026-05-26: no data 2026-05-27: 33.7 µg/m³ 2026-05-28: 21.3 µg/m³ 2026-05-29: 31.2 µg/m³ 2026-05-30: 39.3 µg/m³ 2026-05-31: 42.8 µg/m³ 2026-06-01: 30.0 µg/m³ 2026-06-02: 24.4 µg/m³ 2026-06-03: 25.5 µg/m³ 2026-06-04: 35.5 µg/m³ 2026-06-05: 39.4 µg/m³ 2026-06-06: 36.4 µg/m³ 2026-06-07: 39.2 µg/m³ 2026-06-08: no data 2026-06-09: no data 2026-06-10: 20.4 µg/m³ 2026-06-11: 26.2 µg/m³ 2026-06-12: 29.3 µg/m³ 2026-06-13: 21.7 µg/m³ 2026-06-14: 33.3 µg/m³ 2026-06-15: 32.3 µg/m³ 2026-06-16: 36.0 µg/m³ 2026-06-17: 43.1 µg/m³ 2026-06-18: 37.7 µg/m³ 2026-06-19: 38.5 µg/m³ 2026-06-20: 26.0 µg/m³ 2026-06-21: 19.8 µg/m³ 2026-06-22: 18.1 µg/m³ 2026-06-23: 24.3 µg/m³ 2026-06-24: 30.3 µg/m³ 2026-06-25: 18.8 µg/m³ 2026-06-26: 17.5 µg/m³ 2026-06-27: 15.5 µg/m³ 2026-06-28: 17.1 µg/m³ 2026-06-29: 21.7 µg/m³ 2026-06-30: 21.0 µg/m³ 2026-07-01: 19.3 µg/m³ 2026-07-02: 19.4 µg/m³ 2026-07-03: 15.7 µg/m³ 2026-07-04: 21.8 µg/m³ 2026-07-05: no data 2026-07-06: no data 2026-07-07: no data 2026-07-08: no data 2026-07-09: no data 2026-07-10: 17.3 µg/m³ 2026-07-11: 23.9 µg/m³ 2026-07-12: 24.8 µg/m³ 2026-07-13: 14.5 µg/m³ 2026-07-14: no data 2026-07-15: no data 2026-07-16: no data 2026-07-17: no data 2026-07-18: no data 2026-07-19: no data 2026-07-20: 24.2 µg/m³ 2026-07-21: no data 2026-07-22: no data 2026-07-23: no data 2026-07-24: 21.3 µg/m³ 2026-07-25: no data 2026-07-26: no data 2026-07-27: 18.1 µg/m³ 2026-07-28: 19.0 µg/m³ 2026-07-29: 21.3 µg/m³ 2026-07-30: 18.4 µg/m³ 2026-07-31: 18.5 µg/m³ 2026-08-01: 22.2 µg/m³ 2026-08-02: 22.3 µg/m³ 2026-08-03: 22.8 µg/m³ 2026-08-04: 24.6 µg/m³ 2026-08-05: 29.5 µg/m³ 2026-08-06: 18.9 µg/m³ 2026-08-07: 18.0 µg/m³ 2026-08-08: 17.3 µg/m³ 2026-08-09: 14.5 µg/m³ 2026-08-10: 17.1 µg/m³ 2026-08-11: 24.0 µg/m³ 2026-08-12: 18.9 µg/m³ 2026-08-13: 21.3 µg/m³ 2026-08-14: 26.8 µg/m³ 2026-08-15: 17.6 µg/m³ 2026-08-16: 17.0 µg/m³ 2026-08-17: 19.5 µg/m³ 2026-08-18: 30.0 µg/m³ 2026-08-19: 29.2 µg/m³ 2026-08-20: 31.8 µg/m³ 2026-08-21: 29.5 µg/m³ 2026-08-22: 40.3 µg/m³ 2026-08-23: 44.8 µg/m³ 2026-08-24: 41.6 µg/m³ 2026-08-25: 27.7 µg/m³ 2026-08-26: 19.8 µg/m³ 2026-08-27: 23.5 µg/m³ 2026-08-28: 19.0 µg/m³ 2026-08-29: 20.1 µg/m³ 2026-08-30: 23.8 µg/m³ 2026-08-31: 21.3 µg/m³ 2026-09-01: 23.0 µg/m³ 2026-09-02: 21.1 µg/m³ 2026-09-03: 17.8 µg/m³ 2026-09-04: no data 2026-09-05: no data 2026-09-06: no data 2026-09-07: 18.1 µg/m³ 2026-09-08: 25.6 µg/m³ 2026-09-09: 24.3 µg/m³ 2026-09-10: 25.0 µg/m³ 2026-09-11: 20.7 µg/m³ 2026-09-12: 16.5 µg/m³ 2026-09-13: 15.6 µg/m³ 2026-09-14: 26.4 µg/m³ 2026-09-15: 29.7 µg/m³ 2026-09-16: 26.9 µg/m³ 2026-09-17: 21.0 µg/m³ 2026-09-18: 24.2 µg/m³ 2026-09-19: 23.2 µg/m³ 2026-09-20: 17.9 µg/m³ 2026-09-21: 15.9 µg/m³ 2026-09-22: 21.0 µg/m³ 2026-09-23: 20.5 µg/m³ 2026-09-24: 17.9 µg/m³ 2026-09-25: 20.4 µg/m³ 2026-09-26: 18.7 µg/m³ 2026-09-27: 21.5 µg/m³ 2026-09-28: 21.7 µg/m³ 2026-09-29: 14.6 µg/m³ 2026-09-30: 15.9 µg/m³ 2026-10-01: 17.2 µg/m³ 182 of 269 measured days were over the WHO 24-hour guideline (15 µg/m³). One row per month, one square per local day. Good 0–9.0
Moderate 9.1–35.4
Sensitive groups 35.5–55.4
Unhealthy 55.5–125.4
Very unhealthy 125.5–225.4
Hazardous 225.5+
PM2.5 in µg/m³, coloured by the US EPA's PM2.5 categories. Show values as: µg/m³ · US AQI · India AQI · China AQI · European AQI · UK DAQI · Canada AQHI+ . About the scales
Hour by hour No hourly readings in the last few days. The chart returns when the monitors' data arrives.
Where it stood each day Top 10 Top 100 #1 #10 #100 #1,000 #2,835 Nov Dec Jan Feb Mar Apr May Jun Jul Aug Sep #248 Its rank on each day's world board, #1 being the most polluted city that day. The scale is logarithmic: each step down is ten times as many cities. See it among every city . 2026 against 2025, month by month 15 Jan 2025: 14.4 µg/m³ Jan 2026: 13.2 µg/m³ Jan Feb 2025: 14.6 µg/m³ Feb 2026: 14.7 µg/m³ Feb Mar 2025: 16.1 µg/m³ Mar 2026: 16.0 µg/m³ Mar Apr 2025: 17.2 µg/m³ Apr 2026: 23.9 µg/m³ Apr May 2025: 18.7 µg/m³ May 2026: 32.9 µg/m³ May Jun 2025: 17.6 µg/m³ Jun 2026: 27.8 µg/m³ Jun Jul 2025: 17.8 µg/m³ Jul 2026: 19.8 µg/m³ Jul Aug 2025: 17.8 µg/m³ Aug 2026: 24.3 µg/m³ Aug Sep 2025: 15.2 µg/m³ Sep 2026: 20.9 µg/m³ Sep Oct 2025: 13.6 µg/m³ Oct Nov 2025: 14.2 µg/m³ Nov Dec 2025: 13.4 µg/m³ Dec Faded bars: 2025. A month shows once it has 10 measured days. This week against past years This week This week: 18.6 µg/m³ 18.6 2025 2025: 13.1 µg/m³ 13.1 Mean PM2.5 for 25 Sept to 1 Oct in each year. Dashed line: WHO 24-hour guideline. Monitors
Station Operator Type Lota ruralPermission requested (Chile MMA, SINCA, 2026-10-01) Chile - SINCA Reference
The city's value is the median of its reference monitors each hour, when at least a third of them report (three are always enough); low-cost sensors are listed but not counted when reference monitors exist. Data via OpenAQ; licences as listed. How we rank . Embed this on your site .
Use this page SmogRank, PM2.5 daily means, Lota, Chile, 2 Oct 2025 – 1 Oct 2026, smogrank.com/cl/lota (accessed 2 Oct 2026).
Copy citation Download chart (PNG) Embed a live widget
You're welcome to reuse a single chart, image or figure with this citation and a link. Terms .
Other cities in Chile 30-day averages, µg/m³. All of Chile .
Updated 2026-10-02 06:07 UTC. Values are PM2.5 (fine particles), the median of each city's monitors in µg/m³.