SmogRank / World / Asia / Japan / Aichi
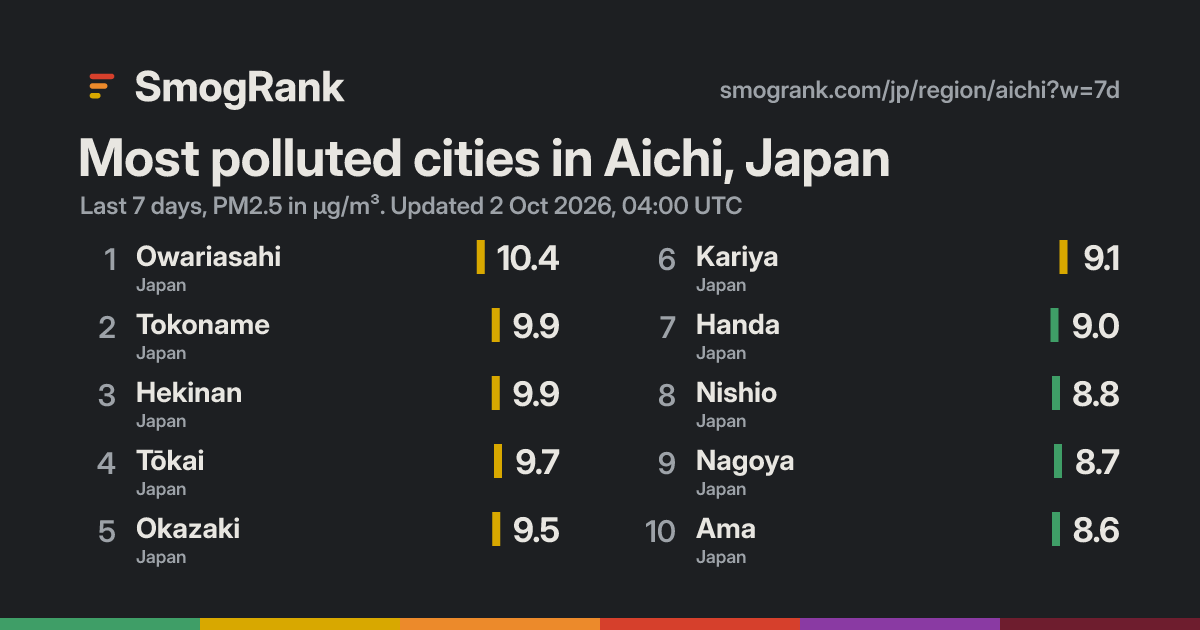
Most polluted cities in Aichi, Japan
23 measured cities, last 7 days; 0 above the WHO 24-hour guideline. Worst: Owariasahi at 10.4 µg/m³, #706 in the world.
- 1Owariasahi 1▼227
- 2Tokoname 1▼251
- 3Hekinan 1▼232
- 4Tōkai 1▼224
- 5Okazaki 1▼242
- 6Kariya 1▼303
- 7Handa 1▼288
- 8Nishio 1▼283
- 9Nagoya 1▼295
- 10Ama 1▼251
- 11Tahara 1▼357
- 12Chiryū 1▼308
- 13Kaminoma 1▼264
- 14Toyota 1▼261
- 15Anjō 1▼256
- 16Seto 1▼310
- 17Minamichita 1▼286
- 18Toyohashi 1▼335
- 19Gamagōri 1▼303
- 20Inuyama 1▼392
- 21Ichinomiya 1▼298
- 22Nisshin 1▼322
- 23Shinshiro 1▼462
The UK's Daily Air Quality Index (1 to 10), PM2.5 bands. Show values as: µg/m³ · US AQI · India AQI · China AQI · European AQI · UK DAQI · Canada AQHI+. About the scales
Estimated: cities without a monitor
Aichi cities we can't measure, with model estimates for the last 7 days. Listed by population, not ranked: estimates aren't precise enough to rank. Model estimates from the Copernicus Atmosphere Monitoring Service (CAMS), adjusted to measured cities nearby where there are any. Adjusted, a single day lands within ×1.5 of what a monitor would read about two times in three; unadjusted, it can be off by half or double. Treat them as a guide, not a measurement.
| City | 7-day estimate |
|---|---|
| Kasugai | ≈ 8 µg/m³ |
| Toyokawa | ≈ 6 µg/m³ |
| Komaki | ≈ 8 µg/m³ |
| Inazawa | ≈ 8 µg/m³ |
| Kōnan | ≈ 9 µg/m³ |
| Ōbu | ≈ 11 µg/m³ |
| Kitanagoya | ≈ 9 µg/m³ |
| Chita | ≈ 11 µg/m³ |
| Toyoake | ≈ 11 µg/m³ |
| Tsushima | ≈ 9 µg/m³ |
| Kiyosu | ≈ 9 µg/m³ |
| Miyoshi | ≈ 10 µg/m³ |
| Aisai | ≈ 9 µg/m³ |
| Nagakute | ≈ 9 µg/m³ |
| Ogawa | ≈ 9 µg/m³ |
| Takahama | ≈ 9 µg/m³ |
| Iwakura | ≈ 9 µg/m³ |
| Morowa | ≈ 10 µg/m³ |
| Taketoyo | ≈ 9 µg/m³ |
| Kōta | ≈ 8 µg/m³ |
| Kanie | ≈ 9 µg/m³ |
| Fusō | ≈ 12 µg/m³ |
| Kuroda | ≈ 9 µg/m³ |
| Ōharu | ≈ 9 µg/m³ |
| Ōguchi | ≈ 12 µg/m³ |
| Ishiki | ≈ 9 µg/m³ |
| Sobue | ≈ 9 µg/m³ |
| Toyohama | ≈ 9 µg/m³ |
| Toyoyama | ≈ 8 µg/m³ |
Use this board
SmogRank, most polluted cities in Aichi, Japan, PM2.5, last 7 days to 2 Oct 2026, 04:00 UTC, smogrank.com/jp/region/aichi?w=7d.
You're welcome to reuse a single chart, image or figure with this citation and a link. Terms.
Updated 2026-10-02 04:07 UTC. Values are PM2.5 (fine particles), the median of each city's monitors, as the UK DAQI PM2.5 sub-index.