SmogRank / Countries / Belgium / February 2025
Most polluted cities in Belgium, February 2025
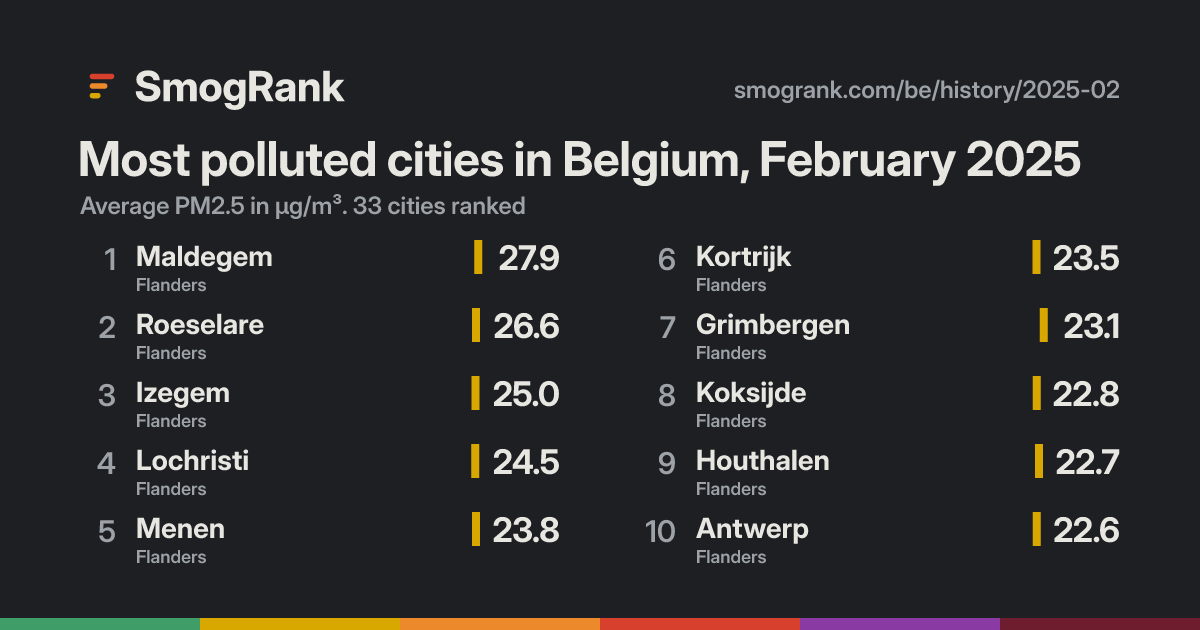
33 cities in Belgium ranked by their average PM2.5 over the 28 days. Worst: Maldegem at 27.9 µg/m³, #149 of 2,012 cities in the world. Cleanest: Marche-en-Famenne at 11.2. A city needs measurements on 70% of the days to be ranked.
- 1MaldegemFlanders 27.9
- 2RoeselareFlanders 26.6
- 3IzegemFlanders 25.0
- 4LochristiFlanders 24.5
- 5MenenFlanders 23.8
- 6KortrijkFlanders 23.5
- 7GrimbergenFlanders 23.1
- 8KoksijdeFlanders 22.8
- 9HouthalenFlanders 22.7
- 10AntwerpFlanders 22.6
- 11RixensartWallonia 22.3
- 11GentFlanders 22.3
- 11BeverenFlanders 22.3
- 14EvergemFlanders 22.0
- 15KapellenFlanders 21.9
- 16ZaventemFlanders 21.5
- 16StabroekFlanders 21.5
- 18ZwijndrechtFlanders 21.4
- 18MechelenFlanders 21.4
- 20MolFlanders 20.4
- 21HasseltFlanders 20.0
- 22AarschotFlanders 19.6
- 23WillebroekFlanders 19.3
- 24TournaiWallonia 18.8
- 24BrusselsBrussels Capital 18.8
- 26MonsWallonia 18.5
- 27CharleroiWallonia 15.8
- 28LiègeWallonia 15.7
- 29AndenneWallonia 15.3
- 30Flémalle-HauteWallonia 14.7
- 31NamurWallonia 13.5
- 32EupenWallonia 13.0
- 33Marche-en-FamenneWallonia 11.2
Good0–9.0
Moderate9.1–35.4
Sensitive groups35.5–55.4
Unhealthy55.5–125.4
Very unhealthy125.5–225.4
Hazardous225.5+
All cities in the world, February 2025 · Belgium now
Use this board
SmogRank, most polluted cities in Belgium, PM2.5, February 2025, smogrank.com/be/history/2025-02 (accessed 2 Oct 2026).
You're welcome to reuse a single chart, image or figure with this citation and a link. Terms.