SmogRank / Countries / Canada / Quebec
Most polluted cities in Quebec, Canada
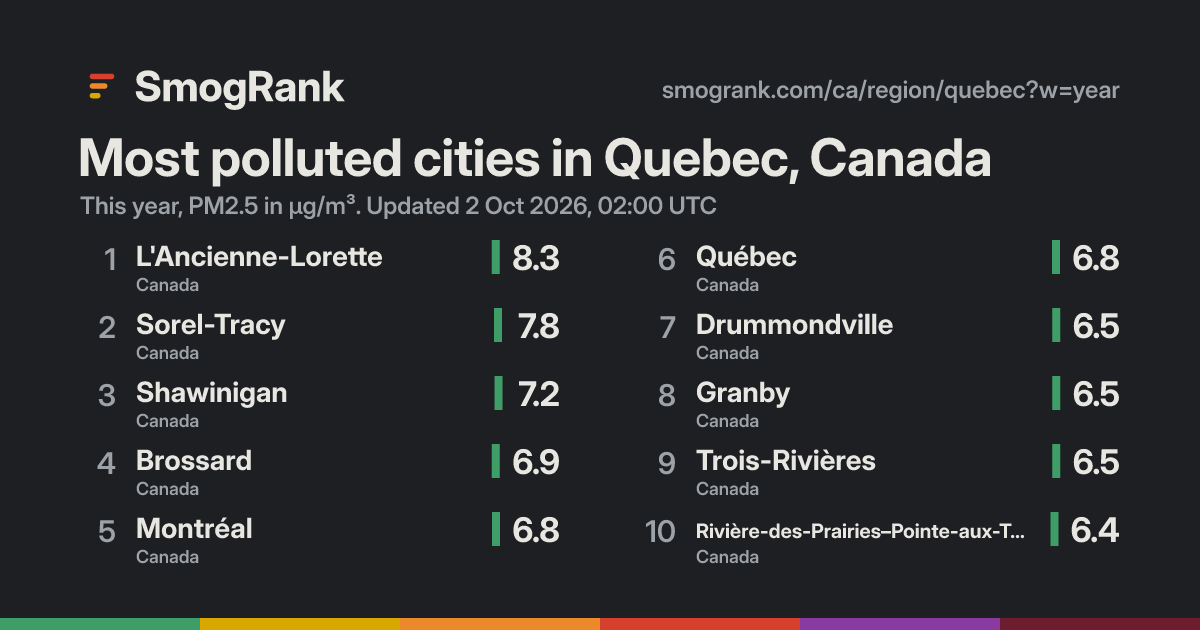
16 measured cities, this year; 15 above the WHO annual guideline. Worst: L'Ancienne-Lorette at 8.3 µg/m³, #1,295 in the world.
16 good
- 1L'Ancienne-Lorette 8.31.7×
- 2Sorel-Tracy 7.81.6×
- 3Shawinigan 7.21.4×
- 4Brossard 6.91.4×
- 5Montréal 6.81.4×
- 6Québec 6.81.4×
- 7Drummondville 6.51.3×
- 8Granby 6.51.3×
- 9Trois-Rivières 6.51.3×
- 10Rivière-des-Prairies–Pointe-aux-Trembles 6.41.3×
- 11Gatineaulow-cost sensors 6.01.2×
- 12Sherbrooke 5.71.1×
- 13Saguenay 5.61.1×
- 14Saint-Jean-sur-Richelieu 5.41.1×
- 15Sept-Îles 5.21.0×
- 16Rouyn-Noranda 4.81.0×
Estimated: cities without a monitor
Quebec cities we can't measure, with model estimates for the last 7 days. Listed by population, not ranked: estimates aren't precise enough to rank. Model estimates from the Copernicus Atmosphere Monitoring Service (CAMS), adjusted to measured cities nearby where there are any. Adjusted, a single day lands within ×1.5 of what a monitor would read about two times in three; unadjusted, it can be off by half or double. Treat them as a guide, not a measurement.
| City | 7-day estimate |
|---|---|
| Laval | ≈ 7 µg/m³ |
| Longueuil | ≈ 7 µg/m³ |
| Rosemont–La Petite-Patrie | ≈ 7 µg/m³ |
| Villeray–Saint-Michel–Parc-Extension | ≈ 7 µg/m³ |
| Lévis | ≈ 8 µg/m³ |
| Mercier–Hochelaga-Maisonneuve | ≈ 7 µg/m³ |
| Saint-Louis-de-Terrebonne | ≈ 7 µg/m³ |
| Terrebonne | ≈ 7 µg/m³ |
| Le Plateau-Mont-Royal | ≈ 7 µg/m³ |
| Ville-Marie | ≈ 7 µg/m³ |
| Montréal-Nord | ≈ 7 µg/m³ |
| Le Sud-Ouest | ≈ 7 µg/m³ |
| Repentigny | ≈ 7 µg/m³ |
| Pierrefonds-Roxboro | ≈ 5 µg/m³ |
| Pierrefonds | ≈ 5 µg/m³ |
| Aylmer | ≈ 5 µg/m³ |
| Saint-Michel | ≈ 7 µg/m³ |
| Saint-Jérôme | ≈ 5 µg/m³ |
| Saint-Hyacinthe | ≈ 5 µg/m³ |
| Dollard-Des Ormeaux | ≈ 5 µg/m³ |
| Blainville | ≈ 5 µg/m³ |
| Salaberry-de-Valleyfield | ≈ 5 µg/m³ |
| Châteauguay | ≈ 6 µg/m³ |
| Rimouski | ≈ 5 µg/m³ |
| Saint-Eustache | ≈ 5 µg/m³ |
| Val-des-Arbres | ≈ 7 µg/m³ |
| Boucherville | ≈ 7 µg/m³ |
| Neufchâtel-Est–Lebourgneuf | ≈ 8 µg/m³ |
| Laval-des-Rapides | ≈ 7 µg/m³ |
| Joliette | ≈ 4 µg/m³ |
| Cartierville | ≈ 7 µg/m³ |
| Mascouche | ≈ 7 µg/m³ |
| Mirabel | ≈ 5 µg/m³ |
| Victoriaville | ≈ 4 µg/m³ |
| Côte-Saint-Luc | ≈ 7 µg/m³ |
| Pointe-Claire | ≈ 5 µg/m³ |
| Alma | ≈ 4 µg/m³ |
| Sainte-Julie | ≈ 7 µg/m³ |
| Saint-Constant | ≈ 6 µg/m³ |
| Boisbriand | ≈ 5 µg/m³ |
Use this board
SmogRank, most polluted cities in Quebec, Canada, PM2.5, this year to 2 Oct 2026, 00:00 UTC, smogrank.com/ca/region/quebec?w=year.
You're welcome to reuse a single chart, image or figure with this citation and a link. Terms.
Updated 2026-10-02 00:07 UTC. Values are PM2.5 in µg/m³ (fine particles), the median of each city's monitors.