SmogRank / Episodes / Czechia
Czechia, Austria and 2 more countries, October 2023
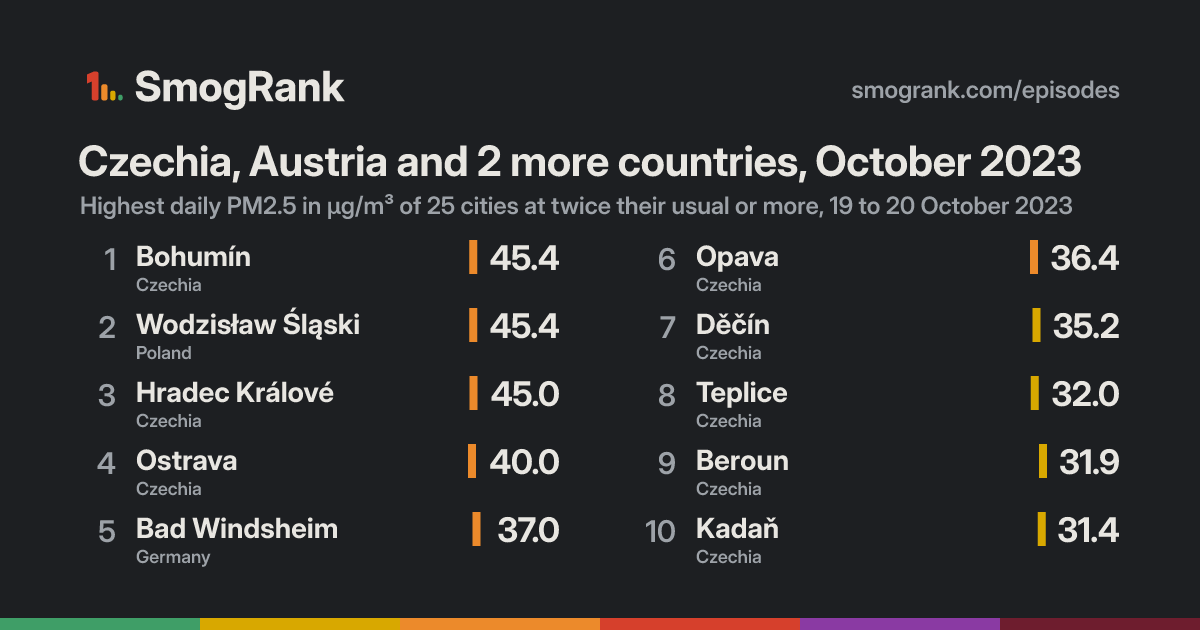
For 2 days, from 19 to 20 October 2023, 25 cities in Czechia, Austria, Germany and 1 more countries had PM2.5 at least twice their usual for the time of year. The worst reading was Bohumín, Moravian-Silesian Region, Czechia: 45.4 µg/m³ on 19 October, about 3.7× its usual 12.4. Ended 20 October.
No cause named We have no fire or smoke records for these days, so we only say what the measurements show.
Cities reached 25 in 4 countries
Days 2 19 to 20 October 2023
Worst day 20 October 15 cities counted
Furthest above usual 6.1× Bad Windsheim
Day by day
Play 20 October 15 cities at twice their usual or more
Kladno Pilsen Sankt Valentin Wels Passau Steyr Litvínov Pardubice Liberec Sankt Pölten Tulln Sokolov Burghausen Salzburg Brno Klosterneuburg Židenice Perchtoldsdorf Moravská Třebová Slatina Mödling Vienna Mikulov Bad Vöslau Weiden Trostberg an der Alz Schwandorf in Bayern Traunreut Groß-Enzersdorf Marktredwitz Voitsberg Weiz Graz Saalfelden am Steinernen Meer Altenburg Greiz Eisenstadt Kelheim Neustadt an der Donau Gera Hainburg an der Donau Kiefersfelden Karlova Ves Bratislava Kroměříž Přerov Senica Munich Zlín Jena Trnava Saalfeld Nuremberg Starnberg Weimar Valašské Meziříčí Bamberg Coburg Győr Trenčín Augsburg Erfurt Nitra Kolárovo Ansbach Oettingen in Bayern Frýdek-Místek Suhl Partizánske Veszprém Meiningen Český Těšín Cieszyn Nordhausen Prievidza Třinec Žilina Handlová Mühlhausen Eisenach Kempten (Allgäu) Žiar nad Hronom Martin Würzburg Neu-Ulm Esztergom Banská Bystrica Zvolen Ružomberok Göttingen Lindau Dunaújváros Gyál Aschaffenburg Großostheim Revúca Veľká Lomnica Smižany Spišská Nová Ves Zürich Kazincbarcika Znojmo Olomouc Havířov Prague Beroun Amstetten České Budějovice Linz Traun Děčín Studénka Mladá Boleslav Most Attnang-Puchheim Ansfelden Enns Teplice Ústí nad Labem Kadaň Ostrava Hradec Králové Wodzisław Śląski Bohumín Opava Bad Windsheim 16 Oct 17 18 19 20 21 22 23 Every measured city in the area, coloured by its PM2.5 that day; a dark ring marks a city at twice its usual or more. Bars: cities counted each day, coloured by their median level. Choose a day or press play; without JavaScript, the days link to that day's world ranking.
How it spread
Bohumín Bohumín, 16 October: 5.6 µg/m³ Bohumín, 17 October: 13.9 µg/m³ Bohumín, 18 October: 32.7 µg/m³ Bohumín, 19 October: 45.4 µg/m³, 3.7× its usual 12.4 Bohumín, 20 October: 24.7 µg/m³ Bohumín, 21 October: 17.2 µg/m³ Bohumín, 22 October: 9.0 µg/m³ Bohumín, 23 October: 9.1 µg/m³ Wodzisław Śląski Wodzisław Śląski, 16 October: 5.6 µg/m³ Wodzisław Śląski, 17 October: 13.9 µg/m³ Wodzisław Śląski, 18 October: 32.7 µg/m³ Wodzisław Śląski, 19 October: 45.4 µg/m³, 3.7× its usual 12.4 Wodzisław Śląski, 20 October: 24.7 µg/m³ Wodzisław Śląski, 21 October: 17.2 µg/m³ Wodzisław Śląski, 22 October: 9.0 µg/m³ Wodzisław Śląski, 23 October: 9.1 µg/m³ Ostrava Ostrava, 16 October: 6.6 µg/m³ Ostrava, 17 October: 17.2 µg/m³ Ostrava, 18 October: 21.7 µg/m³ Ostrava, 19 October: 40.0 µg/m³, 3.5× its usual 11.4 Ostrava, 20 October: 34.1 µg/m³, 3.1× its usual 11.1 Ostrava, 21 October: 15.1 µg/m³ Ostrava, 22 October: 7.9 µg/m³ Ostrava, 23 October: 9.0 µg/m³ Bad Windsheim Bad Windsheim, 16 October: 4.2 µg/m³ Bad Windsheim, 17 October: 6.0 µg/m³ Bad Windsheim, 18 October: 9.8 µg/m³ Bad Windsheim, 19 October: 37.0 µg/m³, 6.1× its usual 6.1 Bad Windsheim, 20 October: 11.7 µg/m³ Bad Windsheim, 21 October: 1.6 µg/m³ Bad Windsheim, 22 October: 3.5 µg/m³ Bad Windsheim, 23 October: 5.2 µg/m³ Hradec Králové Hradec Králové, 16 October: 4.2 µg/m³ Hradec Králové, 17 October: 13.0 µg/m³ Hradec Králové, 18 October: 17.2 µg/m³ Hradec Králové, 19 October: 30.9 µg/m³, 2.6× its usual 12.1 Hradec Králové, 20 October: 45.0 µg/m³, 3.7× its usual 12.1 Hradec Králové, 21 October: no reading Hradec Králové, 22 October: no reading Hradec Králové, 23 October: 9.6 µg/m³ Havířov Havířov, 16 October: 7.5 µg/m³ Havířov, 17 October: 15.1 µg/m³ Havířov, 18 October: 17.6 µg/m³ Havířov, 19 October: 30.7 µg/m³, 2.3× its usual 13.2 Havířov, 20 October: 23.6 µg/m³ Havířov, 21 October: 17.4 µg/m³ Havířov, 22 October: 9.2 µg/m³ Havířov, 23 October: 9.4 µg/m³ Opava Opava, 16 October: 5.9 µg/m³ Opava, 17 October: 7.4 µg/m³ Opava, 18 October: 15.8 µg/m³ Opava, 19 October: 28.6 µg/m³, 4.0× its usual 7.1 Opava, 20 October: 36.4 µg/m³, 5.2× its usual 7.0 Opava, 21 October: 19.6 µg/m³ Opava, 22 October: 13.9 µg/m³ Opava, 23 October: 8.6 µg/m³ Enns Enns, 16 October: 8.8 µg/m³ Enns, 17 October: 11.9 µg/m³ Enns, 18 October: 18.5 µg/m³ Enns, 19 October: 28.3 µg/m³, 2.8× its usual 10.1 Enns, 20 October: 21.3 µg/m³ Enns, 21 October: 10.3 µg/m³ Enns, 22 October: 2.9 µg/m³ Enns, 23 October: 8.5 µg/m³ Ansfelden Ansfelden, 16 October: 8.8 µg/m³ Ansfelden, 17 October: 11.9 µg/m³ Ansfelden, 18 October: 18.5 µg/m³ Ansfelden, 19 October: 28.3 µg/m³, 2.8× its usual 10.1 Ansfelden, 20 October: 21.3 µg/m³ Ansfelden, 21 October: 10.3 µg/m³ Ansfelden, 22 October: 2.9 µg/m³ Ansfelden, 23 October: 8.5 µg/m³ Traun Traun, 16 October: 12.9 µg/m³ Traun, 17 October: 12.3 µg/m³ Traun, 18 October: 18.9 µg/m³ Traun, 19 October: 26.9 µg/m³, 2.5× its usual 10.8 Traun, 20 October: 20.7 µg/m³ Traun, 21 October: 9.1 µg/m³ Traun, 22 October: 3.6 µg/m³ Traun, 23 October: 9.4 µg/m³ Znojmo Znojmo, 16 October: 5.0 µg/m³ Znojmo, 17 October: 9.9 µg/m³ Znojmo, 18 October: 10.6 µg/m³ Znojmo, 19 October: 26.0 µg/m³, 2.0× its usual 12.7 Znojmo, 20 October: 22.9 µg/m³ Znojmo, 21 October: 15.5 µg/m³ Znojmo, 22 October: 7.1 µg/m³ Znojmo, 23 October: 8.8 µg/m³ Linz Linz, 16 October: 13.5 µg/m³ Linz, 17 October: 10.2 µg/m³ Linz, 18 October: 14.5 µg/m³ Linz, 19 October: 25.1 µg/m³, 2.5× its usual 9.9 Linz, 20 October: 19.6 µg/m³ Linz, 21 October: 11.3 µg/m³ Linz, 22 October: 3.5 µg/m³ Linz, 23 October: 8.0 µg/m³ Amstetten Amstetten, 16 October: 7.3 µg/m³ Amstetten, 17 October: 10.1 µg/m³ Amstetten, 18 October: 16.4 µg/m³ Amstetten, 19 October: 25.0 µg/m³, 2.5× its usual 10.1 Amstetten, 20 October: 18.3 µg/m³ Amstetten, 21 October: 9.9 µg/m³ Amstetten, 22 October: 3.6 µg/m³ Amstetten, 23 October: 8.0 µg/m³ Děčín Děčín, 16 October: 8.0 µg/m³ Děčín, 17 October: 16.2 µg/m³ Děčín, 18 October: 23.3 µg/m³ Děčín, 19 October: 22.1 µg/m³ Děčín, 20 October: 35.2 µg/m³, 2.5× its usual 14.3 Děčín, 21 October: 28.0 µg/m³ Děčín, 22 October: 14.9 µg/m³ Děčín, 23 October: 12.3 µg/m³ Teplice Teplice, 16 October: 3.4 µg/m³ Teplice, 17 October: 12.3 µg/m³ Teplice, 18 October: 14.7 µg/m³ Teplice, 19 October: 18.2 µg/m³ Teplice, 20 October: 32.0 µg/m³, 2.8× its usual 11.6 Teplice, 21 October: 14.9 µg/m³ Teplice, 22 October: 7.2 µg/m³ Teplice, 23 October: 10.5 µg/m³ Beroun Beroun, 16 October: no reading Beroun, 17 October: 12.2 µg/m³ Beroun, 18 October: 20.3 µg/m³ Beroun, 19 October: 24.7 µg/m³ Beroun, 20 October: 31.9 µg/m³, 2.4× its usual 13.5 Beroun, 21 October: 15.2 µg/m³ Beroun, 22 October: no reading Beroun, 23 October: 13.0 µg/m³ Kadaň Kadaň, 16 October: no reading Kadaň, 17 October: 8.7 µg/m³ Kadaň, 18 October: 19.2 µg/m³ Kadaň, 19 October: 21.6 µg/m³ Kadaň, 20 October: 31.4 µg/m³, 3.0× its usual 10.3 Kadaň, 21 October: 12.6 µg/m³ Kadaň, 22 October: 7.0 µg/m³ Kadaň, 23 October: no reading Most Most, 16 October: 6.4 µg/m³ Most, 17 October: 13.6 µg/m³ Most, 18 October: 17.2 µg/m³ Most, 19 October: 19.2 µg/m³ Most, 20 October: 30.4 µg/m³, 2.7× its usual 11.1 Most, 21 October: 16.5 µg/m³ Most, 22 October: 5.8 µg/m³ Most, 23 October: 8.1 µg/m³ Ústí nad Labem Ústí nad Labem, 16 October: 5.3 µg/m³ Ústí nad Labem, 17 October: 11.8 µg/m³ Ústí nad Labem, 18 October: 14.9 µg/m³ Ústí nad Labem, 19 October: 20.4 µg/m³ Ústí nad Labem, 20 October: 30.0 µg/m³, 2.9× its usual 10.4 Ústí nad Labem, 21 October: 17.6 µg/m³ Ústí nad Labem, 22 October: 5.8 µg/m³ Ústí nad Labem, 23 October: 9.4 µg/m³ Mladá Boleslav Mladá Boleslav, 16 October: 4.8 µg/m³ Mladá Boleslav, 17 October: 15.6 µg/m³ Mladá Boleslav, 18 October: 15.1 µg/m³ Mladá Boleslav, 19 October: 20.4 µg/m³ Mladá Boleslav, 20 October: 30.0 µg/m³, 2.6× its usual 11.4 Mladá Boleslav, 21 October: 19.2 µg/m³ Mladá Boleslav, 22 October: 7.3 µg/m³ Mladá Boleslav, 23 October: 8.4 µg/m³ Olomouc Olomouc, 16 October: 9.1 µg/m³ Olomouc, 17 October: 16.4 µg/m³ Olomouc, 18 October: 17.0 µg/m³ Olomouc, 19 October: 24.7 µg/m³ Olomouc, 20 October: 28.9 µg/m³, 2.2× its usual 12.9 Olomouc, 21 October: 19.0 µg/m³ Olomouc, 22 October: 9.2 µg/m³ Olomouc, 23 October: 15.0 µg/m³ Studénka Studénka, 16 October: 5.4 µg/m³ Studénka, 17 October: 13.9 µg/m³ Studénka, 18 October: 18.0 µg/m³ Studénka, 19 October: 23.5 µg/m³ Studénka, 20 October: 28.8 µg/m³, 2.6× its usual 11.0 Studénka, 21 October: 16.6 µg/m³ Studénka, 22 October: 9.6 µg/m³ Studénka, 23 October: 7.7 µg/m³ Prague Prague, 16 October: 5.8 µg/m³ Prague, 17 October: 13.6 µg/m³ Prague, 18 October: 15.1 µg/m³ Prague, 19 October: 20.6 µg/m³ Prague, 20 October: 27.5 µg/m³, 2.4× its usual 11.6 Prague, 21 October: 15.2 µg/m³ Prague, 22 October: 8.3 µg/m³ Prague, 23 October: 8.7 µg/m³ Attnang-Puchheim Attnang-Puchheim, 16 October: 6.6 µg/m³ Attnang-Puchheim, 17 October: 11.2 µg/m³ Attnang-Puchheim, 18 October: 17.9 µg/m³ Attnang-Puchheim, 19 October: 24.3 µg/m³ Attnang-Puchheim, 20 October: 25.1 µg/m³, 2.8× its usual 9.1 Attnang-Puchheim, 21 October: 4.0 µg/m³ Attnang-Puchheim, 22 October: 2.6 µg/m³ Attnang-Puchheim, 23 October: 7.6 µg/m³ České Budějovice České Budějovice, 16 October: 6.0 µg/m³ České Budějovice, 17 October: 11.2 µg/m³ České Budějovice, 18 October: 18.9 µg/m³ České Budějovice, 19 October: 21.2 µg/m³ České Budějovice, 20 October: 25.1 µg/m³, 2.5× its usual 10.2 České Budějovice, 21 October: 17.2 µg/m³ České Budějovice, 22 October: 8.2 µg/m³ České Budějovice, 23 October: 8.8 µg/m³ 16 Oct 17 18 19 20 21 22 23 Every counted city, in the order the episode reached them, 3 days before to 3 after. Each square is a day, coloured by that day's PM2.5; outlined: at twice the city's usual or more. Good 0–50
Moderate 51–100
Sensitive groups 101–150
Unhealthy 151–200
Very unhealthy 201–300
Hazardous 301+
Every city it reached
City Days Highest Usual Above usual
Bad Windsheim Bavaria, Germany 1 19 October 6.1 6.1× Opava Moravian-Silesian Region, Czechia 2 20 October 7.0 5.2× Bohumín Moravian-Silesian Region, Czechia 1 19 October 12.4 3.7× Wodzisław Śląski Silesia, Poland 1 19 October 12.4 3.7× Hradec Králové Hradec Králové Region, Czechia 2 20 October 12.1 3.7× Ostrava Moravian-Silesian Region, Czechia 2 19 October 11.4 3.5× Kadaň Ústí nad Labem Region, Czechia 1 20 October 10.3 3.0× Ústí nad Labem Ústí nad Labem Region, Czechia 1 20 October 10.4 2.9× Teplice Ústí nad Labem Region, Czechia 1 20 October 11.6 2.8× Enns Upper Austria, Austria 1 19 October 10.1 2.8× Ansfelden Upper Austria, Austria 1 19 October 10.1 2.8× Attnang-Puchheim Upper Austria, Austria 1 20 October 9.1 2.8× Most Ústí nad Labem Region, Czechia 1 20 October 11.1 2.7× Mladá Boleslav Central Bohemia, Czechia 1 20 October 11.4 2.6× Studénka Moravian-Silesian Region, Czechia 1 20 October 11.0 2.6× Děčín Ústí nad Labem Region, Czechia 1 20 October 14.3 2.5× Traun Upper Austria, Austria 1 19 October 10.8 2.5× Linz Upper Austria, Austria 1 19 October 9.9 2.5× České Budějovice South Bohemian Region, Czechia 1 20 October 10.2 2.5× Amstetten Lower Austria, Austria 1 19 October 10.1 2.5× Beroun Central Bohemia, Czechia 1 20 October 13.5 2.4× Prague Prague, Czechia 1 20 October 11.6 2.4× Havířov Moravian-Silesian Region, Czechia 1 19 October 13.2 2.3× Olomouc Olomouc Region, Czechia 1 20 October 12.9 2.2× Znojmo South Moravian, Czechia 1 19 October 12.7 2.0×
Daily means in µg/m³, over the days each city counted in this episode. Highest: its highest of those days. Usual: the city's median for the time of year of that day (its days within 21 days of the date, every year, leaving out the week around it). Above usual: its highest day against that, with a usual under 5 µg/m³ taken as 5.
Against other episodes in Czechia and Austria
Number 6 of 14 episodes in Czechia and Austria since our records began, by cities reached.
Europe, December 2023 134 Eastern Europe, January 2023 59 Eastern Europe, November and December 2023 49 Eastern Europe, January 2025 32 Eastern Europe, January 2024 28 Czechia, Austria and 2 more countries, October 2023 25 Czechia, Poland and Slovakia, November 2025 21 Czechia, Slovakia and 2 more countries, December 2023 19 Germany, Czechia and 2 more countries, January 2024 18 Poland and Czechia, January 2023 18 Poland and Czechia, December 2024 10 Czechia, Slovakia and Poland, January 2023 9 Bars: cities reached; colour: the level of the episode's highest daily reading. All 14 .
Use this page SmogRank, Czechia, Austria and 2 more countries, October 2023: 25 cities with PM2.5 at twice their usual or more, 19 to 20 October 2023, smogrank.com/episodes/2023-10-czechia-austria-and-2-more-countries (accessed 5 October 2026).
Copy citation Download top 10 (PNG)
You're welcome to reuse a single chart, image or figure with this citation and a link. Terms .
An episode is a run of days when many cities close to each other (four or more within 350 km on a day, 8 or more in all) each had a daily PM2.5 mean of at least 25 µg/m³ and at least 2 times their usual for that time of year. Found in our own measurements, not picked by hand. How we find episodes . Values are each city's daily mean of its own monitors; causes are the usual kinds for a pattern like this, not a confirmed source.