SmogRank / Episodes / North Macedonia
South-eastern Europe, February 2024
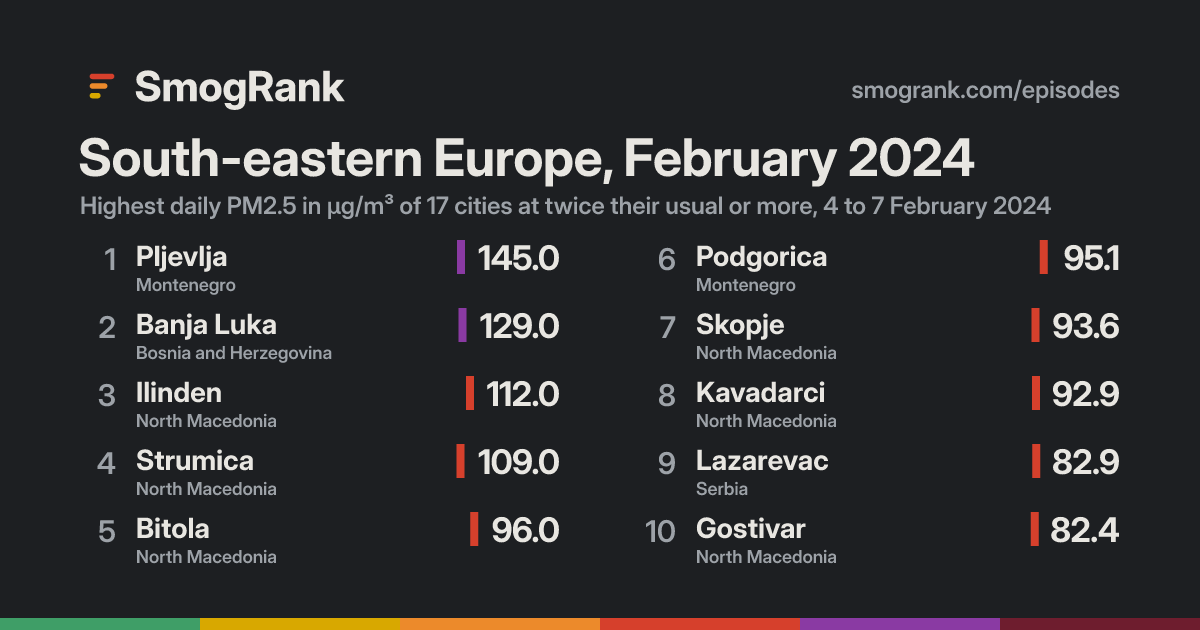
For 4 days, from 4 to 7 February 2024, 17 cities in North Macedonia, Greece, Montenegro and 3 more countries had PM2.5 at least twice their usual for the time of year. The worst reading was Pljevlja, Pljevlja, Montenegro: 145.0 µg/m³ on 5 February, about 2.8× its usual 52.0.
No cause named We have no fire or smoke records for these days, so we only say what the measurements show.
Cities reached 17 in 6 countries
Days 4 4 to 7 February 2024
Worst day 7 February 10 cities counted
Furthest above usual 3.8× Ilinden
Day by day
Play 7 February 10 cities at twice their usual or more
Ohrid Korçë Tetovo Prizren Durrës Fier Pejë Kosovo Polje Pristina Gjilan Bar Mitrovicë Kozáni Novi Pazar Tríkala Niš Kardítsa Lecce Užice Galatina Lárisa Pylaía Brindisi Ćuprija Sofia Monopoli Sarajevo Paolo VI Obrenovac Mostar Sremčica Smederevo Taranto Pátra Belgrade Zemun Pančevo Casamassima Bari Botevgrad Novi Sad Futog Altamura Travnik Andria Barletta Craiova Asprópyrgos Acharnés Khalándrion Foggia Sevlievo Gabrovo San Severo Haskovo Lucera Dimitrovgrad Bihać Lazarevac Kavadarci Ilinden Thessaloníki Banja Luka Gostivar Piraeus Veles Ceglie Messapica Kochani Athens Bitola Pljevlja Strumica Skopje Volos Podgorica 1 Feb 2 3 4 5 6 7 8 9 10 Every measured city in the area, coloured by its PM2.5 that day; a dark ring marks a city at twice its usual or more. Bars: cities counted each day, coloured by their median level. Choose a day or press play; without JavaScript, the days link to that day's world ranking.
How it spread
Strumica Strumica, 1 February: 103.3 µg/m³, 2.6× usual Strumica, 2 February: 71.4 µg/m³, 1.8× usual Strumica, 3 February: 65.6 µg/m³, 1.7× usual Strumica, 4 February: 89.6 µg/m³, 2.3× usual Strumica, 5 February: 109.0 µg/m³, 2.8× usual Strumica, 6 February: 99.5 µg/m³, 2.5× usual Strumica, 7 February: 91.3 µg/m³, 2.3× usual Strumica, 8 February: 90.5 µg/m³, 2.3× usual Strumica, 9 February: 52.5 µg/m³, 1.3× usual Strumica, 10 February: 86.1 µg/m³, 2.2× usual Kavadarci Kavadarci, 1 February: 92.9 µg/m³, 2.3× usual Kavadarci, 2 February: 39.5 µg/m³, 1.0× usual Kavadarci, 3 February: 78.3 µg/m³, 2.0× usual Kavadarci, 4 February: 74.3 µg/m³, 1.9× usual Kavadarci, 5 February: 69.8 µg/m³, 1.7× usual Kavadarci, 6 February: 80.8 µg/m³, 2.0× usual Kavadarci, 7 February: 80.8 µg/m³, 2.0× usual Kavadarci, 8 February: 74.4 µg/m³, 1.9× usual Kavadarci, 9 February: 56.1 µg/m³, 1.4× usual Kavadarci, 10 February: 49.3 µg/m³, 1.2× usual Skopje Skopje, 1 February: 86.9 µg/m³, 2.7× usual Skopje, 2 February: 63.7 µg/m³, 2.0× usual Skopje, 3 February: 65.1 µg/m³, 2.0× usual Skopje, 4 February: 92.1 µg/m³, 2.9× usual Skopje, 5 February: 88.1 µg/m³, 2.7× usual Skopje, 6 February: 87.3 µg/m³, 2.7× usual Skopje, 7 February: 93.6 µg/m³, 2.9× usual Skopje, 8 February: 81.0 µg/m³, 2.5× usual Skopje, 9 February: 65.9 µg/m³, 2.0× usual Skopje, 10 February: 61.2 µg/m³, 1.9× usual Bitola Bitola, 1 February: 83.7 µg/m³, 2.3× usual Bitola, 2 February: 79.0 µg/m³, 2.2× usual Bitola, 3 February: 62.6 µg/m³, 1.7× usual Bitola, 4 February: 96.0 µg/m³, 2.6× usual Bitola, 5 February: 48.1 µg/m³, 1.3× usual Bitola, 6 February: 40.6 µg/m³, 1.1× usual Bitola, 7 February: 41.5 µg/m³, 1.1× usual Bitola, 8 February: 28.3 µg/m³, 0.8× usual Bitola, 9 February: 34.7 µg/m³, 0.9× usual Bitola, 10 February: 23.0 µg/m³, 0.6× usual Thessaloníki Thessaloníki, 1 February: 41.0 µg/m³, 2.2× usual Thessaloníki, 2 February: 29.5 µg/m³, 1.6× usual Thessaloníki, 3 February: no reading Thessaloníki, 4 February: no reading Thessaloníki, 5 February: 35.2 µg/m³, 1.9× usual Thessaloníki, 6 February: no reading Thessaloníki, 7 February: 38.1 µg/m³, 2.1× usual Thessaloníki, 8 February: no reading Thessaloníki, 9 February: 36.9 µg/m³, 2.0× usual Thessaloníki, 10 February: 36.1 µg/m³, 2.0× usual Volos Volos, 1 February: 40.8 µg/m³, 2.3× usual Volos, 2 February: 27.3 µg/m³, 1.5× usual Volos, 3 February: 22.5 µg/m³, 1.2× usual Volos, 4 February: 51.5 µg/m³, 2.8× usual Volos, 5 February: 53.4 µg/m³, 3.0× usual Volos, 6 February: 33.9 µg/m³, 1.9× usual Volos, 7 February: 26.3 µg/m³, 1.5× usual Volos, 8 February: 22.7 µg/m³, 1.3× usual Volos, 9 February: 21.2 µg/m³, 1.2× usual Volos, 10 February: 26.8 µg/m³, 1.5× usual Kochani Kochani, 1 February: 40.1 µg/m³, 2.1× usual Kochani, 2 February: 43.7 µg/m³, 2.3× usual Kochani, 3 February: 25.9 µg/m³, 1.4× usual Kochani, 4 February: 37.5 µg/m³, 2.0× usual Kochani, 5 February: 27.0 µg/m³, 1.4× usual Kochani, 6 February: 39.2 µg/m³, 2.1× usual Kochani, 7 February: 49.6 µg/m³, 2.6× usual Kochani, 8 February: 32.9 µg/m³, 1.7× usual Kochani, 9 February: 27.5 µg/m³, 1.4× usual Kochani, 10 February: 48.9 µg/m³, 2.6× usual Athens Athens, 1 February: 26.4 µg/m³, 1.8× usual Athens, 2 February: 42.8 µg/m³, 2.9× usual Athens, 3 February: no reading Athens, 4 February: no reading Athens, 5 February: 38.3 µg/m³, 2.6× usual Athens, 6 February: 26.5 µg/m³, 1.8× usual Athens, 7 February: 20.1 µg/m³, 1.3× usual Athens, 8 February: 24.4 µg/m³, 1.6× usual Athens, 9 February: no reading Athens, 10 February: 18.9 µg/m³, 1.3× usual Piraeus Piraeus, 1 February: 11.5 µg/m³, 1.0× usual Piraeus, 2 February: 25.5 µg/m³, 2.2× usual Piraeus, 3 February: no reading Piraeus, 4 February: no reading Piraeus, 5 February: 27.3 µg/m³, 2.3× usual Piraeus, 6 February: 15.6 µg/m³, 1.3× usual Piraeus, 7 February: 11.1 µg/m³, 0.9× usual Piraeus, 8 February: 15.9 µg/m³, 1.4× usual Piraeus, 9 February: 14.1 µg/m³, 1.2× usual Piraeus, 10 February: 10.8 µg/m³, 0.9× usual Banja Luka Banja Luka, 1 February: 111.6 µg/m³, 1.9× usual Banja Luka, 2 February: 116.0 µg/m³, 2.0× usual Banja Luka, 3 February: 94.6 µg/m³, 1.6× usual Banja Luka, 4 February: 129.0 µg/m³, 2.2× usual Banja Luka, 5 February: 115.0 µg/m³, 2.0× usual Banja Luka, 6 February: 60.1 µg/m³, 1.0× usual Banja Luka, 7 February: 31.8 µg/m³, 0.5× usual Banja Luka, 8 February: 31.0 µg/m³, 0.5× usual Banja Luka, 9 February: 13.0 µg/m³, 0.2× usual Banja Luka, 10 February: 11.1 µg/m³, 0.2× usual Gostivar Gostivar, 1 February: 50.0 µg/m³, 1.3× usual Gostivar, 2 February: 45.1 µg/m³, 1.2× usual Gostivar, 3 February: 57.7 µg/m³, 1.5× usual Gostivar, 4 February: 82.4 µg/m³, 2.2× usual Gostivar, 5 February: 21.7 µg/m³, 0.6× usual Gostivar, 6 February: 22.4 µg/m³, 0.6× usual Gostivar, 7 February: 20.3 µg/m³, 0.5× usual Gostivar, 8 February: 16.8 µg/m³, 0.4× usual Gostivar, 9 February: 15.5 µg/m³, 0.4× usual Gostivar, 10 February: 15.4 µg/m³, 0.4× usual Podgorica Podgorica, 1 February: no reading Podgorica, 2 February: no reading Podgorica, 3 February: 49.7 µg/m³, 2.0× usual Podgorica, 4 February: 73.9 µg/m³, 2.9× usual Podgorica, 5 February: 78.8 µg/m³, 3.1× usual Podgorica, 6 February: 65.3 µg/m³, 2.6× usual Podgorica, 7 February: 95.1 µg/m³, 3.8× usual Podgorica, 8 February: 62.2 µg/m³, 2.5× usual Podgorica, 9 February: 47.5 µg/m³, 1.9× usual Podgorica, 10 February: 23.9 µg/m³, 1.0× usual Ceglie Messapica Ceglie Messapica, 1 February: no reading Ceglie Messapica, 2 February: no reading Ceglie Messapica, 3 February: 19.3 µg/m³, 1.2× usual Ceglie Messapica, 4 February: 40.5 µg/m³, 2.5× usual Ceglie Messapica, 5 February: 22.2 µg/m³, 1.4× usual Ceglie Messapica, 6 February: 28.0 µg/m³, 1.8× usual Ceglie Messapica, 7 February: 17.1 µg/m³, 1.1× usual Ceglie Messapica, 8 February: 21.5 µg/m³, 1.3× usual Ceglie Messapica, 9 February: 17.2 µg/m³, 1.1× usual Ceglie Messapica, 10 February: 16.6 µg/m³, 1.0× usual Pljevlja Pljevlja, 1 February: no reading Pljevlja, 2 February: no reading Pljevlja, 3 February: 74.2 µg/m³, 1.4× usual Pljevlja, 4 February: 99.4 µg/m³, 1.9× usual Pljevlja, 5 February: 145.0 µg/m³, 2.8× usual Pljevlja, 6 February: 121.0 µg/m³, 2.3× usual Pljevlja, 7 February: 111.0 µg/m³, 2.1× usual Pljevlja, 8 February: 96.6 µg/m³, 1.9× usual Pljevlja, 9 February: 59.2 µg/m³, 1.1× usual Pljevlja, 10 February: 13.0 µg/m³, 0.3× usual Veles Veles, 1 February: 56.7 µg/m³, 1.8× usual Veles, 2 February: 33.8 µg/m³, 1.1× usual Veles, 3 February: 49.9 µg/m³, 1.6× usual Veles, 4 February: 48.7 µg/m³, 1.5× usual Veles, 5 February: 70.3 µg/m³, 2.2× usual Veles, 6 February: 66.5 µg/m³, 2.1× usual Veles, 7 February: 76.8 µg/m³, 2.4× usual Veles, 8 February: 61.3 µg/m³, 1.9× usual Veles, 9 February: 54.5 µg/m³, 1.7× usual Veles, 10 February: 36.9 µg/m³, 1.2× usual Lazarevac Lazarevac, 1 February: no reading Lazarevac, 2 February: no reading Lazarevac, 3 February: 39.1 µg/m³, 1.0× usual Lazarevac, 4 February: 45.3 µg/m³, 1.1× usual Lazarevac, 5 February: 59.0 µg/m³, 1.4× usual Lazarevac, 6 February: 69.9 µg/m³, 1.7× usual Lazarevac, 7 February: 82.9 µg/m³, 2.0× usual Lazarevac, 8 February: 41.4 µg/m³, 1.0× usual Lazarevac, 9 February: 26.2 µg/m³, 0.6× usual Lazarevac, 10 February: 16.5 µg/m³, 0.4× usual Ilinden Ilinden, 1 February: 46.0 µg/m³, 1.7× usual Ilinden, 2 February: 44.9 µg/m³, 1.7× usual Ilinden, 3 February: 29.6 µg/m³, 1.1× usual Ilinden, 4 February: 55.8 µg/m³, 2.1× usual Ilinden, 5 February: 51.0 µg/m³, 1.9× usual Ilinden, 6 February: 42.3 µg/m³, 1.6× usual Ilinden, 7 February: 55.0 µg/m³, 2.1× usual Ilinden, 8 February: 47.0 µg/m³, 1.8× usual Ilinden, 9 February: 31.1 µg/m³, 1.2× usual Ilinden, 10 February: 112.0 µg/m³, 4.2× usual 1 Feb 2 3 4 5 6 7 8 9 10 Every counted city, in the order the episode reached them, 3 days before to 3 after. Each square is a day, coloured by that day's PM2.5; outlined: at twice the city's usual or more. Good 0–50
Moderate 51–100
Sensitive groups 101–150
Unhealthy 151–200
Very unhealthy 201–300
Hazardous 301+
Every city it reached
City Days Highest Usual Above usual
Ilinden Ilinden, North Macedonia 1 10 February 26.4 4.2× Podgorica Podgorica, Montenegro 4 7 February 25.1 3.8× Volos Thessaly, Greece 2 5 February 18.1 3.0× Skopje Grad Skopje, North Macedonia 4 7 February 32.3 2.9× Athens Attica, Greece 1 2 February 14.9 2.9× Pljevlja Pljevlja, Montenegro 3 5 February 52.0 2.8× Strumica Strumica, North Macedonia 4 5 February 39.5 2.8× Bitola Bitola, North Macedonia 1 4 February 36.6 2.6× Kochani Kochani, North Macedonia 2 7 February 19.1 2.6× Ceglie Messapica Apulia, Italy 1 4 February 16.0 2.5× Veles Veles, North Macedonia 3 7 February 31.5 2.4× Piraeus Attica, Greece 1 5 February 11.7 2.3× Kavadarci Kavadarci, North Macedonia 2 1 February 40.1 2.3× Thessaloníki Central Macedonia, Greece 1 1 February 18.5 2.2× Banja Luka Srpska, Bosnia and Herzegovina 1 4 February 58.4 2.2× Gostivar Gostivar, North Macedonia 1 4 February 37.7 2.2× Lazarevac Central Serbia, Serbia 1 7 February 40.7 2.0×
Daily means in µg/m³. Usual: the city's median for this time of year (its days within 21 days of the date, every year, leaving out the week around it). Above usual: its highest day against that.
Against other episodes in North Macedonia and Greece
Number 3 of 4 episodes in North Macedonia and Greece since our records began, by cities reached.
Bars: cities reached; colour: the level of the episode's highest daily reading.
Use this page SmogRank, South-eastern Europe, February 2024: 17 cities with PM2.5 at twice their usual or more, 4 to 7 February 2024, smogrank.com/episodes/2024-02-south-eastern-europe (accessed 3 October 2026).
Copy citation Download top 10 (PNG)
You're welcome to reuse a single chart, image or figure with this citation and a link. Terms .
An episode is a run of days when many cities close to each other (four or more within 350 km on a day, 8 or more in all) each had a daily PM2.5 mean of at least 25 µg/m³ and at least 2 times their usual for that time of year. Found in our own measurements, not picked by hand. How we find episodes . Values are each city's daily mean of its own monitors; causes are the usual kinds for a pattern like this, not a confirmed source.