SmogRank / Episodes / Japan
Japan, June 2025
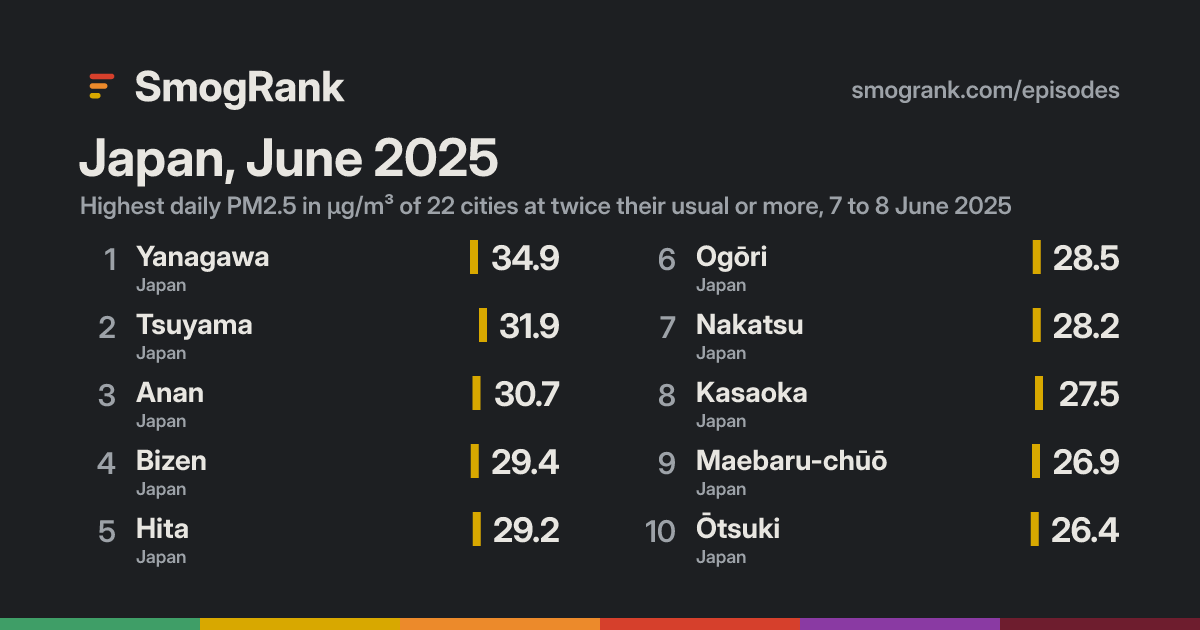
For 2 days, from 7 to 8 June 2025, 25 cities in Japan had PM2.5 at least twice their usual for the time of year. The worst reading was Yanagawa, Fukuoka, Japan: 34.9 µg/m³ on 7 June, about 5.8× its usual 6.0. Ended 8 June.
No cause named We have no fire or smoke records for these days, so we only say what the measurements show.
Cities reached 25 in 1 country
Days 2 7 to 8 June 2025
Worst day 8 June 20 cities counted
Furthest above usual 5.8× Yanagawa
Day by day
Play 8 June 20 cities at twice their usual or more
Narutochō-mitsuishi Tokushima Kamojimachō-jōgejima Sumoto Shido Tonoshō Yoshinogawa Hiragi Aioi Tatsuno Ikaruga Takamatsu Himeji Higashinozoe Kakogawachō-honmachi Akashi Kawaguchi Tamano Takinomiya Hiwasaura Ono Minato Arida Kainan Kobe Sennan Marugame Nishiwaki Zentsujichó Izumisano Iwade Gobō Ikedachō Kishiwada Sandachō Nishinomiya Kinokawa Izumi Kan’onjichō Takarazuka Asakuchi Tanba Amagasaki Sakai Osaka Toyonaka Sayama Tanabe Kawachi-Nagano Shikokuchūō Aki Habikino Tondabayashichō Hashimoto Higashiosaka Yao Fukuchiyama Yono Fukuyama Tottori-shi Ayabe Nankoku Takatsuki Hirakata Ikoma Toyooka Kameoka Hōryūji Niimi Kashiwara Kashihara-shi Shin’ichi Yawata Kochi Kurayoshi Niihama Kōtari Tenri Sugai Kyōtango Miyazu Maizuru Kizugawa Jōyō Ino Uji Kyoto Mihara Ōtsu Imabari Nabari Susaki Kusatsu Shingū Kitahama Yonago Takehara Ueno-ebisumachi Iga Kumano Obama Yasugichō Shinagawa Owase Miyoshi Kōka Ōmihachiman Kumagawa Sakaiminato Kuma Higashihiroshima Takashima Youkaichi Matsuyama Unnan Matsue Iyo Hikone Kure Kameyama Tsuruga Nagahama Matsusaka Tsu Yae Izumo Gion Hiroshima Saikū Nakamura Suzuka Yokkaichi Ise Inabe Ōdachō-ōda Kuwana Kaizu Uwajima Yawatahama Sabae Shima Ōgaki Toba Ōtake Iwakuni Ibi Hashima Mizuho Kaminoma Tokoname Gōtsuchō Fukui-shi Ama Yanai Ichinomiya Handa Mikuni Tōkai Gifu Minamichita Hamada Hekinan Nagoya Kariya Ono Kakamigahara Nishio Chiryū Hikari Inuyama Anjō Sekimachi Nisshin Owariasahi Kaga Kudamatsu Okazaki Masuda Seto Toyota Shūnan Minokamo Kani Gamagōri Tahara Tajimi Komatsu Toki Toyohashi Kunisaki Tsukumiura Matsutō Hōfu Saiki Usuki Kosai Nonoichi Shinshiro Tsurusaki Kanazawa Gero Yamaguchi Hagi Ōita Tsubata Hamamatsu Takayama Mie Oyabe Hamakita Tonami Ube Mine Nagato Yufu Onoda Nobeoka Fukuroi Takaoka Hyūga Buzen Iida Kiso Kakegawa Imizu Toyama Kanda Kikugawa Yukuhashi Shimonoseki Mitai Shimada Kitakyushu Ina Aso Takanabe Uozu Fujieda Tagawa Shintomi Nōgata Nakama Koga Okaya Shizuoka Matsumoto Iizuka Ukiha Ōzu Suwa Miyazaki Kikuchi Tanushimarumachi-toyoki Munakata Yame Mifune Yamaga Wakasugi Iwashita Kotō Uekimachi-mōno Koga Minami-Alps Tosu Kumamoto Kanbara Kurume Chikuma Fujinomiya Fukuoka Chikugo Tamana Uto Fuji Kofu Ueda Kobayashi Kanzakimachi-kanzaki Ōmuta Nagano Arao Hitoyoshi Honmachi Saku Yamanashi Saga Numazu Fujiyoshida Suzaka Shimoda Itoshima Obuse Susono Ōyanomachi-noboritate Izunokuni Gotemba Saikubo Taku Atami Karatsu Minamata Takeo Minamiashigara Ureshinomachi-shimojuku Odawara Isahaya Moroura Izumi Tomioka Hondomachi-hondo Imarichō-kō Hadano Ōmura Chichibu Kawatana Iki Nakanojō Tomioka Obita Hiratsuka Ōme Nagasaki Togitsu Minawa Aihara Matsuura Shibukawa Kodamachō-kodamaminami Sasebo Atsugi Hachiōji Chigasaki Ebina Yorii Furukawamen Ayase Hannō Honjō Morohongō Ogawamachi Akishima Minamirinkan Fujisawa Yamato Saikai Yokota Iruma Numata Machida Sakai-nakajima Sayama Kamakura Sakado Fuchū Higashimurayama Kodaira Tokorozawa Miura Azamino Higashi-Matsuyama Higashikurume Kumagaya Noborito Igusa Kawagoe Menuma Ōta Kiryū Yokosuka Yokohama Niiza Gyōda Kurihama Kōnosu Asaka Ashikaga Hanyū Tokyo Ageo Tatebayashi Saitama Kazo Sano Kukichūō Pohang Imaichi Saijō Onomichi Ōtsuki Hayashima Mima Kurashiki Kasaoka Bizen Sōja Nantan Okayama Maebaru-chūō Nakatsu Kariya Takahashi Shimogamo Hita Higashigō Kashima Beppu Anan Tsuyama Kasuga Ogōri Yanagawa On the map: 3 fire detections.
4 Jun 5 6 7 8 9 10 11 Every measured city in the area, coloured by its PM2.5 that day; a dark ring marks a city at twice its usual or more. Bars: cities counted each day, coloured by their median level. Choose a day or press play; without JavaScript, the days link to that day's world ranking. Fires, seen Heat satellites detected that day (via NASA FIRMS); bigger and glowing means more detections in the area. Farm burning and other fires count too, not only wildfires.Under the cities, for each UTC day: fires satellites detected (via NASA FIRMS), smoke NOAA analysts traced and volcanic ash warnings for aircraft. They show what was in the air, not that it caused the readings.
Fires: NASA FIRMS (VIIRS). Traced smoke: NOAA Hazard Mapping System. Volcanic ash: aviation ash warnings (SIGMETs) via NOAA's Aviation Weather Center.
How it spread
Yanagawa Yanagawa, 4 June: 9.2 µg/m³ Yanagawa, 5 June: 16.3 µg/m³ Yanagawa, 6 June: 13.1 µg/m³ Yanagawa, 7 June: 34.9 µg/m³, 5.8× its usual 6.0 Yanagawa, 8 June: 20.5 µg/m³ Yanagawa, 9 June: 5.1 µg/m³ Yanagawa, 10 June: 2.1 µg/m³ Yanagawa, 11 June: 4.8 µg/m³ Hita Hita, 4 June: 13.7 µg/m³ Hita, 5 June: 18.5 µg/m³ Hita, 6 June: 26.1 µg/m³ Hita, 7 June: 29.2 µg/m³, 2.8× its usual 10.4 Hita, 8 June: 27.4 µg/m³, 2.6× its usual 10.5 Hita, 9 June: 4.9 µg/m³ Hita, 10 June: 6.6 µg/m³ Hita, 11 June: 11.0 µg/m³ Ogōri Ogōri, 4 June: 12.2 µg/m³ Ogōri, 5 June: 14.8 µg/m³ Ogōri, 6 June: 16.2 µg/m³ Ogōri, 7 June: 28.5 µg/m³, 3.7× its usual 7.7 Ogōri, 8 June: 22.0 µg/m³ Ogōri, 9 June: 5.4 µg/m³ Ogōri, 10 June: 2.4 µg/m³ Ogōri, 11 June: 8.7 µg/m³ Nakatsu Nakatsu, 4 June: 14.5 µg/m³ Nakatsu, 5 June: 14.7 µg/m³ Nakatsu, 6 June: 22.0 µg/m³ Nakatsu, 7 June: 26.8 µg/m³, 2.5× its usual 10.6 Nakatsu, 8 June: 28.2 µg/m³, 2.7× its usual 10.6 Nakatsu, 9 June: 8.7 µg/m³ Nakatsu, 10 June: 8.1 µg/m³ Nakatsu, 11 June: 11.4 µg/m³ Higashigō Higashigō, 4 June: 12.9 µg/m³ Higashigō, 5 June: 15.9 µg/m³ Higashigō, 6 June: 15.1 µg/m³ Higashigō, 7 June: 26.2 µg/m³, 2.9× its usual 8.9 Higashigō, 8 June: 23.7 µg/m³ Higashigō, 9 June: 7.0 µg/m³ Higashigō, 10 June: 2.9 µg/m³ Higashigō, 11 June: 7.6 µg/m³ Kasuga Kasuga, 4 June: 11.2 µg/m³ Kasuga, 5 June: 11.5 µg/m³ Kasuga, 6 June: 11.9 µg/m³ Kasuga, 7 June: 26.1 µg/m³, 3.6× its usual 7.3 Kasuga, 8 June: 23.3 µg/m³ Kasuga, 9 June: 7.1 µg/m³ Kasuga, 10 June: 3.0 µg/m³ Kasuga, 11 June: 8.4 µg/m³ Kashima Kashima, 4 June: 10.0 µg/m³ Kashima, 5 June: 12.4 µg/m³ Kashima, 6 June: 13.6 µg/m³ Kashima, 7 June: 25.5 µg/m³, 3.0× its usual 8.6 Kashima, 8 June: 19.8 µg/m³ Kashima, 9 June: 6.1 µg/m³ Kashima, 10 June: 3.3 µg/m³ Kashima, 11 June: 7.3 µg/m³ Tsuyama Tsuyama, 4 June: 7.8 µg/m³ Tsuyama, 5 June: 11.7 µg/m³ Tsuyama, 6 June: 16.5 µg/m³ Tsuyama, 7 June: 18.3 µg/m³ Tsuyama, 8 June: 31.9 µg/m³, 3.5× its usual 9.1 Tsuyama, 9 June: 19.5 µg/m³ Tsuyama, 10 June: 4.8 µg/m³ Tsuyama, 11 June: 9.9 µg/m³ Anan Anan, 4 June: 15.0 µg/m³ Anan, 5 June: 18.0 µg/m³ Anan, 6 June: 18.1 µg/m³ Anan, 7 June: 21.5 µg/m³ Anan, 8 June: 30.7 µg/m³, 3.4× its usual 9.1 Anan, 9 June: 13.7 µg/m³ Anan, 10 June: 10.7 µg/m³ Anan, 11 June: 12.9 µg/m³ Bizen Bizen, 4 June: 10.5 µg/m³ Bizen, 5 June: 17.8 µg/m³ Bizen, 6 June: 19.3 µg/m³ Bizen, 7 June: 18.6 µg/m³ Bizen, 8 June: 29.4 µg/m³, 2.5× its usual 11.6 Bizen, 9 June: 17.9 µg/m³ Bizen, 10 June: 6.3 µg/m³ Bizen, 11 June: 14.9 µg/m³ Kasaoka Kasaoka, 4 June: 11.4 µg/m³ Kasaoka, 5 June: 15.0 µg/m³ Kasaoka, 6 June: 19.6 µg/m³ Kasaoka, 7 June: 23.8 µg/m³ Kasaoka, 8 June: 27.5 µg/m³, 2.4× its usual 11.7 Kasaoka, 9 June: 18.1 µg/m³ Kasaoka, 10 June: 6.8 µg/m³ Kasaoka, 11 June: 9.3 µg/m³ Maebaru-chūō Maebaru-chūō, 4 June: 12.9 µg/m³ Maebaru-chūō, 5 June: 12.1 µg/m³ Maebaru-chūō, 6 June: 12.1 µg/m³ Maebaru-chūō, 7 June: 20.4 µg/m³ Maebaru-chūō, 8 June: 26.9 µg/m³, 2.7× its usual 10.0 Maebaru-chūō, 9 June: 13.7 µg/m³ Maebaru-chūō, 10 June: 5.6 µg/m³ Maebaru-chūō, 11 June: 11.5 µg/m³ Shimogamo Shimogamo, 4 June: 8.6 µg/m³ Shimogamo, 5 June: 14.0 µg/m³ Shimogamo, 6 June: 18.9 µg/m³ Shimogamo, 7 June: 21.0 µg/m³ Shimogamo, 8 June: 26.5 µg/m³, 2.8× its usual 9.6 Shimogamo, 9 June: 17.6 µg/m³ Shimogamo, 10 June: 4.0 µg/m³ Shimogamo, 11 June: 10.8 µg/m³ Ōtsuki Ōtsuki, 4 June: 14.0 µg/m³ Ōtsuki, 5 June: 16.3 µg/m³ Ōtsuki, 6 June: 21.3 µg/m³ Ōtsuki, 7 June: 20.7 µg/m³ Ōtsuki, 8 June: 26.4 µg/m³, 2.2× its usual 11.8 Ōtsuki, 9 June: 24.4 µg/m³ Ōtsuki, 10 June: 16.1 µg/m³ Ōtsuki, 11 June: 12.5 µg/m³ Okayama Okayama, 4 June: 10.3 µg/m³ Okayama, 5 June: 14.3 µg/m³ Okayama, 6 June: 17.2 µg/m³ Okayama, 7 June: 19.6 µg/m³ Okayama, 8 June: 25.8 µg/m³, 2.7× its usual 9.5 Okayama, 9 June: 13.7 µg/m³ Okayama, 10 June: 4.3 µg/m³ Okayama, 11 June: 14.0 µg/m³ Kurashiki Kurashiki, 4 June: 11.6 µg/m³ Kurashiki, 5 June: 16.9 µg/m³ Kurashiki, 6 June: 23.3 µg/m³ Kurashiki, 7 June: 22.6 µg/m³ Kurashiki, 8 June: 25.8 µg/m³, 2.4× its usual 10.8 Kurashiki, 9 June: 15.9 µg/m³ Kurashiki, 10 June: 5.2 µg/m³ Kurashiki, 11 June: 13.8 µg/m³ Beppu Beppu, 4 June: 13.5 µg/m³ Beppu, 5 June: 12.4 µg/m³ Beppu, 6 June: 19.0 µg/m³ Beppu, 7 June: 22.1 µg/m³ Beppu, 8 June: 25.7 µg/m³, 3.0× its usual 8.7 Beppu, 9 June: 7.9 µg/m³ Beppu, 10 June: 9.5 µg/m³ Beppu, 11 June: 11.9 µg/m³ Takahashi Takahashi, 4 June: 6.9 µg/m³ Takahashi, 5 June: 12.2 µg/m³ Takahashi, 6 June: 20.3 µg/m³ Takahashi, 7 June: 22.9 µg/m³ Takahashi, 8 June: 25.7 µg/m³, 2.8× its usual 9.3 Takahashi, 9 June: 17.2 µg/m³ Takahashi, 10 June: 6.0 µg/m³ Takahashi, 11 June: 9.6 µg/m³ Nantan Nantan, 4 June: 9.3 µg/m³ Nantan, 5 June: 12.1 µg/m³ Nantan, 6 June: 12.0 µg/m³ Nantan, 7 June: 15.5 µg/m³ Nantan, 8 June: 25.7 µg/m³, 2.7× its usual 9.4 Nantan, 9 June: 15.2 µg/m³ Nantan, 10 June: 2.8 µg/m³ Nantan, 11 June: 7.6 µg/m³ Mima Mima, 4 June: 11.7 µg/m³ Mima, 5 June: 16.2 µg/m³ Mima, 6 June: 17.2 µg/m³ Mima, 7 June: 21.0 µg/m³ Mima, 8 June: 25.7 µg/m³, 2.4× its usual 10.7 Mima, 9 June: 14.1 µg/m³ Mima, 10 June: 7.0 µg/m³ Mima, 11 June: 9.1 µg/m³ Kariya Kariya, 4 June: 11.5 µg/m³ Kariya, 5 June: 16.4 µg/m³ Kariya, 6 June: 15.8 µg/m³ Kariya, 7 June: 16.0 µg/m³ Kariya, 8 June: 25.5 µg/m³, 2.8× its usual 9.1 Kariya, 9 June: 17.2 µg/m³ Kariya, 10 June: 3.6 µg/m³ Kariya, 11 June: 11.5 µg/m³ Hayashima Hayashima, 4 June: 10.5 µg/m³ Hayashima, 5 June: 14.6 µg/m³ Hayashima, 6 June: 25.5 µg/m³ Hayashima, 7 June: 21.7 µg/m³ Hayashima, 8 June: 25.4 µg/m³, 2.4× its usual 10.4 Hayashima, 9 June: 15.6 µg/m³ Hayashima, 10 June: 4.9 µg/m³ Hayashima, 11 June: 13.9 µg/m³ Sōja Sōja, 4 June: 8.5 µg/m³ Sōja, 5 June: 10.1 µg/m³ Sōja, 6 June: 18.6 µg/m³ Sōja, 7 June: 23.3 µg/m³ Sōja, 8 June: 25.3 µg/m³, 2.6× its usual 9.9 Sōja, 9 June: 16.6 µg/m³ Sōja, 10 June: 5.7 µg/m³ Sōja, 11 June: 10.8 µg/m³ Onomichi Onomichi, 4 June: 12.6 µg/m³ Onomichi, 5 June: 16.4 µg/m³ Onomichi, 6 June: no reading Onomichi, 7 June: 22.0 µg/m³ Onomichi, 8 June: 25.2 µg/m³, 2.1× its usual 11.8 Onomichi, 9 June: 21.6 µg/m³ Onomichi, 10 June: 7.9 µg/m³ Onomichi, 11 June: 10.3 µg/m³ Saijō Saijō, 4 June: 11.3 µg/m³ Saijō, 5 June: 14.8 µg/m³ Saijō, 6 June: 17.3 µg/m³ Saijō, 7 June: 21.5 µg/m³ Saijō, 8 June: 25.0 µg/m³, 2.0× its usual 12.5 Saijō, 9 June: 20.4 µg/m³ Saijō, 10 June: 8.9 µg/m³ Saijō, 11 June: 11.7 µg/m³ 4 Jun 5 6 7 8 9 10 11 Every counted city, in the order the episode reached them, 3 days before to 3 after. Each square is a day, coloured by that day's PM2.5; outlined: at twice the city's usual or more. Good 0–50
Moderate 51–100
Unhealthy for sensitive groups 101–150
Unhealthy 151–200
Very unhealthy 201–300
Hazardous 301+
Every city it reached
City Days Highest Usual Above usual
Yanagawa Fukuoka, Japan 1 7 June 6.0 5.8× Ogōri Fukuoka, Japan 1 7 June 7.7 3.7× Kasuga Fukuoka, Japan 1 7 June 7.3 3.6× Tsuyama Okayama, Japan 1 8 June 9.1 3.5× Anan Tokushima, Japan 1 8 June 9.1 3.4× Beppu Oita, Japan 1 8 June 8.7 3.0× Kashima Saga, Japan 1 7 June 8.6 3.0× Higashigō Saga, Japan 1 7 June 8.9 2.9× Hita Oita, Japan 2 7 June 10.4 2.8× Shimogamo Okayama, Japan 1 8 June 9.6 2.8× Takahashi Okayama, Japan 1 8 June 9.3 2.8× Kariya Hyōgo, Japan 1 8 June 9.1 2.8× Nakatsu Oita, Japan 2 8 June 10.6 2.7× Maebaru-chūō Fukuoka, Japan 1 8 June 10.0 2.7× Okayama Okayama, Japan 1 8 June 9.5 2.7× Nantan Kyoto, Japan 1 8 June 9.4 2.7× Sōja Okayama, Japan 1 8 June 9.9 2.6× Bizen Okayama, Japan 1 8 June 11.6 2.5× Kasaoka Okayama, Japan 1 8 June 11.7 2.4× Kurashiki Okayama, Japan 1 8 June 10.8 2.4× Mima Tokushima, Japan 1 8 June 10.7 2.4× Hayashima Okayama, Japan 1 8 June 10.4 2.4× Ōtsuki Yamanashi, Japan 1 8 June 11.8 2.2× Onomichi Hiroshima, Japan 1 8 June 11.8 2.1× Saijō Ehime, Japan 1 8 June 12.5 2.0×
Daily means in µg/m³, over the days each city counted in this episode. Highest: its highest of those days. Usual: the city's median for the time of year of that day (its days within 21 days of the date, every year, leaving out the week either side of it). Above usual: its highest day against that, with a usual under 5 µg/m³ taken as 5.
Compared with other episodes in Japan
Number 23 of 37 episodes in Japan since our records began, by cities reached.
Japan and South Korea, June and July 2025 532 Japan, South Korea and China, April 2024 525 Japan, South Korea and China, March 2025 502 Japan and South Korea, March 2026 322 Japan and South Korea, 22 to 24 January 2025 280 Japan, South Korea and China, July 2026 209 Japan and South Korea, February and March 2025 199 Japan, November 2023 133 Japan, 4 to 5 August 2025 130 Japan and South Korea, 31 January to 1 February 2025 113 Japan, May 2025 107 Japan, March 2025 96 Japan, June 2025 25 Bars: cities reached; colour: the level of the episode's highest daily reading. All 37 .
Use this page SmogRank, Japan, June 2025: 25 cities with PM2.5 at twice their usual or more, 7 to 8 June 2025, smogrank.com/episodes/2025-06-japan (accessed 17 November 2026).
Share Copy citation Download top 10 (PNG)
You're welcome to reuse a single chart, image or figure with this citation and a link. Terms .
An episode is a run of days when many cities close to each other (four or more within 350 km on a day, 8 or more in all) each had a daily PM2.5 mean of at least 25 µg/m³ and at least 2 times their usual for that time of year. Found in our own measurements, not picked by hand. How we find episodes . Values are each city's daily mean of its own monitors; causes are the usual kinds for a pattern like this, not a confirmed source.