SmogRank / Episodes / South Korea
South Korea, June 2025
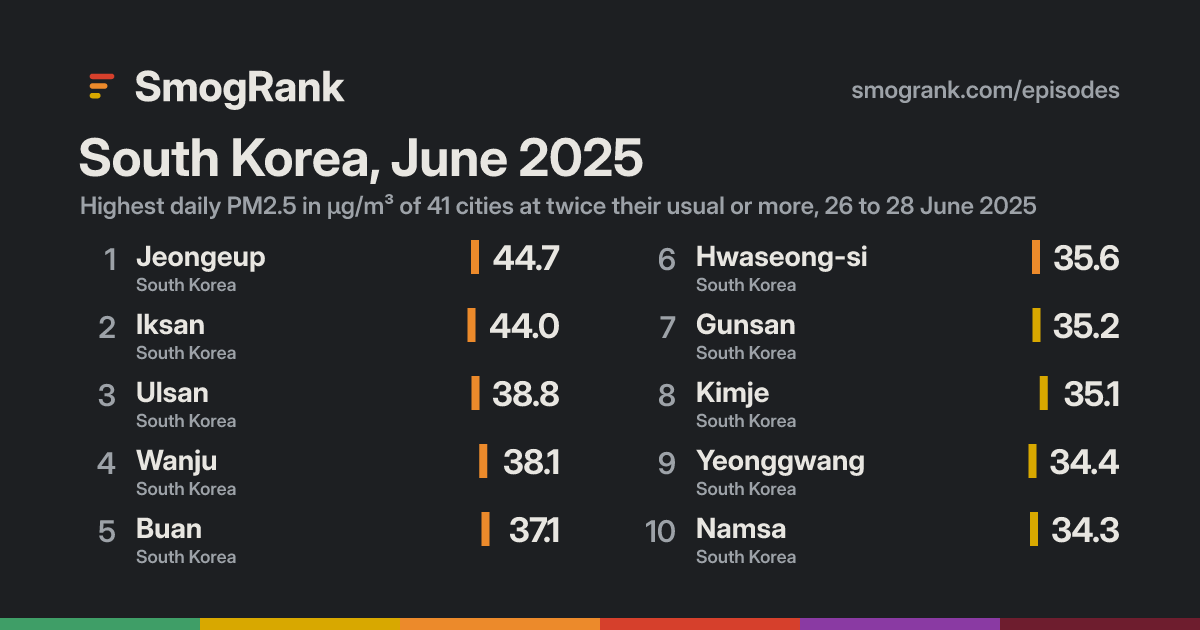
For 3 days, from 26 to 28 June 2025, 41 cities in South Korea had PM2.5 at least twice their usual for the time of year. The worst reading was Jeongeup, Jeollabuk-do, South Korea: 44.7 µg/m³ on 26 June, about 2.8× its usual 16.1.
Day by day
How it spread
Every city it reached
| City | Days | Highest | Above usual |
|---|---|---|---|
| JangseongJeollanam-do, South Korea | 1 | 32.026 June | 3.1× |
| NangenJeollabuk-do, South Korea | 2 | 31.626 June | 3.0× |
| YeongamJeollanam-do, South Korea | 1 | 28.726 June | 2.9× |
| JeongeupJeollabuk-do, South Korea | 1 | 44.726 June | 2.8× |
| GyeongjuGyeongsangbuk-do, South Korea | 1 | 28.228 June | 2.8× |
| YeonilGyeongsangbuk-do, South Korea | 1 | 31.028 June | 2.7× |
| YeonggwangJeollanam-do, South Korea | 1 | 34.426 June | 2.7× |
| UlsanUlsan, South Korea | 2 | 38.828 June | 2.6× |
| UngsangGyeongsangnam-do, South Korea | 1 | 31.427 June | 2.6× |
| IksanJeollabuk-do, South Korea | 1 | 44.026 June | 2.6× |
| ChangsuJeollabuk-do, South Korea | 2 | 30.726 June | 2.6× |
| GunsanJeollabuk-do, South Korea | 1 | 35.226 June | 2.5× |
| ImsilJeollabuk-do, South Korea | 2 | 29.826 June | 2.5× |
| NajuJeollanam-do, South Korea | 1 | 31.926 June | 2.5× |
| Jinan-gunJeollabuk-do, South Korea | 2 | 29.626 June | 2.5× |
| BuanJeollabuk-do, South Korea | 1 | 37.126 June | 2.5× |
| DaeguDaegu, South Korea | 1 | 27.328 June | 2.5× |
| KimhaeGyeongsangnam-do, South Korea | 1 | 28.527 June | 2.5× |
| NamsaJeollabuk-do, South Korea | 2 | 34.326 June | 2.4× |
| YŏnmuChungcheongnam-do, South Korea | 2 | 33.026 June | 2.4× |
| BusanBusan, South Korea | 2 | 29.627 June | 2.4× |
| GijangBusan, South Korea | 1 | 27.627 June | 2.4× |
| GwangjuGwangju, South Korea | 1 | 25.626 June | 2.4× |
| WanjuJeollabuk-do, South Korea | 1 | 38.126 June | 2.4× |
| HwawŏnDaegu, South Korea | 1 | 26.528 June | 2.4× |
| TongyeongGyeongsangnam-do, South Korea | 1 | 29.126 June | 2.4× |
| KinzanChungcheongnam-do, South Korea | 1 | 27.227 June | 2.4× |
| YangsanGyeongsangnam-do, South Korea | 1 | 27.527 June | 2.4× |
| Koch'angJeollabuk-do, South Korea | 1 | 30.026 June | 2.3× |
| MasanGwangju, South Korea | 1 | 28.126 June | 2.3× |
| Gyeongsan-siGyeongsangbuk-do, South Korea | 1 | 26.928 June | 2.3× |
| Hwaseong-siGyeonggi-do, South Korea | 1 | 35.627 June | 2.3× |
| KimjeJeollabuk-do, South Korea | 1 | 35.126 June | 2.3× |
| GoseongGyeongsangnam-do, South Korea | 1 | 27.726 June | 2.3× |
| SinhyeonGyeongsangnam-do, South Korea | 1 | 25.827 June | 2.2× |
| DamyangJeollanam-do, South Korea | 1 | 28.926 June | 2.2× |
| NaesŏGyeongsangnam-do, South Korea | 2 | 26.827 June | 2.2× |
| JeonjuJeollabuk-do, South Korea | 2 | 28.126 June | 2.2× |
| PohangGyeongsangbuk-do, South Korea | 1 | 32.328 June | 2.2× |
| ChangwonGyeongsangnam-do, South Korea | 1 | 27.627 June | 2.2× |
| ChinjuGyeongsangnam-do, South Korea | 2 | 25.927 June | 2.1× |
Daily means in µg/m³. Usual: the city's median for this time of year (its days within 21 days of the date, every year, leaving out the week around it). Above usual: its highest day against that.
Against other episodes in South Korea
Number 24 of 43 episodes in South Korea since our records began, by cities reached.
- Japan and South Korea, March 2025454
- Japan and South Korea, March 2026305
- Japan and South Korea, January 2025274
- Japan and South Korea, February and March 2025192
- South Korea and Japan, January 2026169
- South Korea and Japan, February 2026147
- South Korea, February 2025132
- South Korea, November 2025128
- South Korea, February 2026121
- South Korea, December 2025113
- South Korea, January 2025113
- South Korea, December 2025107
- South Korea, June 202541
Bars: cities reached; colour: the level of the episode's highest daily reading. All 43.
Use this page
SmogRank, South Korea, June 2025: 41 cities with PM2.5 at twice their usual or more, 26 to 28 June 2025, smogrank.com/episodes/2025-06-south-korea (accessed 2 October 2026).
You're welcome to reuse a single chart, image or figure with this citation and a link. Terms.
An episode is a run of days when many cities close to each other (four or more within 350 km on a day, 8 or more in all) each had a daily PM2.5 mean of at least 25 µg/m³ and at least 2 times their usual for that time of year. Found in our own measurements, not picked by hand. How we find episodes. Values are each city's daily mean of its own monitors; causes are the usual kinds for a pattern like this, not a confirmed source.