SmogRank / Episodes / South Korea
South Korea, 20 August 2026
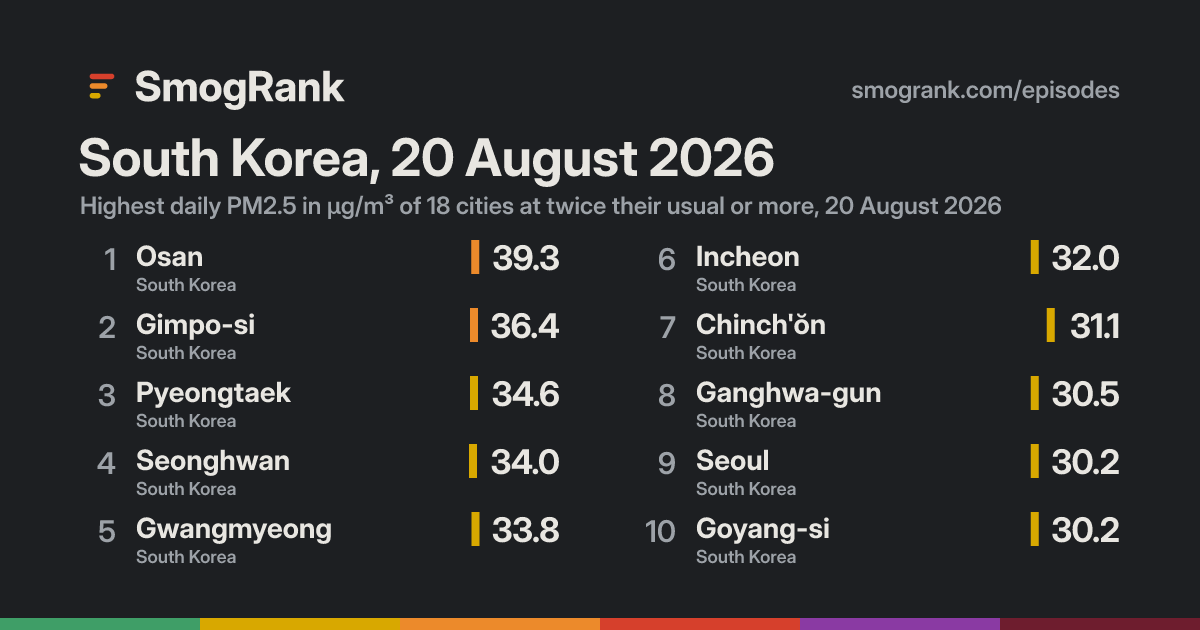
For 1 day, on 20 August 2026, 18 cities in South Korea had PM2.5 at least twice their usual for the time of year. The worst reading was Osan, Gyeonggi-do, South Korea: 39.3 µg/m³ on 20 August, about 3.4× its usual 11.4.
No cause named We have no fire or smoke records for these days, so we only say what the measurements show.
Cities reached 18 in 1 country
Days 1 20 August 2026
Worst day 20 August 18 cities counted
Furthest above usual 3.4× Osan
Day by day
Play 20 August 18 cities at twice their usual or more
Gwangju Seongnam-si Icheon-si Anseong Hanam Pubal Wabu Yangp'yŏng Namyangju Hwaseong-si Hwado Yeoju Cheonan Yangju Jungpyong Gapyeong Sejong Tangjin Cheongju-si Yesan Munsan Koesan Wŏnju Hongch’ŏn Chuncheon Taesal-li Gongju Hongseong Seosan Daejeon Cheorwon Hwacheon Okcheon Buyeo Nonsan Boryeong Yŏnmu Yanggu Kinzan Mungyeong Yeongdong Neietsu Sangju Namsa Iksan Gunsan Yecheon Wanju Jeonju Gimcheon Jinan-gun Yeongju Kimje Buan Gumi Changsu Imsil Andong Sokcho Kosong Jeongeup Kunwi Gangneung Jumunjin Waegwan T’aebaek Nangen Koch'ang Donghae City Hwawŏn Daegu Santyoku Jangseong Cheongsong gun Kurye Gyeongsan-si Hayang Yeonggwang Gwangju Changnyeong Eisen Masan Hwasun Chinju Hadong Naju Kwangyang Suncheon Miryang Gwangyang Muan Naesŏ Gyeongju Yeonil Pohang Changwon Goseong Mokpo Kimhae Yangsan Sinan Ungsang Tongyeong Ulsan Sinhyeon Busan Gijang Geoje Asan Suwon Ansan-si Ganghwa-gun Guri-si Incheon Uijeongbu-si Chinch'ŏn Seonghwan Anyang-si Goyang-si Seoul Pyeongtaek Gimpo-si Chungju Gwangmyeong Bucheon-si Osan 17 Aug 18 19 20 21 22 23 Every measured city in the area, coloured by its PM2.5 that day; a dark ring marks a city at twice its usual or more. Bars: cities counted each day, coloured by their median level. Choose a day or press play; without JavaScript, the days link to that day's world ranking.
How it spread
Osan Osan, 17 August: 5.8 µg/m³ Osan, 18 August: 15.0 µg/m³ Osan, 19 August: 20.7 µg/m³ Osan, 20 August: 39.3 µg/m³, 3.4× its usual 11.4 Osan, 21 August: 17.3 µg/m³ Osan, 22 August: 5.6 µg/m³ Osan, 23 August: 8.0 µg/m³ Gimpo-si Gimpo-si, 17 August: 9.0 µg/m³ Gimpo-si, 18 August: 14.5 µg/m³ Gimpo-si, 19 August: 22.4 µg/m³ Gimpo-si, 20 August: 36.4 µg/m³, 2.6× its usual 14.2 Gimpo-si, 21 August: 29.5 µg/m³ Gimpo-si, 22 August: 8.6 µg/m³ Gimpo-si, 23 August: 9.1 µg/m³ Pyeongtaek Pyeongtaek, 17 August: 6.3 µg/m³ Pyeongtaek, 18 August: 18.8 µg/m³ Pyeongtaek, 19 August: 23.6 µg/m³ Pyeongtaek, 20 August: 34.6 µg/m³, 2.6× its usual 13.4 Pyeongtaek, 21 August: 19.9 µg/m³ Pyeongtaek, 22 August: 6.5 µg/m³ Pyeongtaek, 23 August: 8.1 µg/m³ Seonghwan Seonghwan, 17 August: 10.7 µg/m³ Seonghwan, 18 August: 21.3 µg/m³ Seonghwan, 19 August: 21.7 µg/m³ Seonghwan, 20 August: 34.0 µg/m³, 2.5× its usual 13.7 Seonghwan, 21 August: 16.0 µg/m³ Seonghwan, 22 August: 11.4 µg/m³ Seonghwan, 23 August: 12.3 µg/m³ Gwangmyeong Gwangmyeong, 17 August: 8.8 µg/m³ Gwangmyeong, 18 August: 15.9 µg/m³ Gwangmyeong, 19 August: 22.3 µg/m³ Gwangmyeong, 20 August: 33.8 µg/m³, 2.7× its usual 12.7 Gwangmyeong, 21 August: 22.0 µg/m³ Gwangmyeong, 22 August: 6.5 µg/m³ Gwangmyeong, 23 August: 7.4 µg/m³ Incheon Incheon, 17 August: 7.6 µg/m³ Incheon, 18 August: 13.8 µg/m³ Incheon, 19 August: 21.6 µg/m³ Incheon, 20 August: 32.0 µg/m³, 2.4× its usual 13.5 Incheon, 21 August: 25.6 µg/m³ Incheon, 22 August: 7.5 µg/m³ Incheon, 23 August: 8.4 µg/m³ Chinch'ŏn Chinch'ŏn, 17 August: 4.4 µg/m³ Chinch'ŏn, 18 August: 15.5 µg/m³ Chinch'ŏn, 19 August: 17.9 µg/m³ Chinch'ŏn, 20 August: 31.1 µg/m³, 2.5× its usual 12.2 Chinch'ŏn, 21 August: 17.8 µg/m³ Chinch'ŏn, 22 August: 8.2 µg/m³ Chinch'ŏn, 23 August: 7.9 µg/m³ Ganghwa-gun Ganghwa-gun, 17 August: 10.4 µg/m³ Ganghwa-gun, 18 August: no reading Ganghwa-gun, 19 August: 18.8 µg/m³ Ganghwa-gun, 20 August: 30.5 µg/m³, 2.3× its usual 13.5 Ganghwa-gun, 21 August: 25.4 µg/m³ Ganghwa-gun, 22 August: 8.4 µg/m³ Ganghwa-gun, 23 August: 7.3 µg/m³ Seoul Seoul, 17 August: 7.6 µg/m³ Seoul, 18 August: 15.0 µg/m³ Seoul, 19 August: 23.0 µg/m³ Seoul, 20 August: 30.2 µg/m³, 2.6× its usual 11.8 Seoul, 21 August: 19.8 µg/m³ Seoul, 22 August: 6.8 µg/m³ Seoul, 23 August: 7.7 µg/m³ Goyang-si Goyang-si, 17 August: 6.3 µg/m³ Goyang-si, 18 August: 12.1 µg/m³ Goyang-si, 19 August: 19.0 µg/m³ Goyang-si, 20 August: 30.2 µg/m³, 2.6× its usual 11.5 Goyang-si, 21 August: 18.1 µg/m³ Goyang-si, 22 August: 4.9 µg/m³ Goyang-si, 23 August: 6.0 µg/m³ Bucheon-si Bucheon-si, 17 August: 6.8 µg/m³ Bucheon-si, 18 August: 12.6 µg/m³ Bucheon-si, 19 August: 19.0 µg/m³ Bucheon-si, 20 August: 30.1 µg/m³, 2.8× its usual 10.8 Bucheon-si, 21 August: 20.0 µg/m³ Bucheon-si, 22 August: 6.9 µg/m³ Bucheon-si, 23 August: 5.9 µg/m³ Chungju Chungju, 17 August: 3.9 µg/m³ Chungju, 18 August: 16.0 µg/m³ Chungju, 19 August: 19.9 µg/m³ Chungju, 20 August: 29.5 µg/m³, 2.7× its usual 10.9 Chungju, 21 August: 17.0 µg/m³ Chungju, 22 August: 10.1 µg/m³ Chungju, 23 August: 10.2 µg/m³ Guri-si Guri-si, 17 August: 7.3 µg/m³ Guri-si, 18 August: 12.5 µg/m³ Guri-si, 19 August: 22.7 µg/m³ Guri-si, 20 August: 29.4 µg/m³, 2.4× its usual 12.0 Guri-si, 21 August: 19.6 µg/m³ Guri-si, 22 August: 6.8 µg/m³ Guri-si, 23 August: 8.5 µg/m³ Anyang-si Anyang-si, 17 August: 5.9 µg/m³ Anyang-si, 18 August: 12.6 µg/m³ Anyang-si, 19 August: 18.8 µg/m³ Anyang-si, 20 August: 28.6 µg/m³, 2.6× its usual 10.8 Anyang-si, 21 August: 14.8 µg/m³ Anyang-si, 22 August: 5.2 µg/m³ Anyang-si, 23 August: 5.0 µg/m³ Ansan-si Ansan-si, 17 August: 6.4 µg/m³ Ansan-si, 18 August: 12.3 µg/m³ Ansan-si, 19 August: 22.5 µg/m³ Ansan-si, 20 August: 28.2 µg/m³, 2.3× its usual 12.3 Ansan-si, 21 August: 22.6 µg/m³ Ansan-si, 22 August: 5.0 µg/m³ Ansan-si, 23 August: 6.5 µg/m³ Suwon Suwon, 17 August: 6.2 µg/m³ Suwon, 18 August: 10.8 µg/m³ Suwon, 19 August: 19.9 µg/m³ Suwon, 20 August: 27.6 µg/m³, 2.3× its usual 11.8 Suwon, 21 August: 15.6 µg/m³ Suwon, 22 August: 5.7 µg/m³ Suwon, 23 August: 6.8 µg/m³ Uijeongbu-si Uijeongbu-si, 17 August: 5.2 µg/m³ Uijeongbu-si, 18 August: 11.8 µg/m³ Uijeongbu-si, 19 August: 18.1 µg/m³ Uijeongbu-si, 20 August: 25.4 µg/m³, 2.5× its usual 10.0 Uijeongbu-si, 21 August: 18.9 µg/m³ Uijeongbu-si, 22 August: 5.0 µg/m³ Uijeongbu-si, 23 August: 5.8 µg/m³ Asan Asan, 17 August: 7.0 µg/m³ Asan, 18 August: 17.4 µg/m³ Asan, 19 August: 18.8 µg/m³ Asan, 20 August: 25.1 µg/m³, 2.3× its usual 10.9 Asan, 21 August: 19.3 µg/m³ Asan, 22 August: 9.8 µg/m³ Asan, 23 August: 8.7 µg/m³ 17 Aug 18 19 20 21 22 23 Every counted city, in the order the episode reached them, 3 days before to 3 after. Each square is a day, coloured by that day's PM2.5; outlined: at twice the city's usual or more. Good 0–50
Moderate 51–100
Sensitive groups 101–150
Unhealthy 151–200
Very unhealthy 201–300
Hazardous 301+
Every city it reached
City Days Highest Usual Above usual
Osan Gyeonggi-do, South Korea 1 20 August 11.4 3.4× Bucheon-si Gyeonggi-do, South Korea 1 20 August 10.8 2.8× Gwangmyeong Gyeonggi-do, South Korea 1 20 August 12.7 2.7× Chungju North Chungcheong, South Korea 1 20 August 10.9 2.7× Gimpo-si Gyeonggi-do, South Korea 1 20 August 14.2 2.6× Pyeongtaek Gyeonggi-do, South Korea 1 20 August 13.4 2.6× Seoul Seoul, South Korea 1 20 August 11.8 2.6× Goyang-si Gyeonggi-do, South Korea 1 20 August 11.5 2.6× Anyang-si Gyeonggi-do, South Korea 1 20 August 10.8 2.6× Seonghwan Chungcheongnam-do, South Korea 1 20 August 13.7 2.5× Chinch'ŏn North Chungcheong, South Korea 1 20 August 12.2 2.5× Uijeongbu-si Gyeonggi-do, South Korea 1 20 August 10.0 2.5× Incheon Incheon, South Korea 1 20 August 13.5 2.4× Guri-si Gyeonggi-do, South Korea 1 20 August 12.0 2.4× Ganghwa-gun Incheon, South Korea 1 20 August 13.5 2.3× Ansan-si Gyeonggi-do, South Korea 1 20 August 12.3 2.3× Suwon Gyeonggi-do, South Korea 1 20 August 11.8 2.3× Asan Chungcheongnam-do, South Korea 1 20 August 10.9 2.3×
Daily means in µg/m³, over the days each city counted in this episode. Highest: its highest of those days. Usual: the city's median for the time of year of that day (its days within 21 days of the date, every year, leaving out the week around it). Above usual: its highest day against that, with a usual under 5 µg/m³ taken as 5.
Against other episodes in South Korea
Number 49 of 63 episodes in South Korea since our records began, by cities reached.
Japan and South Korea, March 2025 454 Japan and South Korea, March 2026 305 Japan and South Korea, January 2025 274 Japan and South Korea, February and March 2025 192 South Korea and Japan, January 2026 169 South Korea and Japan, 10 to 15 February 2026 147 South Korea, 14 to 16 February 2025 132 South Korea and Japan, November 2025 128 South Korea, February 2026 121 South Korea, 7 December 2025 113 South Korea, 13 to 14 January 2025 113 South Korea, 16 to 20 December 2025 107 South Korea, 20 August 2026 18 Bars: cities reached; colour: the level of the episode's highest daily reading. All 63 .
Use this page SmogRank, South Korea, 20 August 2026: 18 cities with PM2.5 at twice their usual or more, 20 August 2026, smogrank.com/episodes/2026-08-20-south-korea (accessed 4 October 2026).
Copy citation Download top 10 (PNG)
You're welcome to reuse a single chart, image or figure with this citation and a link. Terms .
An episode is a run of days when many cities close to each other (four or more within 350 km on a day, 8 or more in all) each had a daily PM2.5 mean of at least 25 µg/m³ and at least 2 times their usual for that time of year. Found in our own measurements, not picked by hand. How we find episodes . Values are each city's daily mean of its own monitors; causes are the usual kinds for a pattern like this, not a confirmed source.