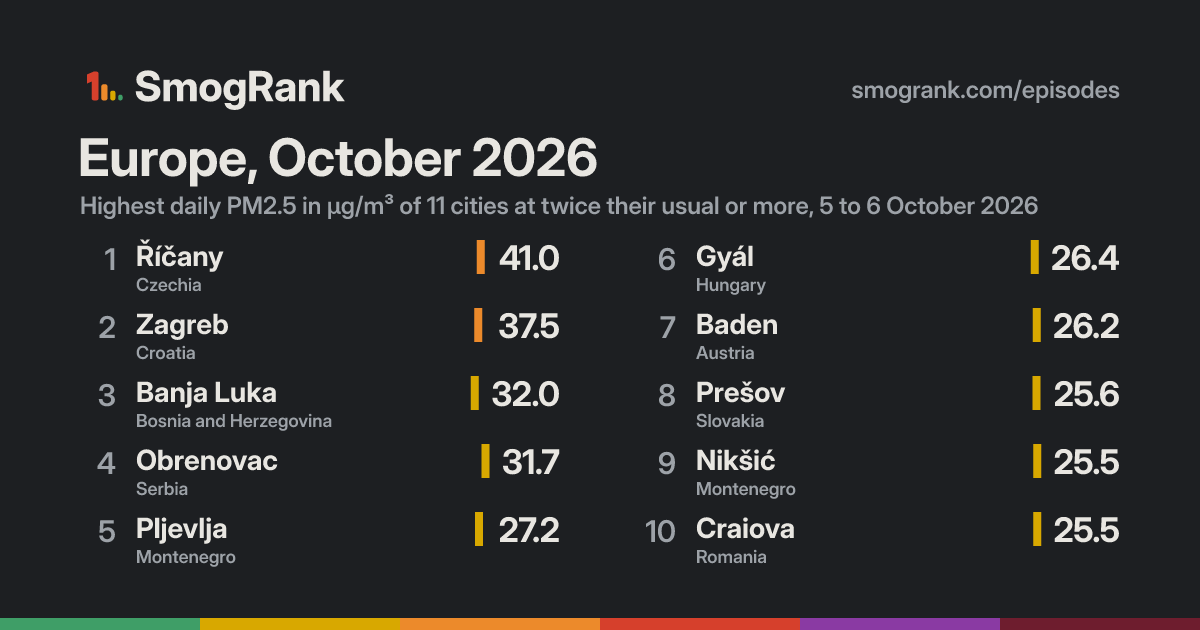
For 2 days so far, since 5 October, 11 cities in Serbia, Montenegro, Austria and 6 more countries had PM2.5 at least twice their usual for the time of year. The worst reading was Říčany, Central Bohemia, Czechia: 41.0 µg/m³ on 5 October, about 7.9× its usual 5.2.
Likely smoke from firesFires were detected within 300 km of the city on 67% of the counted city-days. Satellites see crop, field and forest fires alike, so this doesn't say which burned.
Cities reached11in 9 countries
Days25 to 6 October 2026
Worst day6 October8 cities counted
Furthest above usual7.9×Říčany
Day by day
On the map: 538 fire detections.
Every measured city in the area, coloured by its PM2.5 that day; a dark ring marks a city at twice its usual or more. Bars: cities counted each day, coloured by their median level. Choose a day or press play; without JavaScript, the days link to that day's world ranking.
Fires, seenHeat NASA satellites detected that day; bigger and glowing means more detections in the area. Farm burning and other fires count too, not only wildfires.
Volcanic ash, warnedA volcano with an ash warning for aircraft that day; shaded where forecasters saw the ash cloud.
Under the cities, for each UTC day: fires NASA satellites detected, smoke NOAA analysts traced and volcanic ash warnings for aircraft. They show what was in the air, not that it caused the readings. Mapped for 5 of the 8 days shown.
Every counted city, in the order the episode reached them, 3 days before to 3 after. Each square is a day, coloured by that day's PM2.5; outlined: at twice the city's usual or more.
Daily means in µg/m³, over the days each city counted in this episode. Highest: its highest of those days. Usual: the city's median for the time of year of that day (its days within 21 days of the date, every year, leaving out the week around it). Above usual: its highest day against that, with a usual under 5 µg/m³ taken as 5.
Against other episodes in Serbia and Montenegro
Number 2 of 5 episodes in Serbia and Montenegro since our records began, by cities reached.
Bars: cities reached; colour: the level of the episode's highest daily reading.
Use this page
SmogRank, Europe, October 2026: 11 cities with PM2.5 at twice their usual or more, 5 to 6 October 2026, smogrank.com/episodes/2026-10-europe (accessed 7 October 2026).
You're welcome to reuse a single chart, image or figure with this citation and a link. Terms.
An episode is a run of days when many cities close to each other (four or more within 350 km on a day, 8 or more in all) each had a daily PM2.5 mean of at least 25 µg/m³ and at least 2 times their usual for that time of year. Found in our own measurements, not picked by hand. How we find episodes. Values are each city's daily mean of its own monitors; causes are the usual kinds for a pattern like this, not a confirmed source. Fire detections from NASA FIRMS; smoke maps from NOAA HMS. Dust: contains modified Copernicus Atmosphere Monitoring Service information 2026. Neither the European Commission nor ECMWF is responsible for any use that may be made of the Copernicus information or data it contains.