SmogRank / World / Hong Kong / December 2025
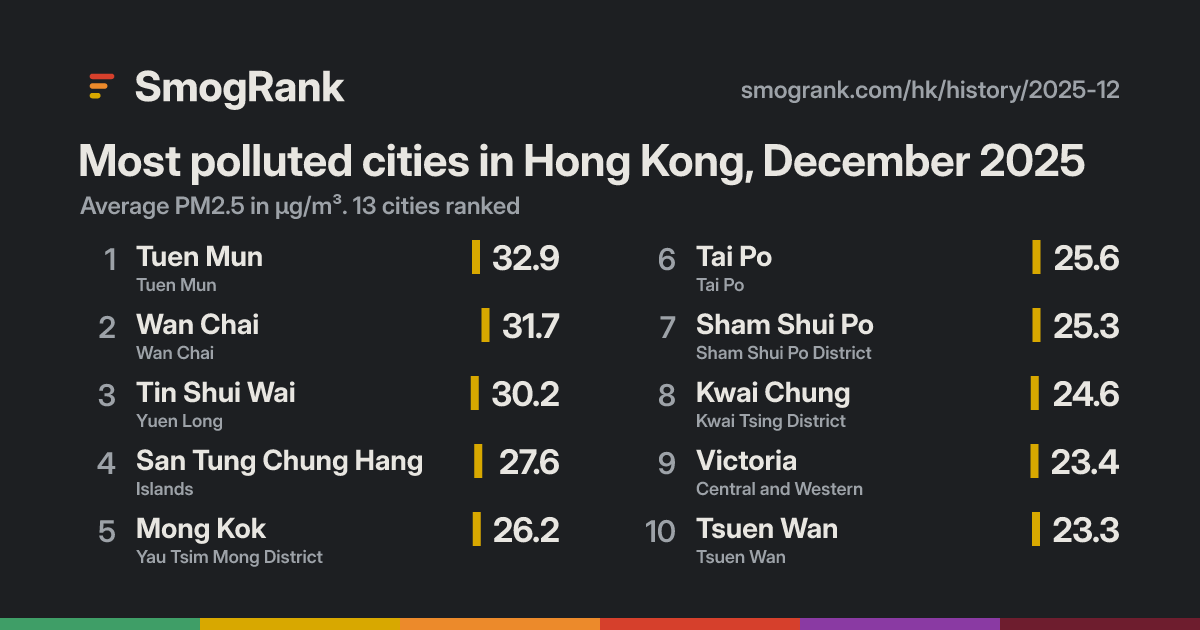
Most polluted cities in Hong Kong, December 2025
13 cities in Hong Kong ranked by their average PM2.5 over the 31 days. Worst: Tuen Mun at 32.9 µg/m³, #357 of 2,638 cities in the world. Cleanest: Fanling at 22.8. A city needs measurements on 70% of the days to be ranked.
← Tuen Mun 32.9 µg/m³
30 µg/m³0
- 1Tuen MunTuen Mun 95
- 2Wan ChaiWan Chai 93
- 3Tin Shui WaiYuen Long 90
- 4San Tung Chung HangIslands 85
- 5Mong KokYau Tsim Mong District 83
- 6Tai PoTai Po 82
- 7Sham Shui PoSham Shui Po District 81
- 8Kwai ChungKwai Tsing District 80
- 9VictoriaCentral and Western 78
- 10Tsuen WanTsuen Wan 77
- 11Sau Mau PingKwun Tong District 77
- 12Sha TinSha Tin 77
- 12FanlingNorth District 77
Good0–50
Moderate51–100
Sensitive groups101–150
Unhealthy151–200
Very unhealthy201–300
Hazardous301+
The US EPA's Air Quality Index for PM2.5 (2024 breakpoints). Show values as: µg/m³ · US AQI · India AQI · China AQI · European AQI · UK DAQI · Canada AQHI+. About the scales
All cities in the world, December 2025 · Hong Kong now
Use this board
SmogRank, most polluted cities in Hong Kong, PM2.5, December 2025, smogrank.com/hk/history/2025-12 (accessed 2 Oct 2026).
You're welcome to reuse a single chart, image or figure with this citation and a link. Terms.