SmogRank / World / Asia / India / Delhi
Most polluted cities in Delhi, India
6 measured cities, this year; 6 above the WHO annual guideline. Worst: Bawāna at 81.0 µg/m³, #32 in the world.
The 457 monitors run by CPCB in India haven't reported for more than two days. Cities that rely on them are missing from the 24-hour board and may drop from the longer ones; they return when the data does.
The US EPA's Air Quality Index for PM2.5 (2024 breakpoints). Show values as: µg/m³ · US AQI · India AQI · China AQI · European AQI · UK DAQI · Canada AQHI+. About the scales
Estimated: cities without a monitor
Delhi cities we can't measure, with model estimates for the last 7 days. Listed by population, not ranked: estimates aren't precise enough to rank. Model estimates from the Copernicus Atmosphere Monitoring Service (CAMS), adjusted to measured cities nearby where there are any. Adjusted, a single day lands within ×1.5 of what a monitor would read about two times in three; unadjusted, it can be off by half or double. Treat them as a guide, not a measurement.
| City | 7-day estimate |
|---|---|
| New Delhi | ≈ 30 µg/m³ |
| Kirāri Sulemānnagar | ≈ 30 µg/m³ |
| Nāngloi Jāt | ≈ 30 µg/m³ |
| Bhālswa Jahangirpur | ≈ 30 µg/m³ |
| Sultan Pur Majra | ≈ 30 µg/m³ |
| Hashtsāl | ≈ 29 µg/m³ |
| Deoli | ≈ 38 µg/m³ |
| Dalūpura | ≈ 29 µg/m³ |
| Burāri | ≈ 30 µg/m³ |
| Mandoli | ≈ 28 µg/m³ |
| Delhi Cantonment | ≈ 36 µg/m³ |
| Sādatpur Gujran | ≈ 29 µg/m³ |
| Pūth Kalān | ≈ 30 µg/m³ |
| Gharroli | ≈ 29 µg/m³ |
| Molārband | ≈ 38 µg/m³ |
| Chilla Soroda Bāngar | ≈ 36 µg/m³ |
| Khajoori Khas | ≈ 29 µg/m³ |
| Kāpas Herd | ≈ 37 µg/m³ |
| Mīthepur | ≈ 38 µg/m³ |
| Pul Pehlad | ≈ 38 µg/m³ |
| Ziauddin Pur | ≈ 29 µg/m³ |
| Taj Pul | ≈ 38 µg/m³ |
| Roshanpura | ≈ 31 µg/m³ |
| Mukandpur | ≈ 30 µg/m³ |
| Sāhibābād Daulotpur | ≈ 30 µg/m³ |
| Mūndka | ≈ 30 µg/m³ |
| Begampur | ≈ 30 µg/m³ |
| Bāprola | ≈ 29 µg/m³ |
| Nithari | ≈ 30 µg/m³ |
| Tighri | ≈ 38 µg/m³ |
| Chhatarpur | ≈ 38 µg/m³ |
| Libāspur | ≈ 30 µg/m³ |
| Nilithi | ≈ 29 µg/m³ |
| Kamal Pur Majra Burari | ≈ 30 µg/m³ |
| Kondli | ≈ 29 µg/m³ |
| Gharonda Neemka Bangar | ≈ 29 µg/m³ |
| Karāla | ≈ 30 µg/m³ |
| Shafi Pur Ranhola | ≈ 29 µg/m³ |
| Siraspur | ≈ 30 µg/m³ |
| Ali | ≈ 38 µg/m³ |
Use this board
SmogRank, most polluted cities in Delhi, India, PM2.5, this year to 2 Oct 2026, 07:00 UTC, smogrank.com/in/region/delhi?w=year.
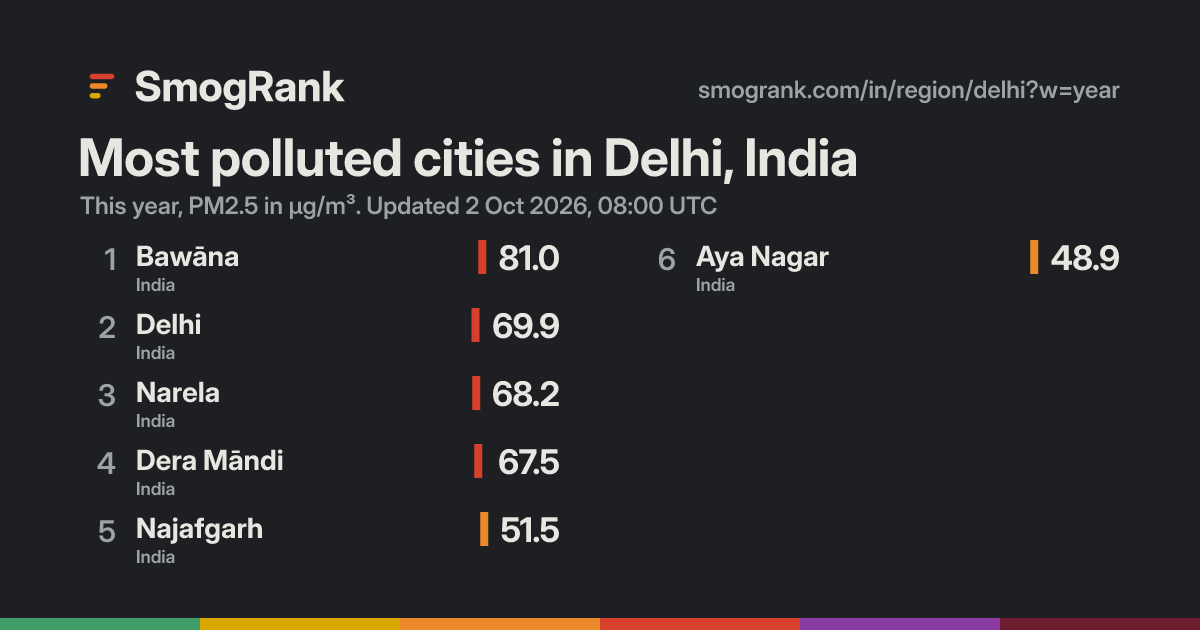
You're welcome to reuse a single chart, image or figure with this citation and a link. Terms.
Updated 2026-10-02 07:07 UTC. Values are PM2.5 (fine particles), the median of each city's monitors, as the US AQI PM2.5 sub-index.