SmogRank / World / The Netherlands / February 2024
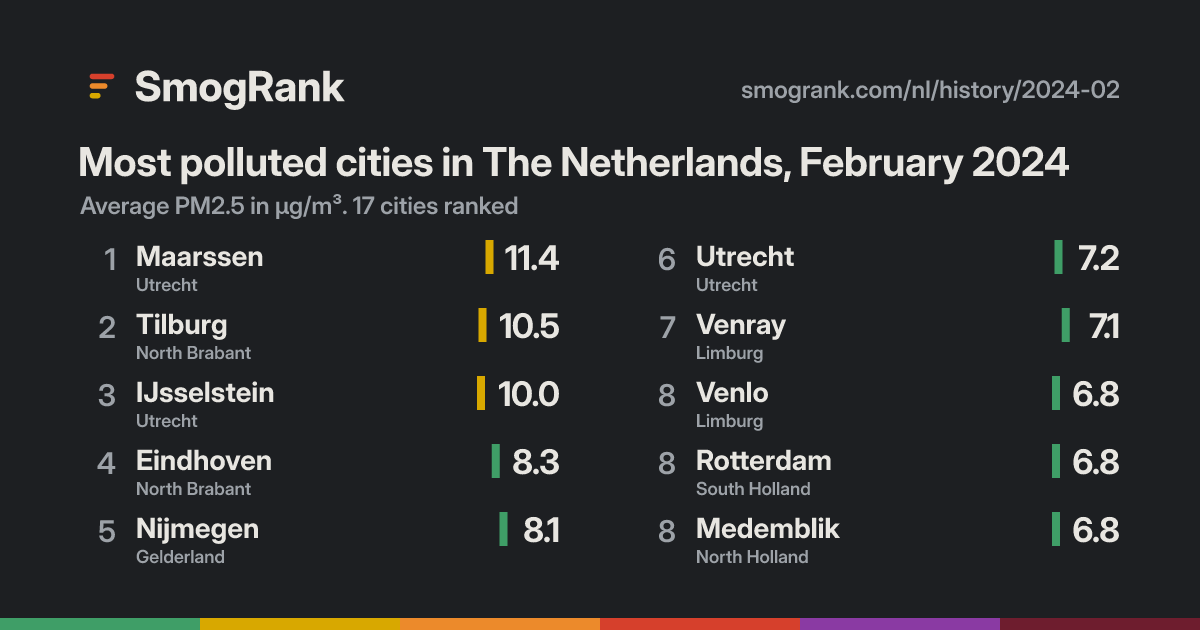
Most polluted cities in The Netherlands, February 2024
17 cities in The Netherlands ranked by their average PM2.5 over the 29 days. Worst: Maarssen at 11.4 µg/m³, #364 of 2,036 cities in the world. Cleanest: Heerlen at 4.6. A city needs measurements on 70% of the days to be ranked.
OpenAQ's archive, where our readings come from, has almost none for one of these days. Cities in the United States and Europe have it from the EPA's and the European Environment Agency's own records of the same monitors; elsewhere a city's average is over its other days. Why.
- 1MaarssenUtrecht 18
- 2TilburgNorth Brabant 18
- 3IJsselsteinUtrecht 17
- 4EindhovenNorth Brabant 13
- 5NijmegenGelderland 13
- 6UtrechtUtrecht 12
- 7VenrayLimburg 12
- 8VenloLimburg 12
- 8RotterdamSouth Holland 12
- 8MedemblikNorth Holland 12
- 11GroningenGroningen 12
- 12BredaNorth Brabant 10
- 13HillegomSouth Holland 10
- 13BarneveldGelderland 10
- 15EnschedeOverijssel 10
- 16The HagueSouth Holland 8
- 16HeerlenLimburg 8
India's National Air Quality Index (CPCB), PM2.5 sub-index. Show values as: µg/m³ · US AQI · India AQI · China AQI · European AQI · UK DAQI · Canada AQHI+. About the scales
All cities in the world, February 2024 · The Netherlands now
Use this board
SmogRank, most polluted cities in The Netherlands, PM2.5, February 2024, smogrank.com/nl/history/2024-02 (accessed 2 Oct 2026).
You're welcome to reuse a single chart, image or figure with this citation and a link. Terms.