SmogRank / Countries / Senegal
Most polluted cities in Senegal
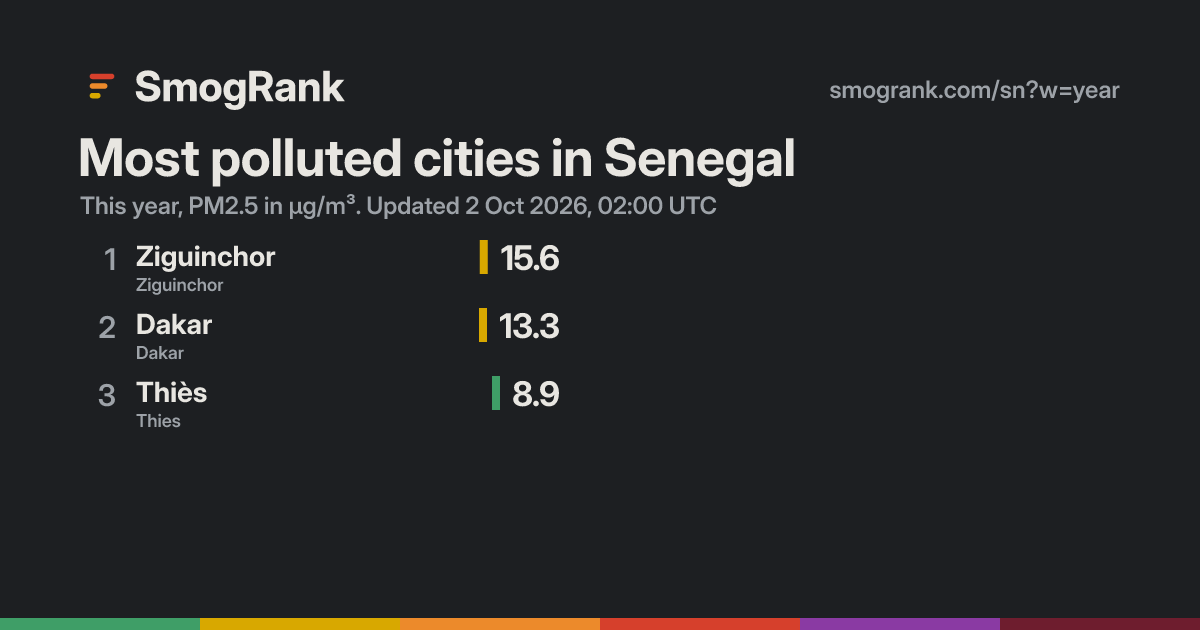
3 measured cities, this year; 3 above the WHO annual guideline. Worst: Ziguinchor at 14.6 µg/m³, #345 in the world.
1 good 2 moderate
- 1Ziguinchorlow-cost sensorsZiguinchor 14.62.9×
- 2Dakarlow-cost sensorsDakar 13.12.6×
- 3Thièslow-cost sensorsThies 8.01.6×
Estimated: cities without a monitor
Senegal cities we can't measure, with model estimates for the last 7 days. Listed by population, not ranked: estimates aren't precise enough to rank. Model estimates from the Copernicus Atmosphere Monitoring Service (CAMS), adjusted to measured cities nearby where there are any. Adjusted, a single day lands within ×1.5 of what a monitor would read about two times in three; unadjusted, it can be off by half or double. Treat them as a guide, not a measurement.
| City | 7-day estimate |
|---|---|
| Pikine | ≈ 8 µg/m³ |
| Touba | ≈ 6 µg/m³ |
| Guédiawaye | ≈ 7 µg/m³ |
| Kaolack | ≈ 6 µg/m³ |
| Rufisque | ≈ 8 µg/m³ |
| Mbour | ≈ 7 µg/m³ |
| Thiès Nones | ≈ 7 µg/m³ |
| Diourbel | ≈ 6 µg/m³ |
| Tambacounda | ≈ 7 µg/m³ |
| Louga | ≈ 8 µg/m³ |
| Kolda | ≈ 6 µg/m³ |
| Tivaouane | ≈ 7 µg/m³ |
| Mbaké | ≈ 6 µg/m³ |
| Tiébo | ≈ 6 µg/m³ |
| Yoff | ≈ 7 µg/m³ |
| Keur Médoune | ≈ 6 µg/m³ |
| Richard-Toll | ≈ 14 µg/m³ |
| Dougnane | ≈ 7 µg/m³ |
| Bargny | ≈ 8 µg/m³ |
| Kaffrine | ≈ 6 µg/m³ |
| Nguékhokh | ≈ 8 µg/m³ |
| Diamniadio | ≈ 8 µg/m³ |
| Joal | ≈ 7 µg/m³ |
| Dara | ≈ 7 µg/m³ |
| Vélingara | ≈ 7 µg/m³ |
| Sébikhotane | ≈ 8 µg/m³ |
| Sali | ≈ 8 µg/m³ |
| Niakoul Rab | ≈ 8 µg/m³ |
| Mboro | ≈ 7 µg/m³ |
| Fatick | ≈ 6 µg/m³ |
| Bambey | ≈ 6 µg/m³ |
| Médina Gounas | ≈ 6 µg/m³ |
| N’diareme limamoulaye | ≈ 8 µg/m³ |
| Ndibène Dahra | ≈ 7 µg/m³ |
| Sédhiou | ≈ 6 µg/m³ |
| Koungheul | ≈ 6 µg/m³ |
| Kédougou | ≈ 7 µg/m³ |
| Bignona | ≈ 5 µg/m³ |
| Matam | ≈ 14 µg/m³ |
| Mékhé | ≈ 7 µg/m³ |
Use this board
SmogRank, most polluted cities in Senegal, PM2.5, this year to 2 Oct 2026, 00:00 UTC, smogrank.com/sn?w=year.
You're welcome to reuse a single chart, image or figure with this citation and a link. Terms.
Regions
Measured cities in each region (30 days).
Updated 2026-10-02 00:07 UTC. Values are PM2.5 in µg/m³ (fine particles), the median of each city's monitors.