SmogRank / World / Europe / Austria
Most polluted cities in Austria
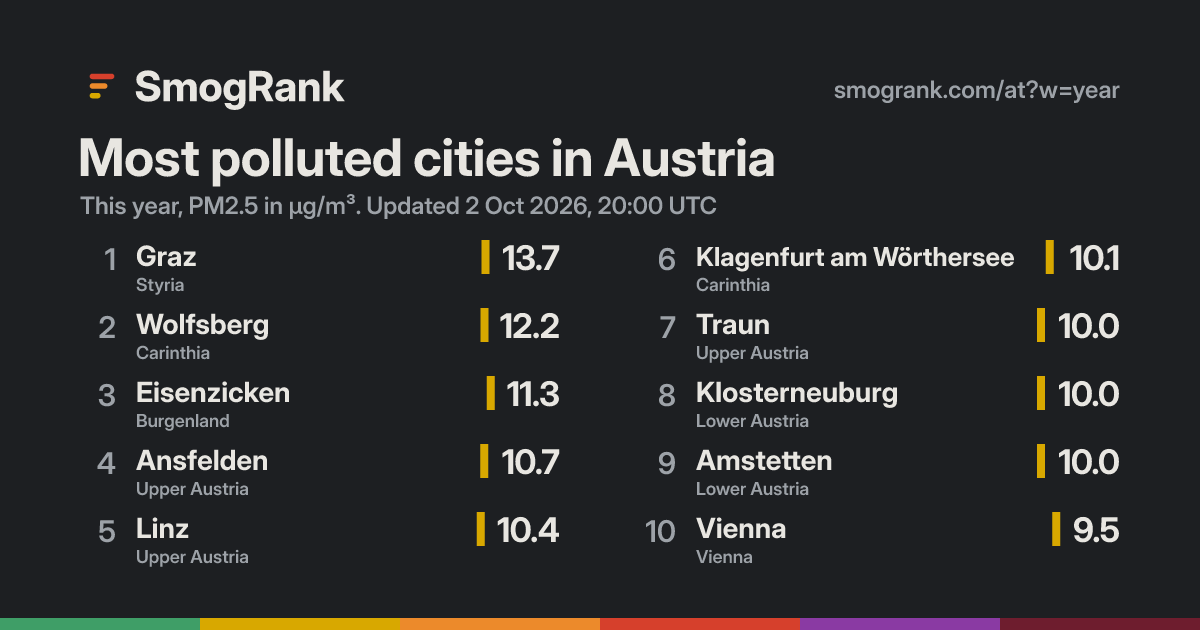
18 measured cities, this year; 18 above the WHO annual guideline. Worst: Graz at 13.7 µg/m³, #615 in the world.
- 1GrazStyria 602.7×▼246
- 2WolfsbergCarinthia 572.4×▼266
- 3EisenzickenBurgenland 552.3×▼273
- 4AnsfeldenUpper Austria 542.1×▼278
- 5LinzUpper Austria 532.1×▼275
- 6Klagenfurt am WörtherseeCarinthia 532.0×▼247
- 7TraunUpper Austria 532.0×▼273
- 8KlosterneuburgLower Austria 532.0×▼272
- 9AmstettenLower Austria 532.0×▼270
- 10ViennaVienna 521.9×▼274
- 11WelsUpper Austria 521.9×▼273
- 12PerchtoldsdorfLower Austria 521.9×▼272
- 13Sankt PöltenLower Austria 511.9×▼270
- 14MödlingLower Austria 511.9×▼269
- 15InnsbruckTyrol 511.8×▼237
- 16SalzburgSalzburg 491.8×▼263
- 17SteyrUpper Austria 461.7×▼260
- 18Saalfelden am Steinernen MeerSalzburg 371.3×▼277
The US EPA's Air Quality Index for PM2.5 (2024 breakpoints). Show values as: µg/m³ · US AQI · India AQI · China AQI · European AQI · UK DAQI · Canada AQHI+. About the scales
Estimated: cities without a monitor
Austria cities we can't measure, with model estimates for the last 7 days. Listed by population, not ranked: estimates aren't precise enough to rank. Model estimates from the Copernicus Atmosphere Monitoring Service (CAMS), adjusted to measured cities nearby where there are any. Adjusted, a single day lands within ×1.5 of what a monitor would read about two times in three; unadjusted, it can be off by half or double. Treat them as a guide, not a measurement.
| City | 7-day estimate |
|---|---|
| Villach | ≈ 6 µg/m³ |
| Feldkirch | ≈ 9 µg/m³ |
| Bregenz | ≈ 13 µg/m³ |
| Hohenems | ≈ 10 µg/m³ |
| Stockerau | ≈ 8 µg/m³ |
| Telfs | ≈ 7 µg/m³ |
| Bludenz | ≈ 4 µg/m³ |
Bad-air episodes in Austria
- Eastern Europe, December 202328 to 31 December 2023, 4 days29 cities134Banja Luka
- Southern Europe, December 202316 to 21 December 2023, 6 days97 cities230Sarajevo
- Czechia, Slovakia and Austria, December 202313 to 14 December 2023, 2 days16 cities45Graz
- South-eastern Europe, December 202311 to 13 December 2023, 3 days16 cities161Sarajevo
- Eastern Europe, December 20234 to 9 December 2023, 6 days107 cities112Banja Luka
- Czechia and Slovakia, November and December 202330 November to 2 December 2023, 3 days41 cities80Bohumín
Times when many cities here had PM2.5 at twice their usual or more on the same days.
All 12 episodes in AustriaUse this board
SmogRank, most polluted cities in Austria, PM2.5, this year to 2 Oct 2026, 19:00 UTC, smogrank.com/at?w=year.
You're welcome to reuse a single chart, image or figure with this citation and a link. Terms.
Regions
Measured cities in each region, this year.
Updated 2026-10-02 19:07 UTC. Values are PM2.5 (fine particles), the median of each city's monitors, as the US AQI PM2.5 sub-index.