SmogRank / Episodes / Spain
Spain, Portugal and France, February 2024
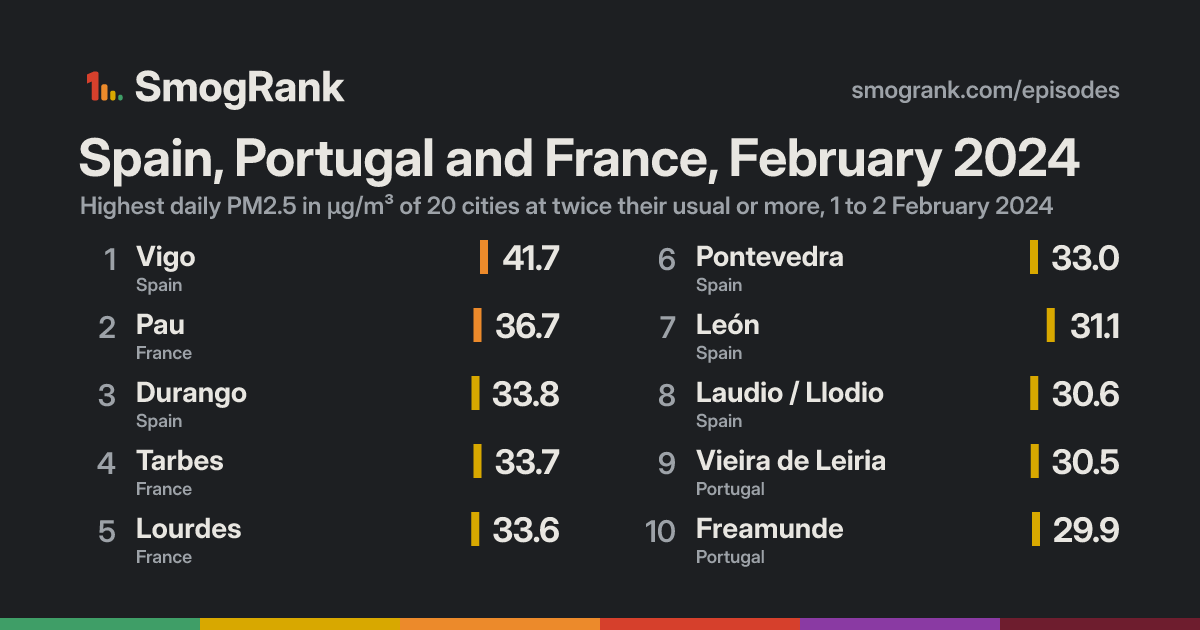
For 2 days, from 1 to 2 February 2024, 20 cities in Spain, Portugal and France had PM2.5 at least twice their usual for the time of year. The worst reading was Vigo, Galicia, Spain: 41.7 µg/m³ on 2 February, about 3.6× its usual 11.6. Ended 2 February.
No cause named We have no fire or smoke records for these days, so we only say what the measurements show.
Cities reached 20 in 3 countries
Days 2 1 to 2 February 2024
Worst day 1 February 15 cities counted
Furthest above usual 5.9× Tolosa
Day by day
Play 1 February 15 cities at twice their usual or more
San Ildefonso Algete Azuqueca de Henares Collado-Villalba Torrejón de Ardoz Alcalá de Henares Coslada Madrid Móstoles Fuenlabrada Valdemoro Villarejo de Salvanés Villa del Prado Burgos Valladolid Toledo Palencia Medina del Campo Logroño Gasteiz / Vitoria Calahorra Salamanca Ciudad Real Alfaro Zalla Tudela Santurtzi Beasain Puertollano Azpeitia Bermeo Zarautz Oria Albacete Hernani Donostia / San Sebastián Zaragoza Utiel Sama Anglet Oviedo Buñol Avilés Onda Valencia Sagunto Grao de Murviedro Villena Burriana Castelló de la Plana Ontinyent Benicàssim Elda Alicante Mont-de-Marsan Vila Real Sarria Lleida Lugo Ourense Burela de Cabo Salou Viveiro Lalín Guitiriz Tarragona Narón Ferrol Teo Santiago de Compostela Culleredo Vilanova i la Geltrú les Escaldes A Coruña Padrón Arteixo Toulouse Mollet del Vallès Cee Manlleu Lisbon Corroios Cacém Castres Palma Bunyola Girona Marratxí Perpignan Barcelona Cuenca Gijón Paredes Amora Tarbes León Amorebieta Freamunde Vieira de Leiria Vigo Bilbao Lourdes Pau Laudio / Llodio Durango Getxo Lourinhã Pontevedra Tolosa 29 Jan 30 31 1 Feb 2 3 4 5 Every measured city in the area, coloured by its PM2.5 that day; a dark ring marks a city at twice its usual or more. Bars: cities counted each day, coloured by their median level. Choose a day or press play; without JavaScript, the days link to that day's world ranking.
How it spread
Pau Pau, 29 January: 11.9 µg/m³ Pau, 30 January: 18.1 µg/m³ Pau, 31 January: 27.8 µg/m³ Pau, 1 February: 36.7 µg/m³, 4.0× its usual 9.1 Pau, 2 February: 25.5 µg/m³ Pau, 3 February: 16.3 µg/m³ Pau, 4 February: 23.2 µg/m³ Pau, 5 February: 18.4 µg/m³ Durango Durango, 29 January: 13.2 µg/m³ Durango, 30 January: 17.5 µg/m³ Durango, 31 January: 23.1 µg/m³ Durango, 1 February: 33.8 µg/m³, 4.5× its usual 7.5 Durango, 2 February: 17.5 µg/m³ Durango, 3 February: 13.1 µg/m³ Durango, 4 February: 21.8 µg/m³ Durango, 5 February: no reading Tarbes Tarbes, 29 January: 28.1 µg/m³ Tarbes, 30 January: 33.4 µg/m³ Tarbes, 31 January: 30.7 µg/m³ Tarbes, 1 February: 33.7 µg/m³, 2.8× its usual 12.2 Tarbes, 2 February: 19.4 µg/m³ Tarbes, 3 February: 18.7 µg/m³ Tarbes, 4 February: 27.0 µg/m³ Tarbes, 5 February: 19.3 µg/m³ Lourdes Lourdes, 29 January: 16.1 µg/m³ Lourdes, 30 January: 24.4 µg/m³ Lourdes, 31 January: 30.7 µg/m³ Lourdes, 1 February: 33.6 µg/m³, 4.0× its usual 8.4 Lourdes, 2 February: 25.6 µg/m³ Lourdes, 3 February: 27.7 µg/m³ Lourdes, 4 February: 25.5 µg/m³ Lourdes, 5 February: 21.8 µg/m³ Vigo Vigo, 29 January: 21.2 µg/m³ Vigo, 30 January: 30.5 µg/m³ Vigo, 31 January: 32.3 µg/m³ Vigo, 1 February: 32.7 µg/m³, 2.8× its usual 11.5 Vigo, 2 February: 41.7 µg/m³, 3.6× its usual 11.6 Vigo, 3 February: 26.6 µg/m³ Vigo, 4 February: 30.4 µg/m³ Vigo, 5 February: 36.7 µg/m³ Laudio / Llodio Laudio / Llodio, 29 January: 13.7 µg/m³ Laudio / Llodio, 30 January: 15.1 µg/m³ Laudio / Llodio, 31 January: 20.5 µg/m³ Laudio / Llodio, 1 February: 30.6 µg/m³, 4.2× its usual 7.3 Laudio / Llodio, 2 February: 13.3 µg/m³ Laudio / Llodio, 3 February: 11.6 µg/m³ Laudio / Llodio, 4 February: 20.4 µg/m³ Laudio / Llodio, 5 February: no reading León León, 29 January: 21.6 µg/m³ León, 30 January: 16.5 µg/m³ León, 31 January: 23.5 µg/m³ León, 1 February: 30.3 µg/m³, 2.8× its usual 10.8 León, 2 February: 31.1 µg/m³, 2.9× its usual 10.8 León, 3 February: 14.9 µg/m³ León, 4 February: 15.5 µg/m³ León, 5 February: 19.3 µg/m³ Tolosa Tolosa, 29 January: no reading Tolosa, 30 January: no reading Tolosa, 31 January: no reading Tolosa, 1 February: 29.7 µg/m³, 5.9× its usual 4.2 Tolosa, 2 February: no reading Tolosa, 3 February: no reading Tolosa, 4 February: no reading Tolosa, 5 February: no reading Amorebieta Amorebieta, 29 January: 13.1 µg/m³ Amorebieta, 30 January: 14.8 µg/m³ Amorebieta, 31 January: 23.3 µg/m³ Amorebieta, 1 February: 28.6 µg/m³, 3.0× its usual 9.6 Amorebieta, 2 February: 12.5 µg/m³ Amorebieta, 3 February: 12.2 µg/m³ Amorebieta, 4 February: 17.8 µg/m³ Amorebieta, 5 February: no reading Gijón Gijón, 29 January: 26.9 µg/m³ Gijón, 30 January: 23.3 µg/m³ Gijón, 31 January: 27.8 µg/m³ Gijón, 1 February: 26.8 µg/m³, 2.4× its usual 11.4 Gijón, 2 February: 11.3 µg/m³ Gijón, 3 February: 11.2 µg/m³ Gijón, 4 February: 20.9 µg/m³ Gijón, 5 February: 22.5 µg/m³ Barcelona Barcelona, 29 January: 12.2 µg/m³ Barcelona, 30 January: 11.5 µg/m³ Barcelona, 31 January: 16.0 µg/m³ Barcelona, 1 February: 26.7 µg/m³, 2.3× its usual 11.5 Barcelona, 2 February: 26.7 µg/m³ Barcelona, 3 February: 20.2 µg/m³ Barcelona, 4 February: 19.8 µg/m³ Barcelona, 5 February: 22.5 µg/m³ Pontevedra Pontevedra, 29 January: 19.0 µg/m³ Pontevedra, 30 January: 20.7 µg/m³ Pontevedra, 31 January: 23.7 µg/m³ Pontevedra, 1 February: 26.4 µg/m³, 4.5× its usual 5.9 Pontevedra, 2 February: 33.0 µg/m³, 5.7× its usual 5.8 Pontevedra, 3 February: 18.3 µg/m³ Pontevedra, 4 February: 20.5 µg/m³ Pontevedra, 5 February: 25.2 µg/m³ Bilbao Bilbao, 29 January: 10.7 µg/m³ Bilbao, 30 January: 14.0 µg/m³ Bilbao, 31 January: 18.6 µg/m³ Bilbao, 1 February: 26.3 µg/m³, 4.0× its usual 6.6 Bilbao, 2 February: 12.2 µg/m³ Bilbao, 3 February: 12.4 µg/m³ Bilbao, 4 February: 23.0 µg/m³ Bilbao, 5 February: no reading Cuenca Cuenca, 29 January: 18.4 µg/m³ Cuenca, 30 January: 12.2 µg/m³ Cuenca, 31 January: 15.9 µg/m³ Cuenca, 1 February: 26.2 µg/m³, 2.4× its usual 10.8 Cuenca, 2 February: 27.5 µg/m³ Cuenca, 3 February: 19.0 µg/m³ Cuenca, 4 February: 17.6 µg/m³ Cuenca, 5 February: 20.8 µg/m³ Getxo Getxo, 29 January: 11.8 µg/m³ Getxo, 30 January: 11.6 µg/m³ Getxo, 31 January: 16.2 µg/m³ Getxo, 1 February: 25.7 µg/m³, 4.6× its usual 5.6 Getxo, 2 February: 8.2 µg/m³ Getxo, 3 February: 7.7 µg/m³ Getxo, 4 February: 18.8 µg/m³ Getxo, 5 February: no reading Vieira de Leiria Vieira de Leiria, 29 January: 12.8 µg/m³ Vieira de Leiria, 30 January: 17.2 µg/m³ Vieira de Leiria, 31 January: 12.8 µg/m³ Vieira de Leiria, 1 February: no reading Vieira de Leiria, 2 February: 30.5 µg/m³, 3.4× its usual 9.1 Vieira de Leiria, 3 February: 22.6 µg/m³ Vieira de Leiria, 4 February: 27.6 µg/m³ Vieira de Leiria, 5 February: 35.6 µg/m³ Freamunde Freamunde, 29 January: 34.2 µg/m³ Freamunde, 30 January: 43.7 µg/m³ Freamunde, 31 January: 29.3 µg/m³ Freamunde, 1 February: no reading Freamunde, 2 February: 29.9 µg/m³, 3.0× its usual 10.1 Freamunde, 3 February: 18.9 µg/m³ Freamunde, 4 February: 34.1 µg/m³ Freamunde, 5 February: 43.6 µg/m³ Paredes Paredes, 29 January: 34.2 µg/m³ Paredes, 30 January: 43.7 µg/m³ Paredes, 31 January: 29.3 µg/m³ Paredes, 1 February: no reading Paredes, 2 February: 29.9 µg/m³, 2.4× its usual 12.4 Paredes, 3 February: 18.9 µg/m³ Paredes, 4 February: 34.1 µg/m³ Paredes, 5 February: 43.6 µg/m³ Lourinhã Lourinhã, 29 January: 15.2 µg/m³ Lourinhã, 30 January: 14.3 µg/m³ Lourinhã, 31 January: 15.0 µg/m³ Lourinhã, 1 February: no reading Lourinhã, 2 February: 28.4 µg/m³, 4.7× its usual 6.0 Lourinhã, 3 February: 23.1 µg/m³ Lourinhã, 4 February: 15.7 µg/m³ Lourinhã, 5 February: 21.1 µg/m³ Amora Amora, 29 January: 17.7 µg/m³ Amora, 30 January: 15.0 µg/m³ Amora, 31 January: 15.5 µg/m³ Amora, 1 February: 19.8 µg/m³ Amora, 2 February: 26.5 µg/m³, 2.6× its usual 10.1 Amora, 3 February: 26.3 µg/m³ Amora, 4 February: 27.0 µg/m³ Amora, 5 February: 28.5 µg/m³ 29 Jan 30 31 1 Feb 2 3 4 5 Every counted city, in the order the episode reached them, 3 days before to 3 after. Each square is a day, coloured by that day's PM2.5; outlined: at twice the city's usual or more. Good 0–50
Moderate 51–100
Sensitive groups 101–150
Unhealthy 151–200
Very unhealthy 201–300
Hazardous 301+
Every city it reached
City Days Highest Usual Above usual
Tolosa Basque Country, Spain 1 1 February 4.2 5.9× Pontevedra Galicia, Spain 2 2 February 5.8 5.7× Lourinhã Lisbon, Portugal 1 2 February 6.0 4.7× Getxo Basque Country, Spain 1 1 February 5.6 4.6× Durango Basque Country, Spain 1 1 February 7.5 4.5× Laudio / Llodio Basque Country, Spain 1 1 February 7.3 4.2× Pau New Aquitaine, France 1 1 February 9.1 4.0× Lourdes Occitanie, France 1 1 February 8.4 4.0× Bilbao Basque Country, Spain 1 1 February 6.6 4.0× Vigo Galicia, Spain 2 2 February 11.6 3.6× Vieira de Leiria Leiria, Portugal 1 2 February 9.1 3.4× Freamunde Porto, Portugal 1 2 February 10.1 3.0× Amorebieta Basque Country, Spain 1 1 February 9.6 3.0× León Castille and León, Spain 2 2 February 10.8 2.9× Tarbes Occitanie, France 1 1 February 12.2 2.8× Amora Setúbal, Portugal 1 2 February 10.1 2.6× Paredes Porto, Portugal 1 2 February 12.4 2.4× Gijón Asturias, Spain 1 1 February 11.4 2.4× Cuenca Castille-La Mancha, Spain 1 1 February 10.8 2.4× Barcelona Catalonia, Spain 1 1 February 11.5 2.3×
Daily means in µg/m³, over the days each city counted in this episode. Highest: its highest of those days. Usual: the city's median for the time of year of that day (its days within 21 days of the date, every year, leaving out the week around it). Above usual: its highest day against that, with a usual under 5 µg/m³ taken as 5.
Against other episodes in Spain and Portugal
Number 7 of 41 episodes in Spain and Portugal since our records began, by cities reached.
Spain, France and Portugal, February 2023 72 Spain, Portugal and Andorra, August 2025 57 Southern Europe, February 2024 53 Spain, France and 2 more countries, December 2023 to January 2024 48 Northern Spain, October 2024 29 Spain, April 2024 25 Spain, Portugal and France, February 2024 20 Canary Islands, Spain, November 2025 18 Canary Islands, Spain, December 2024 18 Canary Islands, Spain, 8 to 9 February 2024 18 Canary Islands, Spain, 16 to 17 December 2023 18 Canary Islands, Spain, 11 to 13 December 2023 18 Bars: cities reached; colour: the level of the episode's highest daily reading. All 41 .
Use this page SmogRank, Spain, Portugal and France, February 2024: 20 cities with PM2.5 at twice their usual or more, 1 to 2 February 2024, smogrank.com/episodes/2024-02-spain-portugal-and-france (accessed 5 October 2026).
Copy citation Download top 10 (PNG)
You're welcome to reuse a single chart, image or figure with this citation and a link. Terms .
An episode is a run of days when many cities close to each other (four or more within 350 km on a day, 8 or more in all) each had a daily PM2.5 mean of at least 25 µg/m³ and at least 2 times their usual for that time of year. Found in our own measurements, not picked by hand. How we find episodes . Values are each city's daily mean of its own monitors; causes are the usual kinds for a pattern like this, not a confirmed source.