Spain, France and Portugal, February 2023
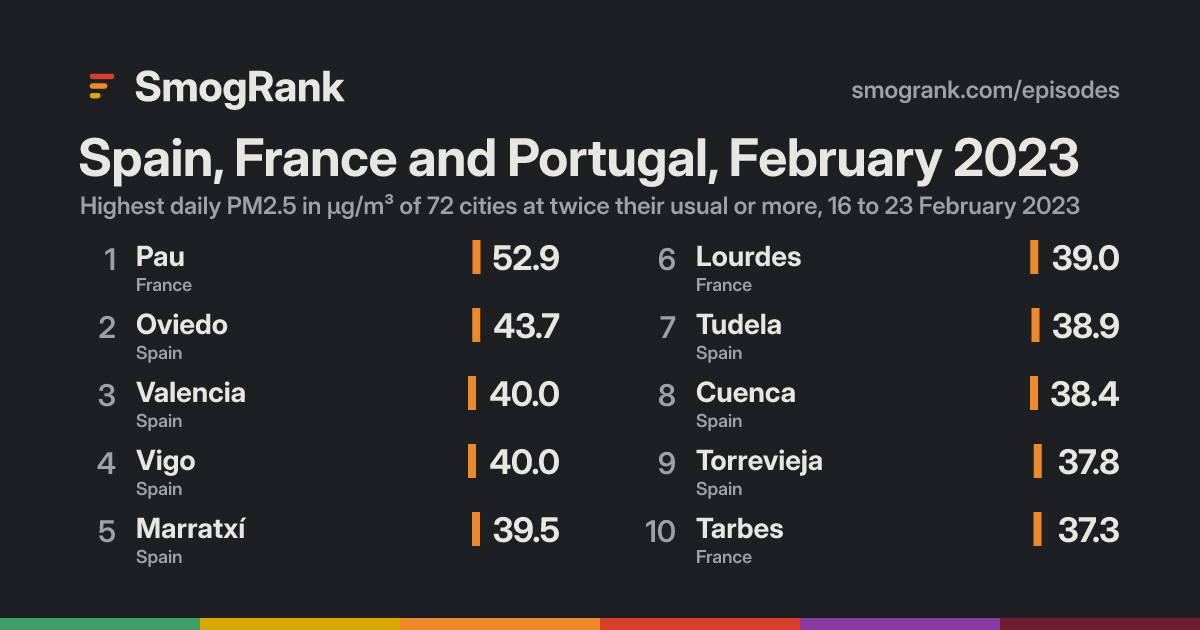
For 8 days, from 16 to 23 February 2023, 72 cities in Spain, France and Portugal had PM2.5 at least twice their usual for the time of year. The worst reading was Pau, New Aquitaine, France: 52.9 µg/m³ on 21 February, about 7.2× its usual 7.3.
Day by day
How it spread
Every city it reached
| City | Days | Highest | Above usual |
|---|---|---|---|
| MarratxíBalearic Islands, Spain | 2 | 39.522 February | 7.9× |
| PauNew Aquitaine, France | 3 | 52.921 February | 7.2× |
| Ribarroja del TuriaValencia, Spain | 2 | 30.823 February | 6.2× |
| LourdesOccitanie, France | 5 | 39.021 February | 6.0× |
| Donostia / San SebastiánBasque Country, Spain | 2 | 36.018 February | 6.0× |
| TudelaNavarre, Spain | 3 | 38.917 February | 5.9× |
| SaguntoValencia, Spain | 1 | 26.923 February | 5.3× |
| NarónGalicia, Spain | 2 | 29.320 February | 5.1× |
| TorreviejaValencia, Spain | 2 | 37.823 February | 5.0× |
| AlgeteMadrid, Spain | 1 | 28.022 February | 4.9× |
| Laudio / LlodioBasque Country, Spain | 3 | 36.122 February | 4.8× |
| DurangoBasque Country, Spain | 3 | 35.819 February | 4.8× |
| AngletNew Aquitaine, France | 1 | 33.918 February | 4.8× |
| Gasteiz / VitoriaBasque Country, Spain | 4 | 31.622 February | 4.6× |
| ValenciaValencia, Spain | 5 | 40.023 February | 4.4× |
| AlbaceteCastille-La Mancha, Spain | 2 | 33.222 February | 4.4× |
| Ciudad RealCastille-La Mancha, Spain | 1 | 30.122 February | 4.4× |
| GetxoBasque Country, Spain | 5 | 29.617 February | 4.4× |
| BurrianaValencia, Spain | 1 | 25.823 February | 4.4× |
| MóstolesMadrid, Spain | 1 | 33.622 February | 4.3× |
| VillenaValencia, Spain | 1 | 29.623 February | 4.3× |
| Grao de MurviedroValencia, Spain | 2 | 27.123 February | 4.3× |
| BilbaoBasque Country, Spain | 4 | 29.522 February | 4.2× |
| HernaniBasque Country, Spain | 4 | 36.018 February | 4.1× |
| CalahorraLa Rioja, Spain | 3 | 33.318 February | 4.1× |
| ZaragozaAragon, Spain | 3 | 28.420 February | 4.1× |
| Azuqueca de HenaresCastille-La Mancha, Spain | 1 | 26.322 February | 4.1× |
| OviedoAsturias, Spain | 3 | 43.720 February | 4.0× |
| ValdemoroMadrid, Spain | 2 | 33.822 February | 4.0× |
| LugoGalicia, Spain | 4 | 32.320 February | 4.0× |
| MadridMadrid, Spain | 1 | 28.722 February | 4.0× |
| MelillaMelilla, Spain | 1 | 28.723 February | 3.9× |
| FerrolGalicia, Spain | 1 | 25.521 February | 3.9× |
| TarbesOccitanie, France | 4 | 37.321 February | 3.8× |
| ViveiroGalicia, Spain | 1 | 28.620 February | 3.8× |
| Santiago de CompostelaGalicia, Spain | 1 | 27.321 February | 3.8× |
| CártamaAndalusia, Spain | 1 | 26.522 February | 3.8× |
| Torrejón de ArdozMadrid, Spain | 1 | 25.522 February | 3.8× |
| PalenciaCastille and León, Spain | 1 | 25.322 February | 3.8× |
| OriaBasque Country, Spain | 4 | 33.018 February | 3.7× |
| Alcalá de HenaresMadrid, Spain | 1 | 31.522 February | 3.7× |
| CosladaMadrid, Spain | 1 | 30.622 February | 3.7× |
| CuencaCastille-La Mancha, Spain | 3 | 38.422 February | 3.6× |
| Salon-de-ProvenceProvence-Alpes-Côte d'Azur, France | 2 | 28.418 February | 3.6× |
| MontaubanOccitanie, France | 3 | 33.118 February | 3.5× |
| ToledoCastille-La Mancha, Spain | 1 | 26.322 February | 3.5× |
| SamaAsturias, Spain | 5 | 35.018 February | 3.4× |
| MarmandeNew Aquitaine, France | 1 | 25.316 February | 3.4× |
| VigoGalicia, Spain | 4 | 40.020 February | 3.3× |
| Collado-VillalbaMadrid, Spain | 1 | 29.922 February | 3.3× |
| AvilésAsturias, Spain | 1 | 27.420 February | 3.3× |
| ToulouseOccitanie, France | 2 | 26.518 February | 3.2× |
| AmorebietaBasque Country, Spain | 2 | 28.922 February | 3.1× |
| GijónAsturias, Spain | 4 | 31.421 February | 3.0× |
| MarseilleProvence-Alpes-Côte d'Azur, France | 2 | 28.517 February | 3.0× |
| AvignonProvence-Alpes-Côte d'Azur, France | 2 | 33.317 February | 2.9× |
| MarignaneProvence-Alpes-Côte d'Azur, France | 2 | 31.218 February | 2.9× |
| A CoruñaGalicia, Spain | 1 | 25.218 February | 2.9× |
| VitrollesProvence-Alpes-Côte d'Azur, France | 2 | 33.218 February | 2.8× |
| SevillaAndalusia, Spain | 1 | 27.622 February | 2.8× |
| JaénAndalusia, Spain | 1 | 25.922 February | 2.8× |
| Aix-en-ProvenceProvence-Alpes-Côte d'Azur, France | 1 | 25.518 February | 2.8× |
| BailénAndalusia, Spain | 3 | 36.022 February | 2.7× |
| LyonAuvergne-Rhône-Alpes, France | 1 | 27.317 February | 2.6× |
| ArlesProvence-Alpes-Côte d'Azur, France | 2 | 28.417 February | 2.5× |
| Villefranche-sur-SaôneAuvergne-Rhône-Alpes, France | 1 | 26.917 February | 2.5× |
| MontpellierOccitanie, France | 1 | 26.717 February | 2.5× |
| Fos-sur-MerProvence-Alpes-Côte d'Azur, France | 2 | 26.117 February | 2.5× |
| GardanneProvence-Alpes-Côte d'Azur, France | 1 | 32.318 February | 2.1× |
| ParedesPorto, Portugal | 1 | 30.019 February | 2.1× |
| Romans-sur-IsèreAuvergne-Rhône-Alpes, France | 1 | 26.317 February | 2.1× |
| ManosqueProvence-Alpes-Côte d'Azur, France | 1 | 25.217 February | 2.0× |
Daily means in µg/m³, over the days each city counted in this episode. Highest: its highest of those days. Usual: the city's median for the time of year of that day (its days within 21 days of the date, every year, leaving out the week around it). Above usual: its highest day against that, with a usual under 5 µg/m³ taken as 5.
Against other episodes in Spain and France
Number 6 of 58 episodes in Spain and France since our records began, by cities reached.
- Europe, 28 February to 4 March 2023279
- Europe, December 2025 to January 2026169
- Europe, March 2023121
- Western Europe, January 2024117
- Western Europe, December 202475
- Spain, France and Portugal, February 202372
- France, The Netherlands and United Kingdom, January 202366
- Europe, June 202565
- Spain, Portugal and Andorra, August 202544
- Spain, France and 2 more countries, December 2023 to January 202444
- France, Belgium and 2 more countries, November and December 202343
- Southern Europe, February 202438
Bars: cities reached; colour: the level of the episode's highest daily reading. All 58.
Use this page
SmogRank, Spain, France and Portugal, February 2023: 72 cities with PM2.5 at twice their usual or more, 16 to 23 February 2023, smogrank.com/episodes/2023-02-spain-france-and-portugal (accessed 4 October 2026).
You're welcome to reuse a single chart, image or figure with this citation and a link. Terms.
An episode is a run of days when many cities close to each other (four or more within 350 km on a day, 8 or more in all) each had a daily PM2.5 mean of at least 25 µg/m³ and at least 2 times their usual for that time of year. Found in our own measurements, not picked by hand. How we find episodes. Values are each city's daily mean of its own monitors; causes are the usual kinds for a pattern like this, not a confirmed source.