SmogRank / Episodes / Belgium
Belgium, May 2024
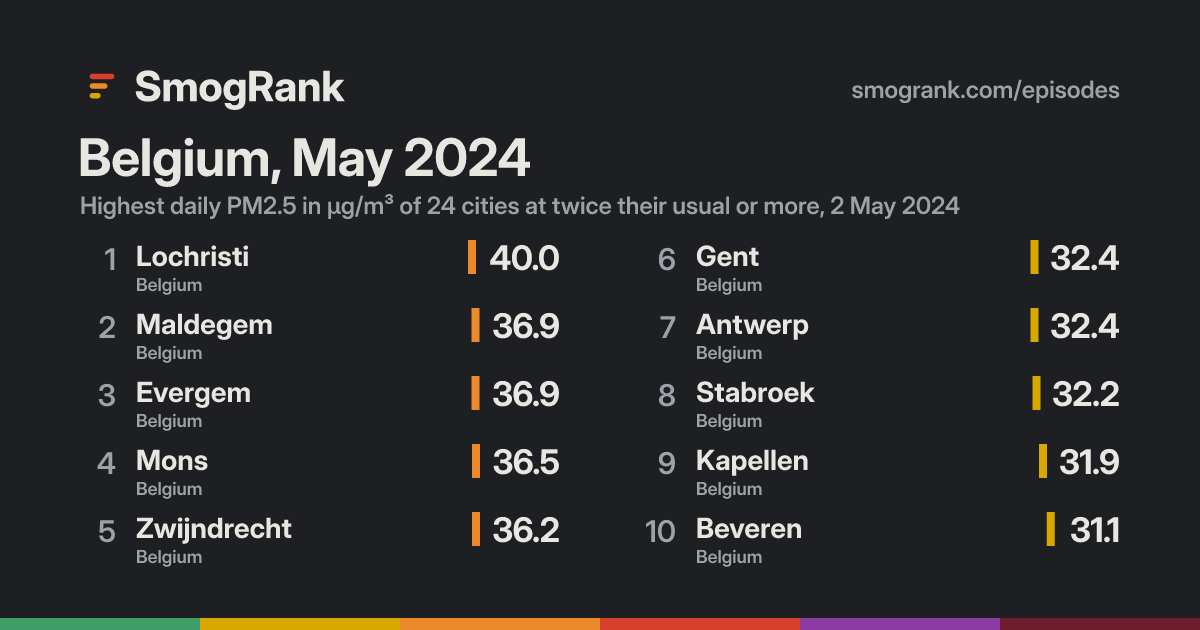
For 1 day, on 2 May 2024, 24 cities in Belgium, the United Kingdom and The Netherlands had PM2.5 at least twice their usual for the time of year. The worst reading was Lochristi, Flanders, Belgium: 40.0 µg/m³ on 2 May, about 4.1× its usual 9.7.
No cause named We have no fire or smoke records for these days, so we only say what the measurements show.
Cities reached 24 in 3 countries
Days 1 2 May 2024
Worst day 2 May 24 cities counted
Furthest above usual 5.0× Mons
Day by day
Play 2 May 24 cities at twice their usual or more
Canterbury Clacton-on-Sea Norwich Canvey Island Gillingham Dieppe Grays Dartford Newmarket Dagenham Bexley Seaford Rouen Maassluis London Spijkenisse The Hague Brighton Louviers Schiedam Rotterdam Biggleswade Charleroi Évreux Ridderkerk Hayes Hillegom Breda Le Havre Aarschot Velserbroek Velsen-Zuid Reims Badhoevedorp Namur Lisieux Zaanstad Amsterdam Tilburg IJsselstein Maarssen Purmerend Reading Utrecht Andenne Hasselt Portsmouth Houthalen Caen Medemblik Eindhoven Oxford Flémalle-Haute Marche-en-Famenne Kingston upon Hull Liège Southampton Barneveld Andover Royal Leamington Spa Nijmegen Venray Heerlen Eupen Aachen Chesterfield Venlo Cherbourg Sheffield Nettetal Birmingham Barnsley Jülich Esch-sur-Alzette Mönchengladbach Luxembourg Jüchen Leeds Krefeld Thionville Wesel Bergheim Stoke-on-Trent Metz Duisburg Düsseldorf Bristol Ratingen Oberhausen Borken Trier Bottrop Groningen Manchester Köln Enschede Leverkusen Essen Gelsenkirchen Irlam Bonn Dillingen Wuppertal Hattingen Newport Warrington Wigan Datteln Cardiff Saarbrücken Lingen Speke Dortmund Hagen Preston Neuwied Schwerte Liverpool Lüdenscheid Bendorf Münster Koblenz Unna Newton Abbot Briton Ferry Bad Kreuznach Kaiserslautern Friesoythe Soest Netphen Osnabrück Limburg an der Lahn Barnstaple Warstein Wiesbaden Mainz Plymouth Oldenburg Wilhelmshaven Saltash Rüsselsheim am Main Bielefeld Königstein im Taunus Worms Hattersheim Eschborn Lampertheim Ludwigshafen am Rhein Mannheim Speyer Eggenstein-Leopoldshafen Karlsruhe Bensheim Delmenhorst Bremerhaven Izegem Kortrijk Roeselare Menen Northampton Koksijde Brussels Mechelen Willebroek Beveren Grimbergen 's-Gravenzande Evergem Antwerp Gent Mol Zaventem Kapellen Stabroek Zwijndrecht Maldegem Lochristi Tournai Mons 29 Apr 30 1 May 2 3 4 5 Every measured city in the area, coloured by its PM2.5 that day; a dark ring marks a city at twice its usual or more. Bars: cities counted each day, coloured by their median level. Choose a day or press play; without JavaScript, the days link to that day's world ranking.
How it spread
Lochristi Lochristi, 29 April: 5.6 µg/m³, 0.6× usual Lochristi, 30 April: 6.9 µg/m³, 0.7× usual Lochristi, 1 May: 20.0 µg/m³, 2.1× usual Lochristi, 2 May: 40.0 µg/m³, 4.1× usual Lochristi, 3 May: 8.9 µg/m³, 0.9× usual Lochristi, 4 May: 5.4 µg/m³, 0.6× usual Lochristi, 5 May: 9.4 µg/m³, 1.0× usual Maldegem Maldegem, 29 April: 5.7 µg/m³, 0.6× usual Maldegem, 30 April: 6.5 µg/m³, 0.7× usual Maldegem, 1 May: 15.7 µg/m³, 1.7× usual Maldegem, 2 May: 36.9 µg/m³, 4.0× usual Maldegem, 3 May: 8.4 µg/m³, 0.9× usual Maldegem, 4 May: 4.1 µg/m³, 0.4× usual Maldegem, 5 May: 10.3 µg/m³, 1.1× usual Evergem Evergem, 29 April: 6.1 µg/m³, 0.6× usual Evergem, 30 April: 8.5 µg/m³, 0.8× usual Evergem, 1 May: 20.3 µg/m³, 1.9× usual Evergem, 2 May: 36.9 µg/m³, 3.5× usual Evergem, 3 May: 7.7 µg/m³, 0.7× usual Evergem, 4 May: 7.4 µg/m³, 0.7× usual Evergem, 5 May: 9.2 µg/m³, 0.9× usual Mons Mons, 29 April: 2.0 µg/m³, 0.3× usual Mons, 30 April: 4.9 µg/m³, 0.7× usual Mons, 1 May: 15.0 µg/m³, 2.1× usual Mons, 2 May: 36.5 µg/m³, 5.0× usual Mons, 3 May: 4.2 µg/m³, 0.6× usual Mons, 4 May: 3.7 µg/m³, 0.5× usual Mons, 5 May: no reading Zwijndrecht Zwijndrecht, 29 April: 5.8 µg/m³, 0.6× usual Zwijndrecht, 30 April: 5.8 µg/m³, 0.6× usual Zwijndrecht, 1 May: 18.6 µg/m³, 2.0× usual Zwijndrecht, 2 May: 36.2 µg/m³, 3.9× usual Zwijndrecht, 3 May: 10.4 µg/m³, 1.1× usual Zwijndrecht, 4 May: 4.6 µg/m³, 0.5× usual Zwijndrecht, 5 May: 10.6 µg/m³, 1.1× usual Gent Gent, 29 April: 3.9 µg/m³, 0.4× usual Gent, 30 April: 6.3 µg/m³, 0.7× usual Gent, 1 May: 17.0 µg/m³, 1.9× usual Gent, 2 May: 32.4 µg/m³, 3.6× usual Gent, 3 May: 7.1 µg/m³, 0.8× usual Gent, 4 May: 4.4 µg/m³, 0.5× usual Gent, 5 May: 6.6 µg/m³, 0.7× usual Antwerp Antwerp, 29 April: 5.3 µg/m³, 0.6× usual Antwerp, 30 April: 6.3 µg/m³, 0.7× usual Antwerp, 1 May: 16.8 µg/m³, 1.9× usual Antwerp, 2 May: 32.4 µg/m³, 3.6× usual Antwerp, 3 May: 7.9 µg/m³, 0.9× usual Antwerp, 4 May: 4.8 µg/m³, 0.5× usual Antwerp, 5 May: 10.9 µg/m³, 1.2× usual Stabroek Stabroek, 29 April: 5.5 µg/m³, 0.6× usual Stabroek, 30 April: 6.3 µg/m³, 0.7× usual Stabroek, 1 May: 17.4 µg/m³, 2.0× usual Stabroek, 2 May: 32.2 µg/m³, 3.8× usual Stabroek, 3 May: 9.4 µg/m³, 1.1× usual Stabroek, 4 May: 4.7 µg/m³, 0.6× usual Stabroek, 5 May: 11.2 µg/m³, 1.3× usual Kapellen Kapellen, 29 April: 5.4 µg/m³, 0.6× usual Kapellen, 30 April: 6.5 µg/m³, 0.8× usual Kapellen, 1 May: 16.2 µg/m³, 1.9× usual Kapellen, 2 May: 31.9 µg/m³, 3.8× usual Kapellen, 3 May: 10.9 µg/m³, 1.3× usual Kapellen, 4 May: 5.1 µg/m³, 0.6× usual Kapellen, 5 May: 12.7 µg/m³, 1.5× usual Beveren Beveren, 29 April: 4.5 µg/m³, 0.5× usual Beveren, 30 April: 6.2 µg/m³, 0.7× usual Beveren, 1 May: 16.7 µg/m³, 1.8× usual Beveren, 2 May: 31.1 µg/m³, 3.3× usual Beveren, 3 May: 7.8 µg/m³, 0.8× usual Beveren, 4 May: 4.8 µg/m³, 0.5× usual Beveren, 5 May: 10.0 µg/m³, 1.1× usual Mol Mol, 29 April: 4.3 µg/m³, 0.5× usual Mol, 30 April: 5.7 µg/m³, 0.7× usual Mol, 1 May: 16.2 µg/m³, 2.0× usual Mol, 2 May: 29.6 µg/m³, 3.6× usual Mol, 3 May: 8.1 µg/m³, 1.0× usual Mol, 4 May: 4.8 µg/m³, 0.6× usual Mol, 5 May: 9.2 µg/m³, 1.1× usual Roeselare Roeselare, 29 April: 5.4 µg/m³, 0.5× usual Roeselare, 30 April: 7.1 µg/m³, 0.6× usual Roeselare, 1 May: 15.8 µg/m³, 1.4× usual Roeselare, 2 May: 29.5 µg/m³, 2.7× usual Roeselare, 3 May: 6.1 µg/m³, 0.6× usual Roeselare, 4 May: 5.3 µg/m³, 0.5× usual Roeselare, 5 May: 6.7 µg/m³, 0.6× usual Menen Menen, 29 April: 6.0 µg/m³, 0.6× usual Menen, 30 April: 6.4 µg/m³, 0.6× usual Menen, 1 May: 15.0 µg/m³, 1.5× usual Menen, 2 May: 28.9 µg/m³, 2.8× usual Menen, 3 May: 6.0 µg/m³, 0.6× usual Menen, 4 May: 4.6 µg/m³, 0.4× usual Menen, 5 May: 7.3 µg/m³, 0.7× usual Tournai Tournai, 29 April: 1.6 µg/m³, 0.2× usual Tournai, 30 April: 3.6 µg/m³, 0.5× usual Tournai, 1 May: 12.8 µg/m³, 1.9× usual Tournai, 2 May: 28.4 µg/m³, 4.2× usual Tournai, 3 May: 2.2 µg/m³, 0.3× usual Tournai, 4 May: 2.3 µg/m³, 0.3× usual Tournai, 5 May: 4.1 µg/m³, 0.6× usual Grimbergen Grimbergen, 29 April: 4.9 µg/m³, 0.6× usual Grimbergen, 30 April: 5.6 µg/m³, 0.7× usual Grimbergen, 1 May: 16.5 µg/m³, 1.9× usual Grimbergen, 2 May: 28.4 µg/m³, 3.3× usual Grimbergen, 3 May: 6.8 µg/m³, 0.8× usual Grimbergen, 4 May: 3.6 µg/m³, 0.4× usual Grimbergen, 5 May: 8.1 µg/m³, 0.9× usual Izegem Izegem, 29 April: 4.7 µg/m³, 0.4× usual Izegem, 30 April: 6.1 µg/m³, 0.6× usual Izegem, 1 May: 13.6 µg/m³, 1.2× usual Izegem, 2 May: 28.0 µg/m³, 2.6× usual Izegem, 3 May: 7.2 µg/m³, 0.7× usual Izegem, 4 May: 4.1 µg/m³, 0.4× usual Izegem, 5 May: 6.8 µg/m³, 0.6× usual Koksijde Koksijde, 29 April: 5.4 µg/m³, 0.6× usual Koksijde, 30 April: 9.0 µg/m³, 1.0× usual Koksijde, 1 May: 13.7 µg/m³, 1.5× usual Koksijde, 2 May: 26.9 µg/m³, 2.9× usual Koksijde, 3 May: 4.6 µg/m³, 0.5× usual Koksijde, 4 May: 5.1 µg/m³, 0.5× usual Koksijde, 5 May: 5.8 µg/m³, 0.6× usual Kortrijk Kortrijk, 29 April: 3.9 µg/m³, 0.4× usual Kortrijk, 30 April: 6.0 µg/m³, 0.6× usual Kortrijk, 1 May: 13.9 µg/m³, 1.4× usual Kortrijk, 2 May: 26.6 µg/m³, 2.6× usual Kortrijk, 3 May: 5.4 µg/m³, 0.5× usual Kortrijk, 4 May: 4.1 µg/m³, 0.4× usual Kortrijk, 5 May: 6.3 µg/m³, 0.6× usual 's-Gravenzande 's-Gravenzande, 29 April: 7.0 µg/m³, 0.9× usual 's-Gravenzande, 30 April: 7.9 µg/m³, 1.0× usual 's-Gravenzande, 1 May: 17.5 µg/m³, 2.2× usual 's-Gravenzande, 2 May: 26.5 µg/m³, 3.3× usual 's-Gravenzande, 3 May: 12.9 µg/m³, 1.6× usual 's-Gravenzande, 4 May: 5.5 µg/m³, 0.7× usual 's-Gravenzande, 5 May: 6.9 µg/m³, 0.9× usual Brussels Brussels, 29 April: 4.4 µg/m³, 0.5× usual Brussels, 30 April: 5.2 µg/m³, 0.6× usual Brussels, 1 May: 15.1 µg/m³, 1.8× usual Brussels, 2 May: 25.9 µg/m³, 3.1× usual Brussels, 3 May: 6.6 µg/m³, 0.8× usual Brussels, 4 May: 4.2 µg/m³, 0.5× usual Brussels, 5 May: 8.3 µg/m³, 1.0× usual Northampton Northampton, 29 April: no reading Northampton, 30 April: no reading Northampton, 1 May: no reading Northampton, 2 May: 25.9 µg/m³, 2.8× usual Northampton, 3 May: 7.4 µg/m³, 0.8× usual Northampton, 4 May: 7.4 µg/m³, 0.8× usual Northampton, 5 May: no reading Zaventem Zaventem, 29 April: 4.1 µg/m³, 0.6× usual Zaventem, 30 April: 4.9 µg/m³, 0.7× usual Zaventem, 1 May: 15.0 µg/m³, 2.1× usual Zaventem, 2 May: 25.5 µg/m³, 3.6× usual Zaventem, 3 May: 6.4 µg/m³, 0.9× usual Zaventem, 4 May: 3.3 µg/m³, 0.5× usual Zaventem, 5 May: 7.5 µg/m³, 1.1× usual Mechelen Mechelen, 29 April: 4.9 µg/m³, 0.6× usual Mechelen, 30 April: 5.1 µg/m³, 0.6× usual Mechelen, 1 May: 14.5 µg/m³, 1.8× usual Mechelen, 2 May: 25.2 µg/m³, 3.1× usual Mechelen, 3 May: 6.8 µg/m³, 0.8× usual Mechelen, 4 May: 4.0 µg/m³, 0.5× usual Mechelen, 5 May: 7.6 µg/m³, 0.9× usual Willebroek Willebroek, 29 April: 4.1 µg/m³, 0.5× usual Willebroek, 30 April: 5.1 µg/m³, 0.6× usual Willebroek, 1 May: 14.6 µg/m³, 1.8× usual Willebroek, 2 May: 25.0 µg/m³, 3.1× usual Willebroek, 3 May: 7.2 µg/m³, 0.9× usual Willebroek, 4 May: 6.9 µg/m³, 0.9× usual Willebroek, 5 May: 7.6 µg/m³, 0.9× usual 29 Apr 30 1 May 2 3 4 5 Every counted city, in the order the episode reached them, 3 days before to 3 after. Each square is a day, coloured by that day's PM2.5; outlined: at twice the city's usual or more. Good 0–50
Moderate 51–100
Sensitive groups 101–150
Unhealthy 151–200
Very unhealthy 201–300
Hazardous 301+
Every city it reached
City Days Highest Usual Above usual
Mons Wallonia, Belgium 1 2 May 7.3 5.0× Tournai Wallonia, Belgium 1 2 May 6.8 4.2× Lochristi Flanders, Belgium 1 2 May 9.7 4.1× Maldegem Flanders, Belgium 1 2 May 9.3 4.0× Zwijndrecht Flanders, Belgium 1 2 May 9.4 3.9× Stabroek Flanders, Belgium 1 2 May 8.5 3.8× Kapellen Flanders, Belgium 1 2 May 8.5 3.8× Mol Flanders, Belgium 1 2 May 8.2 3.6× Gent Flanders, Belgium 1 2 May 9.0 3.6× Antwerp Flanders, Belgium 1 2 May 9.0 3.6× Zaventem Flanders, Belgium 1 2 May 7.1 3.6× Evergem Flanders, Belgium 1 2 May 10.5 3.5× Beveren Flanders, Belgium 1 2 May 9.3 3.3× 's-Gravenzande South Holland, The Netherlands 1 2 May 8.0 3.3× Grimbergen Flanders, Belgium 1 2 May 8.6 3.3× Brussels Brussels Capital, Belgium 1 2 May 8.3 3.1× Willebroek Flanders, Belgium 1 2 May 8.1 3.1× Mechelen Flanders, Belgium 1 2 May 8.2 3.1× Koksijde Flanders, Belgium 1 2 May 9.4 2.9× Northampton England, United Kingdom 1 2 May 9.1 2.8× Menen Flanders, Belgium 1 2 May 10.3 2.8× Roeselare Flanders, Belgium 1 2 May 11.0 2.7× Kortrijk Flanders, Belgium 1 2 May 10.1 2.6× Izegem Flanders, Belgium 1 2 May 10.9 2.6×
Daily means in µg/m³. Usual: the city's median for this time of year (its days within 21 days of the date, every year, leaving out the week around it). Above usual: its highest day against that.
Against other episodes in Belgium and the United Kingdom
Number 9 of 23 episodes in Belgium and the United Kingdom since our records began, by cities reached.
Western Europe, December 2024 75 France, The Netherlands and United Kingdom, January 2023 66 Western Europe, January 2025 50 France, Belgium and United Kingdom, November and December 2023 43 United Kingdom and Belgium, September 2023 42 Western Europe, November 2024 38 France and Belgium, April 2023 36 Belgium and Germany, May 2023 26 Belgium, May 2024 24 Belgium, France and 2 more countries, August 2024 23 United Kingdom and The Netherlands, March 2024 20 Belgium, May 2024 18 Bars: cities reached; colour: the level of the episode's highest daily reading. All 23 .
Use this page SmogRank, Belgium, May 2024: 24 cities with PM2.5 at twice their usual or more, 2 May 2024, smogrank.com/episodes/2024-05-belgium (accessed 3 October 2026).
Copy citation Download top 10 (PNG)
You're welcome to reuse a single chart, image or figure with this citation and a link. Terms .
An episode is a run of days when many cities close to each other (four or more within 350 km on a day, 8 or more in all) each had a daily PM2.5 mean of at least 25 µg/m³ and at least 2 times their usual for that time of year. Found in our own measurements, not picked by hand. How we find episodes . Values are each city's daily mean of its own monitors; causes are the usual kinds for a pattern like this, not a confirmed source.