Western Europe, January 2025
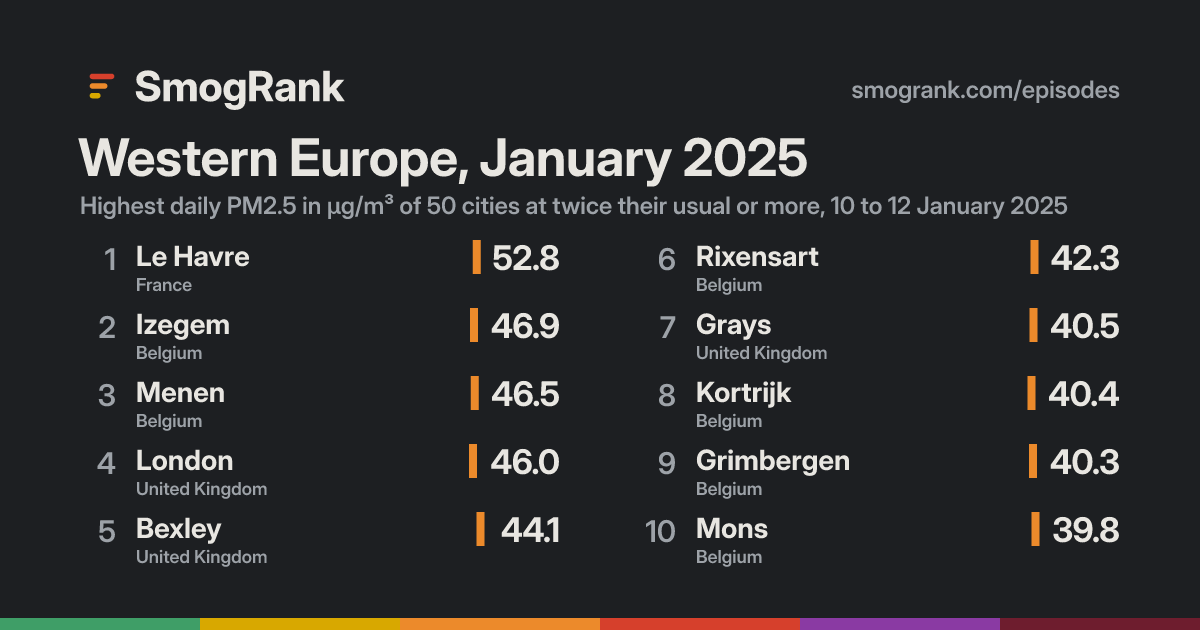
For 3 days, from 10 to 12 January 2025, 50 cities in Belgium, Germany, the United Kingdom and 3 more countries had PM2.5 at least twice their usual for the time of year. The worst reading was Le Havre, Normandy, France: 52.8 µg/m³ on 12 January, about 5.8× its usual 9.1.
Day by day
How it spread
Every city it reached
| City | Days | Highest | Above usual |
|---|---|---|---|
| DagenhamEngland, United Kingdom | 3 | 36.311 January | 6.2× |
| Le HavreNormandy, France | 2 | 52.812 January | 5.8× |
| LondonEngland, United Kingdom | 3 | 46.011 January | 5.8× |
| BexleyEngland, United Kingdom | 2 | 44.111 January | 5.7× |
| MonsWallonia, Belgium | 1 | 39.815 January | 5.6× |
| CarlowLeinster, Ireland | 1 | 35.69 January | 5.3× |
| GraysEngland, United Kingdom | 3 | 40.511 January | 5.1× |
| DartfordEngland, United Kingdom | 1 | 35.711 January | 5.0× |
| RixensartWallonia, Belgium | 1 | 42.312 January | 4.8× |
| MenenFlanders, Belgium | 2 | 46.511 January | 4.6× |
| ZaventemFlanders, Belgium | 2 | 38.715 January | 4.4× |
| BirminghamEngland, United Kingdom | 1 | 31.110 January | 4.4× |
| WillebroekFlanders, Belgium | 2 | 36.215 January | 4.4× |
| GentFlanders, Belgium | 1 | 38.011 January | 4.3× |
| BrusselsBrussels Capital, Belgium | 1 | 33.515 January | 4.2× |
| LochristiFlanders, Belgium | 1 | 38.811 January | 4.2× |
| KortrijkFlanders, Belgium | 2 | 40.411 January | 4.1× |
| MechelenFlanders, Belgium | 1 | 38.215 January | 4.1× |
| AntwerpFlanders, Belgium | 1 | 36.415 January | 4.0× |
| GrimbergenFlanders, Belgium | 2 | 40.315 January | 3.9× |
| IzegemFlanders, Belgium | 2 | 46.911 January | 3.9× |
| EvergemFlanders, Belgium | 1 | 37.311 January | 3.8× |
| BeverenFlanders, Belgium | 1 | 35.711 January | 3.8× |
| Boulogne-sur-MerHauts-de-France, France | 1 | 36.711 January | 3.8× |
| KapellenFlanders, Belgium | 1 | 35.011 January | 3.8× |
| DenainHauts-de-France, France | 1 | 39.515 January | 3.8× |
| StabroekFlanders, Belgium | 1 | 32.611 January | 3.8× |
| RoeselareFlanders, Belgium | 1 | 37.311 January | 3.8× |
| ZwijndrechtFlanders, Belgium | 1 | 31.411 January | 3.6× |
| HattingenNorth Rhine-Westphalia, Germany | 1 | 28.111 January | 3.3× |
| DouaiHauts-de-France, France | 2 | 32.312 January | 3.3× |
| HeerlenLimburg, The Netherlands | 1 | 26.012 January | 3.3× |
| HouthalenFlanders, Belgium | 1 | 30.415 January | 3.2× |
| HasseltFlanders, Belgium | 1 | 30.815 January | 3.1× |
| OberhausenNorth Rhine-Westphalia, Germany | 1 | 29.815 January | 3.1× |
| AarschotFlanders, Belgium | 1 | 25.512 January | 3.0× |
| WuppertalNorth Rhine-Westphalia, Germany | 1 | 28.211 January | 2.9× |
| DuisburgNorth Rhine-Westphalia, Germany | 1 | 28.315 January | 2.9× |
| JülichNorth Rhine-Westphalia, Germany | 1 | 25.712 January | 2.9× |
| RatingenNorth Rhine-Westphalia, Germany | 1 | 26.111 January | 2.9× |
| EssenNorth Rhine-Westphalia, Germany | 1 | 26.611 January | 2.8× |
| DüsseldorfNorth Rhine-Westphalia, Germany | 1 | 27.711 January | 2.8× |
| BottropNorth Rhine-Westphalia, Germany | 1 | 29.215 January | 2.7× |
| ValenciennesHauts-de-France, France | 1 | 26.312 January | 2.7× |
| KrefeldNorth Rhine-Westphalia, Germany | 1 | 27.911 January | 2.7× |
| BredaNorth Brabant, The Netherlands | 1 | 28.711 January | 2.6× |
| LeverkusenNorth Rhine-Westphalia, Germany | 1 | 25.011 January | 2.6× |
| TilburgNorth Brabant, The Netherlands | 1 | 30.814 January | 2.6× |
| GelsenkirchenNorth Rhine-Westphalia, Germany | 1 | 26.411 January | 2.5× |
| EindhovenNorth Brabant, The Netherlands | 1 | 26.814 January | 2.2× |
Daily means in µg/m³. Usual: the city's median for this time of year (its days within 21 days of the date, every year, leaving out the week around it). Above usual: its highest day against that.
Against other episodes in Belgium and Germany
Number 19 of 35 episodes in Belgium and Germany since our records began, by cities reached.
- Central Europe, February 2023604
- Central Europe, February and March 2025513
- Central Europe, February 2025503
- Central Europe, January and February 2026498
- Central Europe, March 2025458
- Central Europe, March 2026442
- Central Europe, January 2025383
- Central Europe, March 2026361
- Central Europe, March 2025333
- Central Europe, December 2025 to January 2026170
- Eastern Europe, January 2025123
- Eastern Europe, December 2023107
- Western Europe, January 202550
Bars: cities reached; colour: the level of the episode's highest daily reading. All 35.
Use this page
SmogRank, Western Europe, January 2025: 50 cities with PM2.5 at twice their usual or more, 10 to 12 January 2025, smogrank.com/episodes/2025-01-western-europe (accessed 3 October 2026).
You're welcome to reuse a single chart, image or figure with this citation and a link. Terms.
An episode is a run of days when many cities close to each other (four or more within 350 km on a day, 8 or more in all) each had a daily PM2.5 mean of at least 25 µg/m³ and at least 2 times their usual for that time of year. Found in our own measurements, not picked by hand. How we find episodes. Values are each city's daily mean of its own monitors; causes are the usual kinds for a pattern like this, not a confirmed source.