SmogRank / Episodes / Slovenia
Southern Europe, June 2024
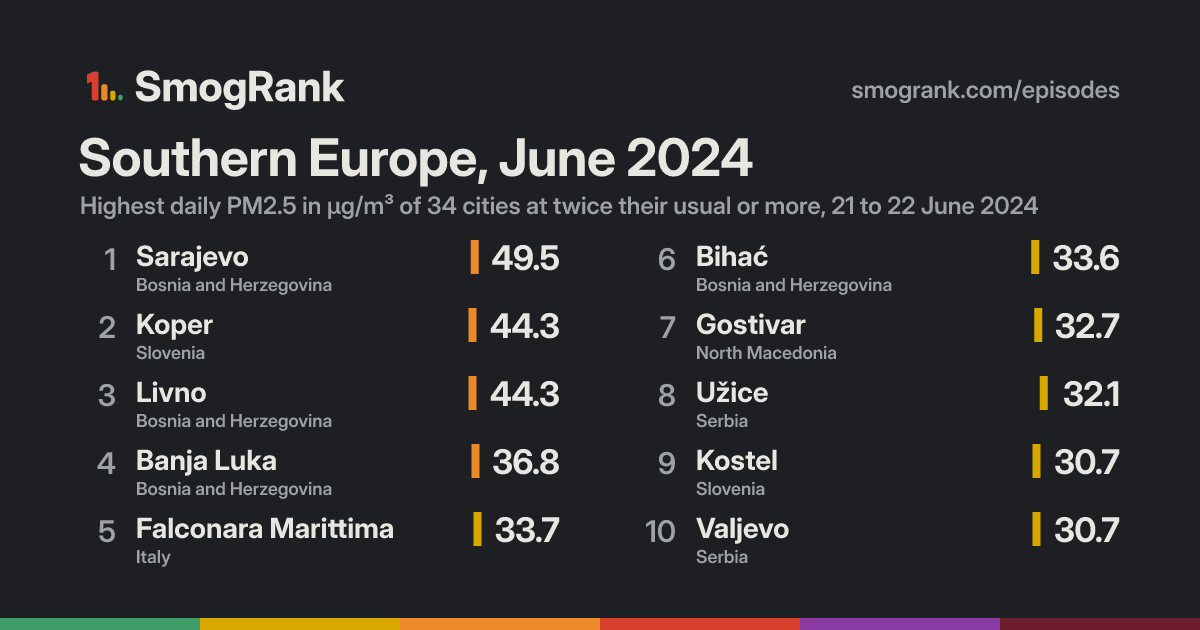
For 2 days, from 21 to 22 June 2024, 34 cities in Slovenia, North Macedonia, Italy and 2 more countries had PM2.5 at least twice their usual for the time of year. The worst reading was Sarajevo, Federation of B&H, Bosnia and Herzegovina: 49.5 µg/m³ on 22 June, about 3.2× its usual 15.7. Ended 22 June.
No cause named We have no fire or smoke records for these days, so we only say what the measurements show.
Cities reached 34 in 5 countries
Days 2 21 to 22 June 2024
Worst day 21 June 32 cities counted
Furthest above usual 7.4× Koper
Day by day
Play 21 June 32 cities at twice their usual or more
Pécs Murska Sobota Futog Leibnitz Jesi Novi Sad Čačak Obrenovac Pejë Surčin Sremčica Wolfsberg Zemun Filmski Grad Voitsberg Belgrade Ripanj Kraljevo Klagenfurt am Wörthersee Vinča Dunaújváros Pančevo Mitrovicë Kragujevac Prizren Glogovac Smederevo Szeged Kosovo Polje Pristina Ćuprija Paraćin Hani i Elezit Gjilan Skopje Niš Bor Pirot Rovereto Strumica Sofia Thessaloníki Pylaía Lazarevac Valjevo Tetovo Trento Novi Pazar Bitola Užice Falconara Marittima Bolzano Laives Borgo Valsugana Veles Kavadarci Gostivar Sarajevo Travnik San Pietro Vernotico Ilinden Kranj Banja Luka Maribor Ljubljana Nova Gorica Gorizia Trbovlje Ptuj Celje Zagorje ob Savi Kochani Bihać Novo Mesto Kostel Livno Koper 18 Jun 19 20 21 22 23 24 25 Every measured city in the area, coloured by its PM2.5 that day; a dark ring marks a city at twice its usual or more. Bars: cities counted each day, coloured by their median level. Choose a day or press play; without JavaScript, the days link to that day's world ranking.
How it spread
Sarajevo Sarajevo, 18 June: 27.4 µg/m³ Sarajevo, 19 June: 24.6 µg/m³ Sarajevo, 20 June: 39.7 µg/m³ Sarajevo, 21 June: 49.0 µg/m³, 3.1× its usual 15.7 Sarajevo, 22 June: 49.5 µg/m³, 3.2× its usual 15.7 Sarajevo, 23 June: 40.7 µg/m³ Sarajevo, 24 June: 32.6 µg/m³ Sarajevo, 25 June: 33.4 µg/m³ Koper Koper, 18 June: 6.6 µg/m³ Koper, 19 June: 7.1 µg/m³ Koper, 20 June: no reading Koper, 21 June: 44.3 µg/m³, 7.4× its usual 6.0 Koper, 22 June: 19.8 µg/m³ Koper, 23 June: 7.8 µg/m³ Koper, 24 June: 8.3 µg/m³ Koper, 25 June: 8.4 µg/m³ Livno Livno, 18 June: 5.1 µg/m³ Livno, 19 June: 6.7 µg/m³ Livno, 20 June: 22.3 µg/m³ Livno, 21 June: 44.3 µg/m³, 6.0× its usual 7.4 Livno, 22 June: 34.1 µg/m³, 4.9× its usual 7.0 Livno, 23 June: 15.4 µg/m³ Livno, 24 June: 13.6 µg/m³ Livno, 25 June: 10.3 µg/m³ Falconara Marittima Falconara Marittima, 18 June: 14.3 µg/m³ Falconara Marittima, 19 June: 17.2 µg/m³ Falconara Marittima, 20 June: no reading Falconara Marittima, 21 June: 33.7 µg/m³, 2.6× its usual 12.9 Falconara Marittima, 22 June: 23.1 µg/m³ Falconara Marittima, 23 June: 13.0 µg/m³ Falconara Marittima, 24 June: 16.9 µg/m³ Falconara Marittima, 25 June: 13.8 µg/m³ Bihać Bihać, 18 June: 6.5 µg/m³ Bihać, 19 June: 8.5 µg/m³ Bihać, 20 June: 17.3 µg/m³ Bihać, 21 June: 33.3 µg/m³, 4.4× its usual 7.6 Bihać, 22 June: 33.6 µg/m³, 4.7× its usual 7.1 Bihać, 23 June: 7.8 µg/m³ Bihać, 24 June: 9.4 µg/m³ Bihać, 25 June: 11.0 µg/m³ Gostivar Gostivar, 18 June: 15.3 µg/m³ Gostivar, 19 June: 16.9 µg/m³ Gostivar, 20 June: 20.6 µg/m³ Gostivar, 21 June: 32.7 µg/m³, 2.9× its usual 11.1 Gostivar, 22 June: 30.5 µg/m³, 2.7× its usual 11.1 Gostivar, 23 June: no reading Gostivar, 24 June: no reading Gostivar, 25 June: no reading Banja Luka Banja Luka, 18 June: 11.6 µg/m³ Banja Luka, 19 June: 13.1 µg/m³ Banja Luka, 20 June: 19.0 µg/m³ Banja Luka, 21 June: 30.8 µg/m³, 3.1× its usual 9.9 Banja Luka, 22 June: 36.8 µg/m³, 3.7× its usual 10.0 Banja Luka, 23 June: 9.4 µg/m³ Banja Luka, 24 June: 11.7 µg/m³ Banja Luka, 25 June: 11.6 µg/m³ Kostel Kostel, 18 June: 7.3 µg/m³ Kostel, 19 June: 7.5 µg/m³ Kostel, 20 June: no reading Kostel, 21 June: 30.7 µg/m³, 5.0× its usual 6.1 Kostel, 22 June: 25.2 µg/m³, 4.1× its usual 6.1 Kostel, 23 June: 6.6 µg/m³ Kostel, 24 June: 7.9 µg/m³ Kostel, 25 June: 9.6 µg/m³ Gorizia Gorizia, 18 June: 7.9 µg/m³ Gorizia, 19 June: 8.2 µg/m³ Gorizia, 20 June: no reading Gorizia, 21 June: 30.5 µg/m³, 4.0× its usual 7.7 Gorizia, 22 June: 24.7 µg/m³ Gorizia, 23 June: 8.0 µg/m³ Gorizia, 24 June: 8.3 µg/m³ Gorizia, 25 June: 9.2 µg/m³ Nova Gorica Nova Gorica, 18 June: 7.9 µg/m³ Nova Gorica, 19 June: 8.2 µg/m³ Nova Gorica, 20 June: no reading Nova Gorica, 21 June: 30.5 µg/m³, 4.0× its usual 7.7 Nova Gorica, 22 June: 24.7 µg/m³ Nova Gorica, 23 June: 8.0 µg/m³ Nova Gorica, 24 June: 8.3 µg/m³ Nova Gorica, 25 June: 9.2 µg/m³ Zagorje ob Savi Zagorje ob Savi, 18 June: 8.7 µg/m³ Zagorje ob Savi, 19 June: 8.8 µg/m³ Zagorje ob Savi, 20 June: no reading Zagorje ob Savi, 21 June: 30.4 µg/m³, 4.5× its usual 6.7 Zagorje ob Savi, 22 June: 26.1 µg/m³, 3.8× its usual 6.9 Zagorje ob Savi, 23 June: 6.3 µg/m³ Zagorje ob Savi, 24 June: 8.7 µg/m³ Zagorje ob Savi, 25 June: 9.9 µg/m³ Celje Celje, 18 June: 9.4 µg/m³ Celje, 19 June: 9.3 µg/m³ Celje, 20 June: no reading Celje, 21 June: 30.4 µg/m³, 4.4× its usual 6.9 Celje, 22 June: 25.3 µg/m³, 3.7× its usual 6.9 Celje, 23 June: 6.2 µg/m³ Celje, 24 June: 8.4 µg/m³ Celje, 25 June: 9.0 µg/m³ Ljubljana Ljubljana, 18 June: 9.4 µg/m³ Ljubljana, 19 June: 7.7 µg/m³ Ljubljana, 20 June: no reading Ljubljana, 21 June: 30.1 µg/m³, 3.9× its usual 7.7 Ljubljana, 22 June: 26.7 µg/m³, 3.4× its usual 7.8 Ljubljana, 23 June: 6.3 µg/m³ Ljubljana, 24 June: 8.3 µg/m³ Ljubljana, 25 June: 8.2 µg/m³ Kranj Kranj, 18 June: 9.1 µg/m³ Kranj, 19 June: 10.1 µg/m³ Kranj, 20 June: no reading Kranj, 21 June: 29.6 µg/m³, 3.6× its usual 8.3 Kranj, 22 June: 30.3 µg/m³, 3.6× its usual 8.4 Kranj, 23 June: 6.8 µg/m³ Kranj, 24 June: 10.2 µg/m³ Kranj, 25 June: 10.3 µg/m³ Užice Užice, 18 June: 16.6 µg/m³ Užice, 19 June: 14.0 µg/m³ Užice, 20 June: 23.4 µg/m³ Užice, 21 June: 28.9 µg/m³, 2.3× its usual 12.5 Užice, 22 June: 32.1 µg/m³, 2.6× its usual 12.5 Užice, 23 June: 21.5 µg/m³ Užice, 24 June: 21.5 µg/m³ Užice, 25 June: 17.7 µg/m³ Novo Mesto Novo Mesto, 18 June: 7.8 µg/m³ Novo Mesto, 19 June: 7.5 µg/m³ Novo Mesto, 20 June: no reading Novo Mesto, 21 June: 28.0 µg/m³, 4.7× its usual 6.0 Novo Mesto, 22 June: 29.3 µg/m³, 4.9× its usual 6.0 Novo Mesto, 23 June: 5.3 µg/m³ Novo Mesto, 24 June: 8.6 µg/m³ Novo Mesto, 25 June: 8.3 µg/m³ Ptuj Ptuj, 18 June: 12.1 µg/m³ Ptuj, 19 June: 9.7 µg/m³ Ptuj, 20 June: no reading Ptuj, 21 June: 28.0 µg/m³, 4.2× its usual 6.7 Ptuj, 22 June: 19.2 µg/m³ Ptuj, 23 June: 5.3 µg/m³ Ptuj, 24 June: 7.1 µg/m³ Ptuj, 25 June: 9.1 µg/m³ Valjevo Valjevo, 18 June: no reading Valjevo, 19 June: 14.0 µg/m³ Valjevo, 20 June: 19.1 µg/m³ Valjevo, 21 June: 27.9 µg/m³, 2.0× its usual 13.7 Valjevo, 22 June: 30.7 µg/m³, 2.2× its usual 13.7 Valjevo, 23 June: 16.8 µg/m³ Valjevo, 24 June: 18.0 µg/m³ Valjevo, 25 June: 15.1 µg/m³ Trento Trento, 18 June: 13.2 µg/m³ Trento, 19 June: 14.5 µg/m³ Trento, 20 June: no reading Trento, 21 June: 27.7 µg/m³, 2.3× its usual 12.0 Trento, 22 June: 11.2 µg/m³ Trento, 23 June: 7.3 µg/m³ Trento, 24 June: 6.5 µg/m³ Trento, 25 June: 10.6 µg/m³ Trbovlje Trbovlje, 18 June: 8.2 µg/m³ Trbovlje, 19 June: 8.1 µg/m³ Trbovlje, 20 June: no reading Trbovlje, 21 June: 27.6 µg/m³, 4.2× its usual 6.5 Trbovlje, 22 June: 24.5 µg/m³ Trbovlje, 23 June: 5.2 µg/m³ Trbovlje, 24 June: 8.0 µg/m³ Trbovlje, 25 June: 8.0 µg/m³ Maribor Maribor, 18 June: 10.7 µg/m³ Maribor, 19 June: 12.7 µg/m³ Maribor, 20 June: no reading Maribor, 21 June: 27.1 µg/m³, 3.9× its usual 7.0 Maribor, 22 June: 20.9 µg/m³ Maribor, 23 June: 5.4 µg/m³ Maribor, 24 June: 7.9 µg/m³ Maribor, 25 June: 8.8 µg/m³ Bitola Bitola, 18 June: 12.3 µg/m³ Bitola, 19 June: 16.3 µg/m³ Bitola, 20 June: 30.8 µg/m³ Bitola, 21 June: 27.1 µg/m³, 2.5× its usual 10.9 Bitola, 22 June: 27.1 µg/m³, 2.5× its usual 11.0 Bitola, 23 June: 23.1 µg/m³ Bitola, 24 June: 22.4 µg/m³ Bitola, 25 June: 20.5 µg/m³ Travnik Travnik, 18 June: 12.0 µg/m³ Travnik, 19 June: 13.5 µg/m³ Travnik, 20 June: 18.9 µg/m³ Travnik, 21 June: 27.0 µg/m³, 3.2× its usual 8.5 Travnik, 22 June: 28.3 µg/m³, 3.3× its usual 8.5 Travnik, 23 June: 18.6 µg/m³ Travnik, 24 June: 11.4 µg/m³ Travnik, 25 June: 11.0 µg/m³ Borgo Valsugana Borgo Valsugana, 18 June: 16.0 µg/m³ Borgo Valsugana, 19 June: 17.4 µg/m³ Borgo Valsugana, 20 June: no reading Borgo Valsugana, 21 June: 26.9 µg/m³, 2.7× its usual 9.9 Borgo Valsugana, 22 June: 11.4 µg/m³ Borgo Valsugana, 23 June: 6.6 µg/m³ Borgo Valsugana, 24 June: 8.5 µg/m³ Borgo Valsugana, 25 June: 10.4 µg/m³ Kavadarci Kavadarci, 18 June: 12.4 µg/m³ Kavadarci, 19 June: 11.8 µg/m³ Kavadarci, 20 June: no reading Kavadarci, 21 June: 26.8 µg/m³, 2.9× its usual 9.4 Kavadarci, 22 June: 19.7 µg/m³ Kavadarci, 23 June: 14.5 µg/m³ Kavadarci, 24 June: 17.9 µg/m³ Kavadarci, 25 June: 10.9 µg/m³ Kochani Kochani, 18 June: 6.8 µg/m³ Kochani, 19 June: 9.2 µg/m³ Kochani, 20 June: 21.0 µg/m³ Kochani, 21 June: 26.7 µg/m³, 4.6× its usual 5.8 Kochani, 22 June: 17.1 µg/m³ Kochani, 23 June: 16.5 µg/m³ Kochani, 24 June: 11.9 µg/m³ Kochani, 25 June: 8.3 µg/m³ Novi Pazar Novi Pazar, 18 June: 14.7 µg/m³ Novi Pazar, 19 June: 13.1 µg/m³ Novi Pazar, 20 June: 20.1 µg/m³ Novi Pazar, 21 June: 26.6 µg/m³, 2.1× its usual 12.4 Novi Pazar, 22 June: 28.3 µg/m³, 2.3× its usual 12.3 Novi Pazar, 23 June: 27.4 µg/m³ Novi Pazar, 24 June: 18.7 µg/m³ Novi Pazar, 25 June: 15.1 µg/m³ Laives Laives, 18 June: 14.1 µg/m³ Laives, 19 June: 14.6 µg/m³ Laives, 20 June: no reading Laives, 21 June: 26.3 µg/m³, 2.7× its usual 9.7 Laives, 22 June: 7.9 µg/m³ Laives, 23 June: 2.8 µg/m³ Laives, 24 June: 6.9 µg/m³ Laives, 25 June: 10.7 µg/m³ Bolzano Bolzano, 18 June: 14.1 µg/m³ Bolzano, 19 June: 14.6 µg/m³ Bolzano, 20 June: no reading Bolzano, 21 June: 26.3 µg/m³, 2.7× its usual 9.7 Bolzano, 22 June: 7.9 µg/m³ Bolzano, 23 June: 2.8 µg/m³ Bolzano, 24 June: 6.9 µg/m³ Bolzano, 25 June: 10.7 µg/m³ Lazarevac Lazarevac, 18 June: 14.1 µg/m³ Lazarevac, 19 June: 15.3 µg/m³ Lazarevac, 20 June: 19.7 µg/m³ Lazarevac, 21 June: 25.9 µg/m³, 2.1× its usual 12.3 Lazarevac, 22 June: 25.7 µg/m³, 2.0× its usual 12.7 Lazarevac, 23 June: 16.3 µg/m³ Lazarevac, 24 June: 17.8 µg/m³ Lazarevac, 25 June: 14.4 µg/m³ Ilinden Ilinden, 18 June: 8.3 µg/m³ Ilinden, 19 June: 18.6 µg/m³ Ilinden, 20 June: 14.1 µg/m³ Ilinden, 21 June: 25.6 µg/m³, 3.5× its usual 7.3 Ilinden, 22 June: 19.2 µg/m³ Ilinden, 23 June: 16.3 µg/m³ Ilinden, 24 June: 53.5 µg/m³ Ilinden, 25 June: 8.1 µg/m³ Veles Veles, 18 June: 12.3 µg/m³ Veles, 19 June: 11.7 µg/m³ Veles, 20 June: 17.2 µg/m³ Veles, 21 June: 25.0 µg/m³, 2.8× its usual 9.0 Veles, 22 June: 18.6 µg/m³ Veles, 23 June: 14.6 µg/m³ Veles, 24 June: 14.1 µg/m³ Veles, 25 June: 11.2 µg/m³ San Pietro Vernotico San Pietro Vernotico, 18 June: 6.7 µg/m³ San Pietro Vernotico, 19 June: 19.7 µg/m³ San Pietro Vernotico, 20 June: no reading San Pietro Vernotico, 21 June: no reading San Pietro Vernotico, 22 June: 28.4 µg/m³, 3.3× its usual 8.7 San Pietro Vernotico, 23 June: 13.4 µg/m³ San Pietro Vernotico, 24 June: 8.5 µg/m³ San Pietro Vernotico, 25 June: 58.3 µg/m³ Tetovo Tetovo, 18 June: 11.6 µg/m³ Tetovo, 19 June: 14.3 µg/m³ Tetovo, 20 June: 18.0 µg/m³ Tetovo, 21 June: 22.8 µg/m³ Tetovo, 22 June: 25.4 µg/m³, 2.3× its usual 11.2 Tetovo, 23 June: 22.1 µg/m³ Tetovo, 24 June: 22.9 µg/m³ Tetovo, 25 June: 16.8 µg/m³ 18 Jun 19 20 21 22 23 24 25 Every counted city, in the order the episode reached them, 3 days before to 3 after. Each square is a day, coloured by that day's PM2.5; outlined: at twice the city's usual or more. Good 0–50
Moderate 51–100
Sensitive groups 101–150
Unhealthy 151–200
Very unhealthy 201–300
Hazardous 301+
Every city it reached
City Days Highest Usual Above usual
Koper Urban Municipality of Koper, Slovenia 1 21 June 6.0 7.4× Livno Federation of B&H, Bosnia and Herzegovina 2 21 June 7.4 6.0× Kostel Municipality of Kostel, Slovenia 2 21 June 6.1 5.0× Novo Mesto Urban Municipality of Novo Mesto, Slovenia 2 22 June 6.0 4.9× Bihać Federation of B&H, Bosnia and Herzegovina 2 22 June 7.1 4.7× Kochani Kochani, North Macedonia 1 21 June 5.8 4.6× Zagorje ob Savi Municipality of Zagorje ob Savi, Slovenia 2 21 June 6.7 4.5× Celje Urban Municipality of Celje, Slovenia 2 21 June 6.9 4.4× Ptuj Urban Municipality of Ptuj, Slovenia 1 21 June 6.7 4.2× Trbovlje Municipality of Trbovlje, Slovenia 1 21 June 6.5 4.2× Gorizia Friuli Venezia Giulia, Italy 1 21 June 7.7 4.0× Nova Gorica Urban Municipality of Nova Gorica, Slovenia 1 21 June 7.7 4.0× Ljubljana Ljubljana, Slovenia 2 21 June 7.7 3.9× Maribor Urban Municipality of Maribor, Slovenia 1 21 June 7.0 3.9× Banja Luka Srpska, Bosnia and Herzegovina 2 22 June 10.0 3.7× Kranj Urban Municipality of Kranj, Slovenia 2 22 June 8.4 3.6× Ilinden Ilinden, North Macedonia 1 21 June 7.3 3.5× San Pietro Vernotico Apulia, Italy 1 22 June 8.7 3.3× Travnik Federation of B&H, Bosnia and Herzegovina 2 22 June 8.5 3.3× Sarajevo Federation of B&H, Bosnia and Herzegovina 2 22 June 15.7 3.2× Gostivar Gostivar, North Macedonia 2 21 June 11.1 2.9× Kavadarci Kavadarci, North Macedonia 1 21 June 9.4 2.9× Veles Veles, North Macedonia 1 21 June 9.0 2.8× Borgo Valsugana Trentino-Alto Adige, Italy 1 21 June 9.9 2.7× Laives Trentino-Alto Adige, Italy 1 21 June 9.7 2.7× Bolzano Trentino-Alto Adige, Italy 1 21 June 9.7 2.7× Falconara Marittima The Marches, Italy 1 21 June 12.9 2.6× Užice Central Serbia, Serbia 2 22 June 12.5 2.6× Bitola Bitola, North Macedonia 2 21 June 10.9 2.5× Novi Pazar Central Serbia, Serbia 2 22 June 12.3 2.3× Trento Trentino-Alto Adige, Italy 1 21 June 12.0 2.3× Tetovo Tetovo, North Macedonia 1 22 June 11.2 2.3× Valjevo Central Serbia, Serbia 2 22 June 13.7 2.2× Lazarevac Central Serbia, Serbia 2 21 June 12.3 2.1×
Daily means in µg/m³, over the days each city counted in this episode. Highest: its highest of those days. Usual: the city's median for the time of year of that day (its days within 21 days of the date, every year, leaving out the week around it). Above usual: its highest day against that, with a usual under 5 µg/m³ taken as 5.
Against other episodes in Slovenia and North Macedonia
The largest of 5 episodes in Slovenia and North Macedonia since our records began, by cities reached.
Bars: cities reached; colour: the level of the episode's highest daily reading.
Use this page SmogRank, Southern Europe, June 2024: 34 cities with PM2.5 at twice their usual or more, 21 to 22 June 2024, smogrank.com/episodes/2024-06-southern-europe (accessed 5 October 2026).
Copy citation Download top 10 (PNG)
You're welcome to reuse a single chart, image or figure with this citation and a link. Terms .
An episode is a run of days when many cities close to each other (four or more within 350 km on a day, 8 or more in all) each had a daily PM2.5 mean of at least 25 µg/m³ and at least 2 times their usual for that time of year. Found in our own measurements, not picked by hand. How we find episodes . Values are each city's daily mean of its own monitors; causes are the usual kinds for a pattern like this, not a confirmed source.