SmogRank / Episodes / United States

North-eastern United States and Canada, 10 to 14 June 2025

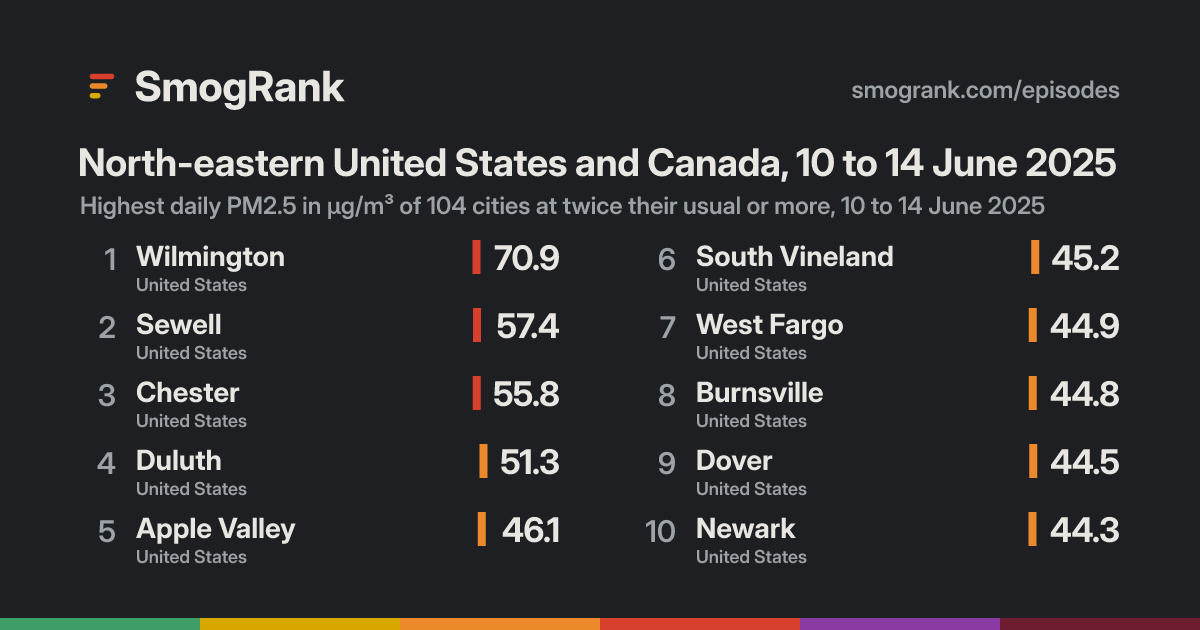
For 5 days, from 10 to 14 June 2025, 104 cities in the United States and Canada had PM2.5 at least twice their usual for the time of year. The worst reading was Wilmington, Delaware, United States: 70.9 µg/m³ on 14 June, about 9.8× its usual 7.2.

No cause namedWe have no fire or smoke records for these days, so we only say what the measurements show.
Cities reached104in 2 countries
Days510 to 14 June 2025
Worst day12 June68 cities counted
Furthest above usual10×Duluth

Day by day

12 June 68 cities at twice their usual or more
Fort WayneAnn ArborYpsilantiElkhartToledoLimaFlintTaylorRedfordHollandLincoln ParkSouthfieldDearbornDetroitBay CityEastpointeKokomoPortageMiddletownDublinPort HuronSarniaLebanonLafayetteChathamMasonGahannaWhite OakNorwoodCincinnatiFort ThomasColumbusMedinaNorthbrookZionClevelandSouth MilwaukeeCleveland HeightsShaker HeightsBloomingtonAkronPainesvilleCantonLondonPortsmouthJeffersonvilleSaint MatthewsNew AlbanyLouisvilleJeffersontownLexington-FayetteValley StationWarrenAshlandNicholasvilleJasperHuntingtonHermitageElizabethtownKitchenerWeirton HeightsSault Ste. MarieBrantfordErieGuelphCharlestonOwensboroEvansvilleWaterdownHamiltonMiltonMarquetteBramptonOakvilleMississaugaAllistonClintonTorontoBarrieSt. CatharinesNewmarketMolineDavenportKingsportGreater SudburyBuffaloHendersonvilleClarksvilleJohnstownMuscatineSt. LouisUniversity CityLemayArnoldRoanokeIowa CityNorth BayPeterboroughCedar RapidsHarrisonburgState CollegeRochesterCharlottesvilleWaterlooBellevilleAshburnRockvilleSpringfieldRose HillWashingtonShort PumpScaggsvilleOxon Hill-GlassmanorSouth LaurelRichmondKingstonBaltimoreSyracuseHopewellAnkenyDes MoinesReadingRoanoke RapidsScrantonAllentownBethlehemUticaNorristownNepeanOttawaSpringfieldEast HamptonPennsaukenChesapeakeBensalemLibertyEwingTrentonRaymoreKansas CityRandolphKansas CityLeawoodSaint JosephNew BrunswickCornwallOlathePleasantvilleLindenElizabethPatersonAtlantic CityBayonneToms RiverJersey CityNewburghNew CityNew York CityFort LeeWhite PlainsBellevueOmahaLa VistaTopekaDanburyDorvalBridgeportMontréalWaterburyHolbrookRivière-des-Prairies–Pointe-aux-TremblesBrossardNew HavenRutlandLincolnSaint-Jean-sur-RichelieuSioux FallsHartfordNorth ChicopeeSpringfieldGreenfieldSorel-TracyGranbyNew LondonShawiniganDrummondvilleTrois-RivièresCoventryMilfordDerbyWichitaSherbrookeProvidencePawtucketLaconiaPonca CityLowellDerryGrand IslandFall RiverHaverhillBrocktonQuincyLynnPortsmouthL'Ancienne-LoretteQuébecPortlandLewistonAugustaDodge CityWyomingWest MifflinGaryGranite CityTerre HauteWilkinsburgEast Saint LouisSteubenvilleSpringfieldPittsburghMcKeesportYoungstownPaducahOregonDaytonFishersHarrisburgCalumet CityLebanonChicagoDoltonIndianapolisPhiladelphiaEast ChicagoColumbusWestervilleOak LawnNapervilleSt. ThomasPerrysburgMilwaukeeYorkKalamazooFranklin ParkSpringfieldLansingCaryWindsorLancasterJolietJenisonAlbanyElmwood ParkBrookfieldElginHammondBridgeviewAndersonWeirtonDes PlainesSouth BendGrand RapidsDecaturPeoriaBloomingtonCarlisleUpper AltonRockfordWheelingMuncieWaukeshaColumbiaAuroraBostonMichigan CityWorcesterPittsfieldWatertownHunt ValleyAltoonaKeeneEssexHagerstownFraminghamAberdeenSaint CloudNewarkDoverAppletonChampaignMadisonOconomowocRochesterBearSaint PaulSuperiorGreen BayEdgewoodSouth VinelandElktonMinneapolisBrookingsSaint MichaelMankatoWest FargoBurnsvilleBlaineShakopeeEau ClaireChesterSewellApple ValleyWilmingtonDuluth
7 Jun891011121314151617
Every measured city in the area, coloured by its PM2.5 that day; a dark ring marks a city at twice its usual or more. Bars: cities counted each day, coloured by their median level. Choose a day or press play; without JavaScript, the days link to that day's world ranking.

How it spread

DuluthDuluth, 7 June: 24.2 µg/m³Duluth, 8 June: 36.4 µg/m³Duluth, 9 June: 14.7 µg/m³Duluth, 10 June: 30.6 µg/m³, 6.1× its usual 5.0Duluth, 11 June: 51.3 µg/m³, 10× its usual 5.0Duluth, 12 June: 6.9 µg/m³Duluth, 13 June: 5.2 µg/m³Duluth, 14 June: 6.2 µg/m³Duluth, 15 June: 8.3 µg/m³Duluth, 16 June: 12.1 µg/m³Duluth, 17 June: 9.3 µg/m³Apple ValleyApple Valley, 7 June: 20.0 µg/m³Apple Valley, 8 June: 16.9 µg/m³Apple Valley, 9 June: 12.0 µg/m³Apple Valley, 10 June: 27.2 µg/m³, 5.0× its usual 5.4Apple Valley, 11 June: 35.3 µg/m³, 6.4× its usual 5.5Apple Valley, 12 June: 46.1 µg/m³, 8.1× its usual 5.7Apple Valley, 13 June: 13.0 µg/m³Apple Valley, 14 June: 10.7 µg/m³Apple Valley, 15 June: 11.4 µg/m³Apple Valley, 16 June: 7.0 µg/m³Apple Valley, 17 June: 6.2 µg/m³West FargoWest Fargo, 7 June: 7.3 µg/m³West Fargo, 8 June: 22.8 µg/m³West Fargo, 9 June: 18.1 µg/m³West Fargo, 10 June: 28.2 µg/m³, 4.3× its usual 6.5West Fargo, 11 June: 44.9 µg/m³, 6.9× its usual 6.5West Fargo, 12 June: 21.5 µg/m³West Fargo, 13 June: 8.3 µg/m³West Fargo, 14 June: 4.8 µg/m³West Fargo, 15 June: 4.3 µg/m³West Fargo, 16 June: 3.9 µg/m³West Fargo, 17 June: 6.1 µg/m³BurnsvilleBurnsville, 7 June: 20.4 µg/m³Burnsville, 8 June: 16.3 µg/m³Burnsville, 9 June: 11.1 µg/m³Burnsville, 10 June: 27.6 µg/m³, 4.5× its usual 6.2Burnsville, 11 June: 35.2 µg/m³, 5.7× its usual 6.2Burnsville, 12 June: 44.8 µg/m³, 7.1× its usual 6.3Burnsville, 13 June: 11.9 µg/m³Burnsville, 14 June: 8.8 µg/m³Burnsville, 15 June: 10.7 µg/m³Burnsville, 16 June: 6.7 µg/m³Burnsville, 17 June: 6.1 µg/m³ShakopeeShakopee, 7 June: 17.0 µg/m³Shakopee, 8 June: 15.2 µg/m³Shakopee, 9 June: 11.4 µg/m³Shakopee, 10 June: 27.4 µg/m³, 4.6× its usual 5.9Shakopee, 11 June: 33.5 µg/m³, 5.7× its usual 5.9Shakopee, 12 June: 43.8 µg/m³, 7.3× its usual 6.0Shakopee, 13 June: 14.8 µg/m³Shakopee, 14 June: 9.3 µg/m³Shakopee, 15 June: 11.2 µg/m³Shakopee, 16 June: 6.2 µg/m³Shakopee, 17 June: 5.4 µg/m³MinneapolisMinneapolis, 7 June: 18.3 µg/m³Minneapolis, 8 June: 16.3 µg/m³Minneapolis, 9 June: 13.0 µg/m³Minneapolis, 10 June: 31.1 µg/m³, 5.0× its usual 6.2Minneapolis, 11 June: 34.3 µg/m³, 5.4× its usual 6.3Minneapolis, 12 June: 43.7 µg/m³, 6.7× its usual 6.5Minneapolis, 13 June: 13.9 µg/m³Minneapolis, 14 June: 7.1 µg/m³Minneapolis, 15 June: 11.6 µg/m³Minneapolis, 16 June: 7.7 µg/m³Minneapolis, 17 June: 7.2 µg/m³RochesterRochester, 7 June: 25.0 µg/m³Rochester, 8 June: 21.6 µg/m³Rochester, 9 June: 10.5 µg/m³Rochester, 10 June: 25.3 µg/m³, 3.7× its usual 6.8Rochester, 11 June: 34.2 µg/m³, 5.0× its usual 6.9Rochester, 12 June: 42.0 µg/m³, 6.1× its usual 6.9Rochester, 13 June: 10.1 µg/m³Rochester, 14 June: 14.0 µg/m³Rochester, 15 June: 9.3 µg/m³Rochester, 16 June: 8.4 µg/m³Rochester, 17 June: 5.2 µg/m³OconomowocOconomowoc, 7 June: 36.8 µg/m³Oconomowoc, 8 June: 36.5 µg/m³Oconomowoc, 9 June: 24.4 µg/m³Oconomowoc, 10 June: 32.2 µg/m³, 5.5× its usual 5.9Oconomowoc, 11 June: 38.2 µg/m³, 6.3× its usual 6.1Oconomowoc, 12 June: 41.8 µg/m³, 6.1× its usual 6.8Oconomowoc, 13 June: 14.3 µg/m³Oconomowoc, 14 June: 17.0 µg/m³Oconomowoc, 15 June: 16.4 µg/m³Oconomowoc, 16 June: 23.5 µg/m³Oconomowoc, 17 June: 10.9 µg/m³Eau ClaireEau Claire, 7 June: 19.5 µg/m³Eau Claire, 8 June: 22.5 µg/m³Eau Claire, 9 June: 9.6 µg/m³Eau Claire, 10 June: 30.8 µg/m³, 5.6× its usual 5.5Eau Claire, 11 June: 34.8 µg/m³, 6.3× its usual 5.5Eau Claire, 12 June: 41.5 µg/m³, 7.4× its usual 5.6Eau Claire, 13 June: 10.9 µg/m³Eau Claire, 14 June: 7.6 µg/m³Eau Claire, 15 June: 9.3 µg/m³Eau Claire, 16 June: 9.2 µg/m³Eau Claire, 17 June: 5.5 µg/m³BlaineBlaine, 7 June: 15.8 µg/m³Blaine, 8 June: 15.2 µg/m³Blaine, 9 June: 12.3 µg/m³Blaine, 10 June: 30.6 µg/m³, 5.7× its usual 5.4Blaine, 11 June: 32.7 µg/m³, 6.1× its usual 5.4Blaine, 12 June: 40.3 µg/m³, 7.3× its usual 5.5Blaine, 13 June: 13.1 µg/m³Blaine, 14 June: 5.7 µg/m³Blaine, 15 June: 9.1 µg/m³Blaine, 16 June: 6.7 µg/m³Blaine, 17 June: 5.6 µg/m³Saint MichaelSaint Michael, 7 June: 13.5 µg/m³Saint Michael, 8 June: 13.3 µg/m³Saint Michael, 9 June: 12.3 µg/m³Saint Michael, 10 June: 28.9 µg/m³, 5.2× its usual 5.6Saint Michael, 11 June: 27.4 µg/m³, 4.9× its usual 5.6Saint Michael, 12 June: 39.4 µg/m³, 6.8× its usual 5.8Saint Michael, 13 June: 11.4 µg/m³Saint Michael, 14 June: 4.9 µg/m³Saint Michael, 15 June: 8.7 µg/m³Saint Michael, 16 June: 6.8 µg/m³Saint Michael, 17 June: 5.5 µg/m³Saint PaulSaint Paul, 7 June: 18.5 µg/m³Saint Paul, 8 June: 15.4 µg/m³Saint Paul, 9 June: 11.2 µg/m³Saint Paul, 10 June: 28.7 µg/m³, 4.8× its usual 6.0Saint Paul, 11 June: 31.3 µg/m³, 5.1× its usual 6.1Saint Paul, 12 June: 38.4 µg/m³, 6.2× its usual 6.2Saint Paul, 13 June: 12.2 µg/m³Saint Paul, 14 June: 6.3 µg/m³Saint Paul, 15 June: 9.7 µg/m³Saint Paul, 16 June: no readingSaint Paul, 17 June: no readingSaint CloudSaint Cloud, 7 June: 9.7 µg/m³Saint Cloud, 8 June: 11.2 µg/m³Saint Cloud, 9 June: 12.5 µg/m³Saint Cloud, 10 June: 26.4 µg/m³, 4.8× its usual 5.5Saint Cloud, 11 June: 29.1 µg/m³, 5.3× its usual 5.5Saint Cloud, 12 June: 27.7 µg/m³, 4.9× its usual 5.6Saint Cloud, 13 June: 8.3 µg/m³Saint Cloud, 14 June: 3.7 µg/m³Saint Cloud, 15 June: 7.5 µg/m³Saint Cloud, 16 June: 7.1 µg/m³Saint Cloud, 17 June: 4.7 µg/m³SuperiorSuperior, 7 June: 18.9 µg/m³Superior, 8 June: 27.9 µg/m³Superior, 9 June: 11.2 µg/m³Superior, 10 June: 24.7 µg/m³Superior, 11 June: 40.6 µg/m³, 6.2× its usual 6.6Superior, 12 June: 6.6 µg/m³Superior, 13 June: 5.1 µg/m³Superior, 14 June: 4.6 µg/m³Superior, 15 June: 6.5 µg/m³Superior, 16 June: 9.9 µg/m³Superior, 17 June: 7.1 µg/m³MankatoMankato, 7 June: 18.7 µg/m³Mankato, 8 June: 16.2 µg/m³Mankato, 9 June: 12.9 µg/m³Mankato, 10 June: 23.5 µg/m³Mankato, 11 June: 35.8 µg/m³, 6.2× its usual 5.8Mankato, 12 June: 40.6 µg/m³, 6.9× its usual 5.9Mankato, 13 June: 14.9 µg/m³Mankato, 14 June: 12.8 µg/m³Mankato, 15 June: 9.8 µg/m³Mankato, 16 June: 5.7 µg/m³Mankato, 17 June: 4.1 µg/m³BrookingsBrookings, 7 June: 14.6 µg/m³Brookings, 8 June: 21.4 µg/m³Brookings, 9 June: 16.6 µg/m³Brookings, 10 June: 22.5 µg/m³Brookings, 11 June: 28.7 µg/m³, 5.4× its usual 5.3Brookings, 12 June: 36.1 µg/m³, 6.8× its usual 5.3Brookings, 13 June: 24.6 µg/m³Brookings, 14 June: 9.8 µg/m³Brookings, 15 June: 11.1 µg/m³Brookings, 16 June: 9.6 µg/m³Brookings, 17 June: 8.5 µg/m³Green BayGreen Bay, 7 June: 19.8 µg/m³Green Bay, 8 June: 20.8 µg/m³Green Bay, 9 June: 10.3 µg/m³Green Bay, 10 June: 18.3 µg/m³Green Bay, 11 June: 34.9 µg/m³, 6.3× its usual 5.5Green Bay, 12 June: 24.4 µg/m³Green Bay, 13 June: 6.0 µg/m³Green Bay, 14 June: 6.8 µg/m³Green Bay, 15 June: 6.1 µg/m³Green Bay, 16 June: 12.2 µg/m³Green Bay, 17 June: 8.5 µg/m³MadisonMadison, 7 June: 24.5 µg/m³Madison, 8 June: 25.2 µg/m³Madison, 9 June: 17.9 µg/m³Madison, 10 June: 22.4 µg/m³Madison, 11 June: 25.6 µg/m³, 4.5× its usual 5.7Madison, 12 June: 33.4 µg/m³, 5.9× its usual 5.7Madison, 13 June: 10.1 µg/m³Madison, 14 June: 16.3 µg/m³Madison, 15 June: 12.9 µg/m³Madison, 16 June: 12.0 µg/m³Madison, 17 June: 5.6 µg/m³AppletonAppleton, 7 June: 18.8 µg/m³Appleton, 8 June: 24.8 µg/m³Appleton, 9 June: 10.1 µg/m³Appleton, 10 June: 21.3 µg/m³Appleton, 11 June: 31.9 µg/m³, 5.8× its usual 5.5Appleton, 12 June: 31.3 µg/m³, 5.5× its usual 5.7Appleton, 13 June: 6.0 µg/m³Appleton, 14 June: 7.6 µg/m³Appleton, 15 June: 6.9 µg/m³Appleton, 16 June: 12.0 µg/m³Appleton, 17 June: 7.2 µg/m³Franklin ParkFranklin Park, 7 June: 32.3 µg/m³Franklin Park, 8 June: 27.6 µg/m³Franklin Park, 9 June: 20.4 µg/m³Franklin Park, 10 June: 20.9 µg/m³Franklin Park, 11 June: 26.3 µg/m³, 3.1× its usual 8.5Franklin Park, 12 June: 30.3 µg/m³, 3.6× its usual 8.5Franklin Park, 13 June: 27.4 µg/m³, 3.1× its usual 8.7Franklin Park, 14 June: 16.1 µg/m³Franklin Park, 15 June: 11.7 µg/m³Franklin Park, 16 June: 15.9 µg/m³Franklin Park, 17 June: 12.1 µg/m³KalamazooKalamazoo, 7 June: 32.8 µg/m³Kalamazoo, 8 June: 25.3 µg/m³Kalamazoo, 9 June: 21.1 µg/m³Kalamazoo, 10 June: 16.6 µg/m³Kalamazoo, 11 June: 26.5 µg/m³, 3.3× its usual 8.1Kalamazoo, 12 June: 29.8 µg/m³, 3.6× its usual 8.2Kalamazoo, 13 June: 19.8 µg/m³Kalamazoo, 14 June: 12.9 µg/m³Kalamazoo, 15 June: 13.9 µg/m³Kalamazoo, 16 June: 12.5 µg/m³Kalamazoo, 17 June: 10.8 µg/m³WatertownWatertown, 7 June: 9.2 µg/m³Watertown, 8 June: 21.5 µg/m³Watertown, 9 June: 13.3 µg/m³Watertown, 10 June: 19.6 µg/m³Watertown, 11 June: 29.5 µg/m³, 4.6× its usual 6.4Watertown, 12 June: 24.7 µg/m³Watertown, 13 June: 6.8 µg/m³Watertown, 14 June: 2.6 µg/m³Watertown, 15 June: 2.7 µg/m³Watertown, 16 June: 2.5 µg/m³Watertown, 17 June: 4.6 µg/m³ColumbiaColumbia, 7 June: 19.8 µg/m³Columbia, 8 June: 25.9 µg/m³Columbia, 9 June: 29.0 µg/m³Columbia, 10 June: 35.4 µg/m³Columbia, 11 June: 29.4 µg/m³, 4.4× its usual 6.7Columbia, 12 June: 25.2 µg/m³, 3.5× its usual 7.1Columbia, 13 June: 18.8 µg/m³Columbia, 14 June: 18.6 µg/m³Columbia, 15 June: 20.9 µg/m³Columbia, 16 June: 18.0 µg/m³Columbia, 17 June: 17.3 µg/m³DoltonDolton, 7 June: 24.4 µg/m³Dolton, 8 June: 26.1 µg/m³Dolton, 9 June: 22.3 µg/m³Dolton, 10 June: 21.1 µg/m³Dolton, 11 June: 26.3 µg/m³, 3.3× its usual 7.9Dolton, 12 June: 29.1 µg/m³, 3.4× its usual 8.5Dolton, 13 June: 28.6 µg/m³, 3.3× its usual 8.8Dolton, 14 June: 15.3 µg/m³Dolton, 15 June: 10.4 µg/m³Dolton, 16 June: 16.0 µg/m³Dolton, 17 June: 10.4 µg/m³Grand RapidsGrand Rapids, 7 June: 19.7 µg/m³Grand Rapids, 8 June: 35.6 µg/m³Grand Rapids, 9 June: 23.4 µg/m³Grand Rapids, 10 June: 16.9 µg/m³Grand Rapids, 11 June: 27.6 µg/m³, 3.8× its usual 7.2Grand Rapids, 12 June: 28.4 µg/m³, 3.9× its usual 7.3Grand Rapids, 13 June: 12.1 µg/m³Grand Rapids, 14 June: 8.8 µg/m³Grand Rapids, 15 June: 10.2 µg/m³Grand Rapids, 16 June: 13.1 µg/m³Grand Rapids, 17 June: 12.0 µg/m³WaukeshaWaukesha, 7 June: 25.5 µg/m³Waukesha, 8 June: 24.2 µg/m³Waukesha, 9 June: 19.5 µg/m³Waukesha, 10 June: 21.6 µg/m³Waukesha, 11 June: 26.2 µg/m³, 4.1× its usual 6.4Waukesha, 12 June: 28.0 µg/m³, 4.4× its usual 6.4Waukesha, 13 June: 8.8 µg/m³Waukesha, 14 June: 10.2 µg/m³Waukesha, 15 June: 11.1 µg/m³Waukesha, 16 June: 14.0 µg/m³Waukesha, 17 June: 8.7 µg/m³WheelingWheeling, 7 June: 24.8 µg/m³Wheeling, 8 June: 24.1 µg/m³Wheeling, 9 June: 16.6 µg/m³Wheeling, 10 June: 19.4 µg/m³Wheeling, 11 June: 22.3 µg/m³Wheeling, 12 June: 31.4 µg/m³, 3.8× its usual 8.3Wheeling, 13 June: 34.5 µg/m³, 4.3× its usual 8.1Wheeling, 14 June: 11.5 µg/m³Wheeling, 15 June: 7.9 µg/m³Wheeling, 16 June: 10.8 µg/m³Wheeling, 17 June: 9.4 µg/m³ChampaignChampaign, 7 June: 26.0 µg/m³Champaign, 8 June: 22.9 µg/m³Champaign, 9 June: 18.6 µg/m³Champaign, 10 June: 12.1 µg/m³Champaign, 11 June: 22.2 µg/m³Champaign, 12 June: 33.8 µg/m³, 5.8× its usual 5.8Champaign, 13 June: 20.5 µg/m³Champaign, 14 June: 8.3 µg/m³Champaign, 15 June: 9.4 µg/m³Champaign, 16 June: 8.8 µg/m³Champaign, 17 June: 7.0 µg/m³BridgeviewBridgeview, 7 June: 28.5 µg/m³Bridgeview, 8 June: 25.9 µg/m³Bridgeview, 9 June: 19.5 µg/m³Bridgeview, 10 June: 19.4 µg/m³Bridgeview, 11 June: 24.2 µg/m³Bridgeview, 12 June: 31.2 µg/m³, 3.7× its usual 8.5Bridgeview, 13 June: 32.3 µg/m³, 3.8× its usual 8.6Bridgeview, 14 June: 19.0 µg/m³Bridgeview, 15 June: 12.7 µg/m³Bridgeview, 16 June: 16.4 µg/m³Bridgeview, 17 June: 9.5 µg/m³Terre HauteTerre Haute, 7 June: 17.8 µg/m³Terre Haute, 8 June: 17.1 µg/m³Terre Haute, 9 June: 14.1 µg/m³Terre Haute, 10 June: 14.2 µg/m³Terre Haute, 11 June: 23.0 µg/m³Terre Haute, 12 June: 31.4 µg/m³, 3.0× its usual 10.3Terre Haute, 13 June: 19.3 µg/m³Terre Haute, 14 June: 7.4 µg/m³Terre Haute, 15 June: 10.0 µg/m³Terre Haute, 16 June: 10.1 µg/m³Terre Haute, 17 June: 10.4 µg/m³HammondHammond, 7 June: 28.1 µg/m³Hammond, 8 June: 25.5 µg/m³Hammond, 9 June: 21.5 µg/m³Hammond, 10 June: 17.0 µg/m³Hammond, 11 June: 21.7 µg/m³Hammond, 12 June: 30.4 µg/m³, 3.8× its usual 8.1Hammond, 13 June: 29.2 µg/m³, 3.4× its usual 8.6Hammond, 14 June: 18.6 µg/m³Hammond, 15 June: 13.4 µg/m³Hammond, 16 June: 15.3 µg/m³Hammond, 17 June: 7.0 µg/m³RockfordRockford, 7 June: 29.6 µg/m³Rockford, 8 June: 25.5 µg/m³Rockford, 9 June: 16.8 µg/m³Rockford, 10 June: 19.2 µg/m³Rockford, 11 June: 23.2 µg/m³Rockford, 12 June: 30.2 µg/m³, 4.3× its usual 7.1Rockford, 13 June: 21.3 µg/m³Rockford, 14 June: 17.8 µg/m³Rockford, 15 June: 13.6 µg/m³Rockford, 16 June: 12.8 µg/m³Rockford, 17 June: 5.1 µg/m³IndianapolisIndianapolis, 7 June: 19.0 µg/m³Indianapolis, 8 June: 16.2 µg/m³Indianapolis, 9 June: 16.7 µg/m³Indianapolis, 10 June: 17.7 µg/m³Indianapolis, 11 June: 24.6 µg/m³Indianapolis, 12 June: 30.2 µg/m³, 3.4× its usual 8.9Indianapolis, 13 June: 21.8 µg/m³Indianapolis, 14 June: 5.2 µg/m³Indianapolis, 15 June: 11.1 µg/m³Indianapolis, 16 June: 10.6 µg/m³Indianapolis, 17 June: 7.3 µg/m³AltoonaAltoona, 7 June: 19.7 µg/m³Altoona, 8 June: 34.6 µg/m³Altoona, 9 June: 12.5 µg/m³Altoona, 10 June: 15.6 µg/m³Altoona, 11 June: 18.8 µg/m³Altoona, 12 June: 25.6 µg/m³, 4.1× its usual 6.2Altoona, 13 June: 29.6 µg/m³, 4.7× its usual 6.3Altoona, 14 June: 24.2 µg/m³Altoona, 15 June: 9.2 µg/m³Altoona, 16 June: 3.6 µg/m³Altoona, 17 June: 3.8 µg/m³JolietJoliet, 7 June: 33.2 µg/m³Joliet, 8 June: 24.2 µg/m³Joliet, 9 June: 19.9 µg/m³Joliet, 10 June: 18.0 µg/m³Joliet, 11 June: 24.0 µg/m³Joliet, 12 June: 29.2 µg/m³, 3.7× its usual 7.9Joliet, 13 June: 28.2 µg/m³, 3.5× its usual 8.0Joliet, 14 June: 19.5 µg/m³Joliet, 15 June: 13.7 µg/m³Joliet, 16 June: 13.8 µg/m³Joliet, 17 June: 8.3 µg/m³NapervilleNaperville, 7 June: 33.0 µg/m³Naperville, 8 June: 23.6 µg/m³Naperville, 9 June: 18.8 µg/m³Naperville, 10 June: 18.7 µg/m³Naperville, 11 June: 24.2 µg/m³Naperville, 12 June: 28.9 µg/m³, 3.6× its usual 8.0Naperville, 13 June: 29.2 µg/m³, 3.5× its usual 8.3Naperville, 14 June: 19.3 µg/m³Naperville, 15 June: 14.8 µg/m³Naperville, 16 June: 15.6 µg/m³Naperville, 17 June: 9.0 µg/m³Oak LawnOak Lawn, 7 June: 26.4 µg/m³Oak Lawn, 8 June: 23.8 µg/m³Oak Lawn, 9 June: 17.7 µg/m³Oak Lawn, 10 June: 16.8 µg/m³Oak Lawn, 11 June: 21.5 µg/m³Oak Lawn, 12 June: 27.5 µg/m³, 3.4× its usual 8.0Oak Lawn, 13 June: 29.0 µg/m³, 3.5× its usual 8.4Oak Lawn, 14 June: 16.3 µg/m³Oak Lawn, 15 June: 11.8 µg/m³Oak Lawn, 16 June: 15.4 µg/m³Oak Lawn, 17 June: 8.5 µg/m³West MifflinWest Mifflin, 7 June: 21.4 µg/m³West Mifflin, 8 June: 26.3 µg/m³West Mifflin, 9 June: 12.6 µg/m³West Mifflin, 10 June: 12.4 µg/m³West Mifflin, 11 June: 19.5 µg/m³West Mifflin, 12 June: 26.1 µg/m³, 2.5× its usual 10.3West Mifflin, 13 June: 28.9 µg/m³, 2.8× its usual 10.4West Mifflin, 14 June: 13.2 µg/m³West Mifflin, 15 June: 7.8 µg/m³West Mifflin, 16 June: 4.1 µg/m³West Mifflin, 17 June: 6.7 µg/m³DecaturDecatur, 7 June: 25.5 µg/m³Decatur, 8 June: 16.4 µg/m³Decatur, 9 June: 17.5 µg/m³Decatur, 10 June: 11.6 µg/m³Decatur, 11 June: 21.6 µg/m³Decatur, 12 June: 28.8 µg/m³, 3.9× its usual 7.4Decatur, 13 June: 15.8 µg/m³Decatur, 14 June: 8.3 µg/m³Decatur, 15 June: 8.2 µg/m³Decatur, 16 June: 7.2 µg/m³Decatur, 17 June: 5.8 µg/m³SteubenvilleSteubenville, 7 June: 33.5 µg/m³Steubenville, 8 June: 29.4 µg/m³Steubenville, 9 June: 13.6 µg/m³Steubenville, 10 June: 12.8 µg/m³Steubenville, 11 June: 18.0 µg/m³Steubenville, 12 June: 26.1 µg/m³, 2.8× its usual 9.2Steubenville, 13 June: 28.4 µg/m³, 3.1× its usual 9.2Steubenville, 14 June: 13.0 µg/m³Steubenville, 15 June: 7.9 µg/m³Steubenville, 16 June: 8.1 µg/m³Steubenville, 17 June: 7.6 µg/m³Michigan CityMichigan City, 7 June: 29.2 µg/m³Michigan City, 8 June: 24.3 µg/m³Michigan City, 9 June: 18.4 µg/m³Michigan City, 10 June: 16.9 µg/m³Michigan City, 11 June: 20.7 µg/m³Michigan City, 12 June: 28.2 µg/m³, 4.5× its usual 6.2Michigan City, 13 June: 25.9 µg/m³, 4.0× its usual 6.4Michigan City, 14 June: 14.8 µg/m³Michigan City, 15 June: 11.1 µg/m³Michigan City, 16 June: 13.5 µg/m³Michigan City, 17 June: 8.8 µg/m³South BendSouth Bend, 7 June: 37.4 µg/m³South Bend, 8 June: 22.6 µg/m³South Bend, 9 June: 19.2 µg/m³South Bend, 10 June: 16.0 µg/m³South Bend, 11 June: 19.3 µg/m³South Bend, 12 June: 28.2 µg/m³, 3.9× its usual 7.3South Bend, 13 June: 22.3 µg/m³South Bend, 14 June: 16.6 µg/m³South Bend, 15 June: 13.9 µg/m³South Bend, 16 June: 13.7 µg/m³South Bend, 17 June: 8.9 µg/m³BostonBoston, 7 June: 14.8 µg/m³Boston, 8 June: 34.1 µg/m³Boston, 9 June: 26.5 µg/m³Boston, 10 June: 10.3 µg/m³Boston, 11 June: 14.4 µg/m³Boston, 12 June: 28.0 µg/m³, 4.5× its usual 6.2Boston, 13 June: 11.5 µg/m³Boston, 14 June: 9.7 µg/m³Boston, 15 June: 5.5 µg/m³Boston, 16 June: 6.7 µg/m³Boston, 17 June: 5.9 µg/m³WilmingtonWilmington, 7 June: 6.8 µg/m³Wilmington, 8 June: 4.7 µg/m³Wilmington, 9 June: 4.9 µg/m³Wilmington, 10 June: 7.7 µg/m³Wilmington, 11 June: 14.3 µg/m³Wilmington, 12 June: 20.5 µg/m³Wilmington, 13 June: 35.3 µg/m³, 4.9× its usual 7.2Wilmington, 14 June: 70.9 µg/m³, 9.8× its usual 7.2Wilmington, 15 June: 5.3 µg/m³Wilmington, 16 June: 5.9 µg/m³Wilmington, 17 June: 4.6 µg/m³SewellSewell, 7 June: 11.2 µg/m³Sewell, 8 June: 4.8 µg/m³Sewell, 9 June: 5.0 µg/m³Sewell, 10 June: 7.6 µg/m³Sewell, 11 June: 10.7 µg/m³Sewell, 12 June: 16.7 µg/m³Sewell, 13 June: 25.8 µg/m³, 3.6× its usual 7.2Sewell, 14 June: 57.4 µg/m³, 7.9× its usual 7.3Sewell, 15 June: 5.2 µg/m³Sewell, 16 June: 6.7 µg/m³Sewell, 17 June: 6.5 µg/m³PhiladelphiaPhiladelphia, 7 June: 8.1 µg/m³Philadelphia, 8 June: 5.4 µg/m³Philadelphia, 9 June: 5.7 µg/m³Philadelphia, 10 June: 8.4 µg/m³Philadelphia, 11 June: 15.1 µg/m³Philadelphia, 12 June: 22.7 µg/m³Philadelphia, 13 June: 26.9 µg/m³, 2.9× its usual 9.3Philadelphia, 14 June: 31.9 µg/m³, 3.4× its usual 9.5Philadelphia, 15 June: 6.5 µg/m³Philadelphia, 16 June: 7.7 µg/m³Philadelphia, 17 June: 8.4 µg/m³YorkYork, 7 June: 13.0 µg/m³York, 8 June: 19.4 µg/m³York, 9 June: 8.1 µg/m³York, 10 June: 9.9 µg/m³York, 11 June: 15.9 µg/m³York, 12 June: 19.7 µg/m³York, 13 June: 25.0 µg/m³, 3.2× its usual 7.8York, 14 June: 29.1 µg/m³, 3.6× its usual 8.1York, 15 June: 4.9 µg/m³York, 16 June: 4.4 µg/m³York, 17 June: 4.2 µg/m³CarlisleCarlisle, 7 June: 17.7 µg/m³Carlisle, 8 June: 23.6 µg/m³Carlisle, 9 June: 8.7 µg/m³Carlisle, 10 June: 11.1 µg/m³Carlisle, 11 June: 14.9 µg/m³Carlisle, 12 June: 18.1 µg/m³Carlisle, 13 June: 25.5 µg/m³, 3.7× its usual 6.9Carlisle, 14 June: 28.9 µg/m³, 4.1× its usual 7.0Carlisle, 15 June: 4.5 µg/m³Carlisle, 16 June: 3.6 µg/m³Carlisle, 17 June: 4.8 µg/m³WestervilleWesterville, 7 June: 34.6 µg/m³Westerville, 8 June: 33.1 µg/m³Westerville, 9 June: 11.9 µg/m³Westerville, 10 June: 13.2 µg/m³Westerville, 11 June: 15.9 µg/m³Westerville, 12 June: 23.8 µg/m³Westerville, 13 June: 28.3 µg/m³, 3.5× its usual 8.1Westerville, 14 June: 12.3 µg/m³Westerville, 15 June: 8.8 µg/m³Westerville, 16 June: 9.5 µg/m³Westerville, 17 June: 6.4 µg/m³LancasterLancaster, 7 June: 11.4 µg/m³Lancaster, 8 June: 12.3 µg/m³Lancaster, 9 June: 5.8 µg/m³Lancaster, 10 June: 9.6 µg/m³Lancaster, 11 June: 14.9 µg/m³Lancaster, 12 June: 17.7 µg/m³Lancaster, 13 June: 28.1 µg/m³, 3.7× its usual 7.6Lancaster, 14 June: 26.0 µg/m³, 3.3× its usual 7.9Lancaster, 15 June: 4.0 µg/m³Lancaster, 16 June: 6.0 µg/m³Lancaster, 17 June: 5.7 µg/m³PittsburghPittsburgh, 7 June: 25.9 µg/m³Pittsburgh, 8 June: 30.1 µg/m³Pittsburgh, 9 June: 11.0 µg/m³Pittsburgh, 10 June: 11.7 µg/m³Pittsburgh, 11 June: 15.5 µg/m³Pittsburgh, 12 June: 23.9 µg/m³Pittsburgh, 13 June: 28.0 µg/m³, 3.2× its usual 8.7Pittsburgh, 14 June: 12.8 µg/m³Pittsburgh, 15 June: 8.7 µg/m³Pittsburgh, 16 June: 4.8 µg/m³Pittsburgh, 17 June: 6.2 µg/m³ChesterChester, 7 June: 6.3 µg/m³Chester, 8 June: 4.4 µg/m³Chester, 9 June: 4.4 µg/m³Chester, 10 June: 7.2 µg/m³Chester, 11 June: 13.2 µg/m³Chester, 12 June: no readingChester, 13 June: no readingChester, 14 June: 55.8 µg/m³, 7.7× its usual 7.2Chester, 15 June: 4.9 µg/m³Chester, 16 June: 5.8 µg/m³Chester, 17 June: 5.3 µg/m³South VinelandSouth Vineland, 7 June: 5.6 µg/m³South Vineland, 8 June: 4.9 µg/m³South Vineland, 9 June: 3.9 µg/m³South Vineland, 10 June: 8.4 µg/m³South Vineland, 11 June: 12.4 µg/m³South Vineland, 12 June: 17.7 µg/m³South Vineland, 13 June: 19.7 µg/m³South Vineland, 14 June: 45.2 µg/m³, 6.3× its usual 7.2South Vineland, 15 June: 8.0 µg/m³South Vineland, 16 June: 7.2 µg/m³South Vineland, 17 June: 4.4 µg/m³DoverDover, 7 June: 5.8 µg/m³Dover, 8 June: 5.1 µg/m³Dover, 9 June: 5.2 µg/m³Dover, 10 June: 8.0 µg/m³Dover, 11 June: 14.6 µg/m³Dover, 12 June: 20.1 µg/m³Dover, 13 June: 21.1 µg/m³Dover, 14 June: 44.5 µg/m³, 5.6× its usual 7.9Dover, 15 June: 8.3 µg/m³Dover, 16 June: 6.7 µg/m³Dover, 17 June: 4.4 µg/m³NewarkNewark, 7 June: 8.3 µg/m³Newark, 8 June: 5.2 µg/m³Newark, 9 June: 4.1 µg/m³Newark, 10 June: 7.1 µg/m³Newark, 11 June: 13.0 µg/m³Newark, 12 June: 19.0 µg/m³Newark, 13 June: 22.5 µg/m³Newark, 14 June: 44.3 µg/m³, 5.5× its usual 8.0Newark, 15 June: 5.5 µg/m³Newark, 16 June: 6.1 µg/m³Newark, 17 June: 5.6 µg/m³EdgewoodEdgewood, 7 June: 4.4 µg/m³Edgewood, 8 June: 5.4 µg/m³Edgewood, 9 June: 6.9 µg/m³Edgewood, 10 June: 7.3 µg/m³Edgewood, 11 June: 11.3 µg/m³Edgewood, 12 June: 16.4 µg/m³Edgewood, 13 June: 19.9 µg/m³Edgewood, 14 June: 43.8 µg/m³, 6.3× its usual 6.9Edgewood, 15 June: 7.9 µg/m³Edgewood, 16 June: no readingEdgewood, 17 June: no readingBearBear, 7 June: 5.6 µg/m³Bear, 8 June: 4.6 µg/m³Bear, 9 June: 4.3 µg/m³Bear, 10 June: 6.9 µg/m³Bear, 11 June: 13.1 µg/m³Bear, 12 June: 18.0 µg/m³Bear, 13 June: 21.9 µg/m³Bear, 14 June: 43.4 µg/m³, 6.1× its usual 7.1Bear, 15 June: 9.5 µg/m³Bear, 16 June: 7.2 µg/m³Bear, 17 June: 5.1 µg/m³ElktonElkton, 7 June: 6.3 µg/m³Elkton, 8 June: 4.3 µg/m³Elkton, 9 June: 4.9 µg/m³Elkton, 10 June: 6.7 µg/m³Elkton, 11 June: 13.2 µg/m³Elkton, 12 June: 17.6 µg/m³Elkton, 13 June: 21.9 µg/m³Elkton, 14 June: 41.5 µg/m³, 6.6× its usual 6.3Elkton, 15 June: 8.8 µg/m³Elkton, 16 June: 6.3 µg/m³Elkton, 17 June: 5.4 µg/m³Hunt ValleyHunt Valley, 7 June: 6.0 µg/m³Hunt Valley, 8 June: 7.0 µg/m³Hunt Valley, 9 June: 7.3 µg/m³Hunt Valley, 10 June: 7.3 µg/m³Hunt Valley, 11 June: 12.4 µg/m³Hunt Valley, 12 June: 15.8 µg/m³Hunt Valley, 13 June: 18.5 µg/m³Hunt Valley, 14 June: 35.1 µg/m³, 4.6× its usual 7.7Hunt Valley, 15 June: 5.9 µg/m³Hunt Valley, 16 June: 2.7 µg/m³Hunt Valley, 17 June: 1.9 µg/m³EssexEssex, 7 June: 6.4 µg/m³Essex, 8 June: 8.8 µg/m³Essex, 9 June: 6.4 µg/m³Essex, 10 June: 9.5 µg/m³Essex, 11 June: 14.8 µg/m³Essex, 12 June: 19.8 µg/m³Essex, 13 June: 20.3 µg/m³Essex, 14 June: 30.9 µg/m³, 4.8× its usual 6.4Essex, 15 June: 9.5 µg/m³Essex, 16 June: 5.2 µg/m³Essex, 17 June: 4.4 µg/m³7 Jun911131517
The 60 cities with the highest readings of 104, in the order the episode reached them, 3 days before to 3 after. Each square is a day, coloured by that day's PM2.5; outlined: at twice the city's usual or more.
Good0–50
Moderate51–100
Sensitive groups101–150
Unhealthy151–200
Very unhealthy201–300
Hazardous301+

Every city it reached

CityDaysHighestUsualAbove usual
DuluthMinnesota, United States2 51.311 June5.010×
WilmingtonDelaware, United States2 70.914 June7.29.8×
Apple ValleyMinnesota, United States3 46.112 June5.78.1×
SewellNew Jersey, United States2 57.414 June7.37.9×
ChesterPennsylvania, United States1 55.814 June7.27.7×
Eau ClaireWisconsin, United States3 41.512 June5.67.4×
ShakopeeMinnesota, United States3 43.812 June6.07.3×
BlaineMinnesota, United States3 40.312 June5.57.3×
BurnsvilleMinnesota, United States3 44.812 June6.37.1×
West FargoNorth Dakota, United States2 44.911 June6.56.9×
MankatoMinnesota, United States2 40.612 June5.96.9×
Saint MichaelMinnesota, United States3 39.412 June5.86.8×
BrookingsSouth Dakota, United States2 36.112 June5.36.8×
MinneapolisMinnesota, United States3 43.712 June6.56.7×
ElktonMaryland, United States1 41.514 June6.36.6×
South VinelandNew Jersey, United States1 45.214 June7.26.3×
EdgewoodMaryland, United States1 43.814 June6.96.3×
Green BayWisconsin, United States1 34.911 June5.56.3×
SuperiorWisconsin, United States1 40.611 June6.66.2×
Saint PaulMinnesota, United States3 38.412 June6.26.2×
BearDelaware, United States1 43.414 June7.16.1×
RochesterMinnesota, United States3 42.012 June6.96.1×
OconomowocWisconsin, United States3 41.812 June6.86.1×
MadisonWisconsin, United States2 33.412 June5.75.9×
ChampaignIllinois, United States1 33.812 June5.85.8×
AppletonWisconsin, United States2 31.911 June5.55.8×
DoverDelaware, United States1 44.514 June7.95.6×
NewarkDelaware, United States1 44.314 June8.05.5×
Saint CloudMinnesota, United States3 29.111 June5.55.3×
AberdeenSouth Dakota, United States1 26.511 June3.75.3×
FraminghamMassachusetts, United States1 25.412 June4.95.1×
HagerstownMaryland, United States1 26.614 June5.44.9×
EssexMaryland, United States1 30.914 June6.44.8×
KeeneNew Hampshire, United States1 25.112 June5.24.8×
AltoonaPennsylvania, United States2 29.613 June6.34.7×
Hunt ValleyMaryland, United States1 35.114 June7.74.6×
WatertownSouth Dakota, United States1 29.511 June6.44.6×
PittsfieldMassachusetts, United States1 25.512 June5.64.6×
WorcesterMassachusetts, United States1 25.212 June5.54.6×
Michigan CityIndiana, United States2 28.212 June6.24.5×
BostonMassachusetts, United States1 28.012 June6.24.5×
AuroraIllinois, United States2 26.712 June6.04.5×
ColumbiaMissouri, United States2 29.411 June6.74.4×
WaukeshaWisconsin, United States2 28.012 June6.44.4×
MuncieIndiana, United States1 27.212 June6.24.4×
WheelingWest Virginia, United States2 34.513 June8.14.3×
RockfordIllinois, United States1 30.212 June7.14.3×
Upper AltonIllinois, United States2 27.412 June6.44.3×
CarlislePennsylvania, United States2 28.914 June7.04.1×
BloomingtonIllinois, United States1 25.312 June6.24.1×
PeoriaIllinois, United States2 27.212 June6.84.0×
DecaturIllinois, United States1 28.812 June7.43.9×
Grand RapidsMichigan, United States2 28.412 June7.33.9×
South BendIndiana, United States1 28.212 June7.33.9×
Des PlainesIllinois, United States1 27.912 June7.23.9×
WeirtonWest Virginia, United States1 25.913 June6.73.9×
AndersonIndiana, United States1 25.812 June6.63.9×
BridgeviewIllinois, United States2 32.313 June8.63.8×
HammondIndiana, United States2 30.412 June8.13.8×
ElginIllinois, United States1 27.012 June7.13.8×
BrookfieldIllinois, United States1 26.913 June7.03.8×
Elmwood ParkIllinois, United States1 26.812 June7.13.8×
AlbanyNew York, United States1 25.312 June6.73.8×
JenisonMichigan, United States1 25.212 June6.73.8×
JolietIllinois, United States2 29.212 June7.93.7×
LancasterPennsylvania, United States2 28.113 June7.63.7×
WindsorOntario, Canada2 27.412 June7.53.7×
CaryIllinois, United States1 27.312 June7.43.7×
LansingMichigan, United States2 26.812 June7.23.7×
SpringfieldIllinois, United States1 26.812 June7.33.7×
Franklin ParkIllinois, United States3 30.312 June8.53.6×
KalamazooMichigan, United States2 29.812 June8.23.6×
YorkPennsylvania, United States2 29.114 June8.13.6×
MilwaukeeWisconsin, United States1 27.011 June7.53.6×
PerrysburgOhio, United States1 26.412 June7.33.6×
St. ThomasOntario, Canada1 25.912 June7.13.6×
NapervilleIllinois, United States2 29.213 June8.33.5×
Oak LawnIllinois, United States2 29.013 June8.43.5×
WestervilleOhio, United States1 28.313 June8.13.5×
ColumbusOhio, United States1 26.913 June7.73.5×
East ChicagoIndiana, United States1 25.912 June7.33.5×
PhiladelphiaPennsylvania, United States2 31.914 June9.53.4×
IndianapolisIndiana, United States1 30.212 June8.93.4×
DoltonIllinois, United States3 29.112 June8.53.4×
ChicagoIllinois, United States2 27.812 June8.13.4×
LebanonPennsylvania, United States1 27.113 June8.03.4×
Calumet CityIllinois, United States2 26.812 June8.03.4×
HarrisburgPennsylvania, United States1 26.613 June7.93.4×
FishersIndiana, United States1 25.612 June7.53.4×
DaytonOhio, United States1 26.913 June8.13.3×
OregonOhio, United States1 26.312 June7.93.3×
PaducahKentucky, United States1 25.811 June7.83.3×
YoungstownOhio, United States1 25.513 June7.83.3×
McKeesportPennsylvania, United States1 25.313 June7.73.3×
PittsburghPennsylvania, United States1 28.013 June8.73.2×
SpringfieldOhio, United States1 27.013 June8.53.2×
SteubenvilleOhio, United States2 28.413 June9.23.1×
East Saint LouisIllinois, United States2 26.712 June8.53.1×
WilkinsburgPennsylvania, United States1 25.513 June8.13.1×
Terre HauteIndiana, United States1 31.412 June10.33.0×
Granite CityIllinois, United States2 27.211 June9.03.0×
GaryIndiana, United States1 25.612 June8.63.0×
West MifflinPennsylvania, United States2 28.913 June10.42.8×
WyomingMichigan, United States1 25.112 June10.22.5×

Daily means in µg/m³, over the days each city counted in this episode. Highest: its highest of those days. Usual: the city's median for the time of year of that day (its days within 21 days of the date, every year, leaving out the week around it). Above usual: its highest day against that, with a usual under 5 µg/m³ taken as 5.

Against other episodes in the United States and Canada

Number 10 of 141 episodes in the United States and Canada since our records began, by cities reached.

Bars: cities reached; colour: the level of the episode's highest daily reading. All 141.

Use this page

SmogRank, North-eastern United States and Canada, 10 to 14 June 2025: 104 cities with PM2.5 at twice their usual or more, 10 to 14 June 2025, smogrank.com/episodes/2025-06-10-north-eastern-united-states-and-canada (accessed 4 October 2026).
Download top 10 (PNG)

You're welcome to reuse a single chart, image or figure with this citation and a link. Terms.

An episode is a run of days when many cities close to each other (four or more within 350 km on a day, 8 or more in all) each had a daily PM2.5 mean of at least 25 µg/m³ and at least 2 times their usual for that time of year. Found in our own measurements, not picked by hand. How we find episodes. Values are each city's daily mean of its own monitors; causes are the usual kinds for a pattern like this, not a confirmed source.