SmogRank / Episodes / United States

North-western United States and Canada, August 2023

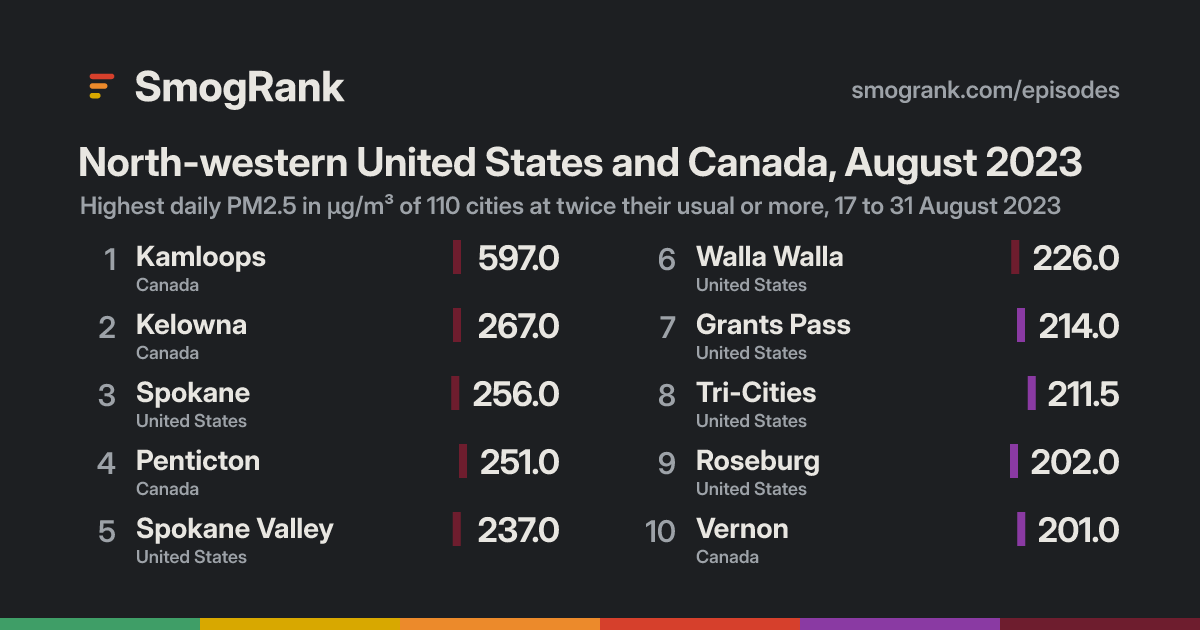
For 17 days, from 15 to 31 August 2023, 176 cities in the United States and Canada had PM2.5 at least twice their usual for the time of year. The worst reading was Kamloops, British Columbia, Canada: 597.0 µg/m³ on 21 August, about 55× its usual 10.9. Ended 31 August.

Likely smoke from firesFires were detected within 300 km of the city on 89% of the counted city-days and smoke was mapped over the city on 91%. Satellites see crop, field and forest fires alike, so this doesn't say which burned.
Cities reached176in 2 countries
Days1715 to 31 August 2023
Worst day20 August103 cities counted
Furthest above usual55×Kamloops

Day by day

20 August 103 cities at twice their usual or more

On the map: 4,878 fire detections, smoke traced by NOAA.

12 Aug1518212427301 Sep23
Every measured city in the area, coloured by its PM2.5 that day; a dark ring marks a city at twice its usual or more. Bars: cities counted each day, coloured by their median level. Choose a day or press play; without JavaScript, the days link to that day's world ranking.
  • Fires, seenHeat satellites detected that day (via NASA FIRMS); bigger and glowing means more detections in the area. Farm burning and other fires count too, not only wildfires.
  • Smoke, tracedOutlined by NOAA analysts from satellite images, light to heavy. Traced for North America only; it can be high above the ground.

Under the cities, for each UTC day: fires satellites detected (via NASA FIRMS), smoke NOAA analysts traced and volcanic ash warnings for aircraft. They show what was in the air, not that it caused the readings.

Fires: NASA FIRMS (VIIRS). Traced smoke: NOAA Hazard Mapping System. Volcanic ash: aviation ash warnings (SIGMETs) via NOAA's Aviation Weather Center.

How it spread

RedmondRedmond, 12 August: 11.1 µg/m³Redmond, 13 August: 5.6 µg/m³Redmond, 14 August: 8.5 µg/m³Redmond, 15 August: 80.7 µg/m³, 6.3× its usual 12.8Redmond, 16 August: 143.0 µg/m³, 12× its usual 12.3Redmond, 17 August: 50.3 µg/m³, 4.2× its usual 12.1Redmond, 18 August: 105.0 µg/m³, 8.7× its usual 12.1Redmond, 19 August: 50.2 µg/m³, 4.1× its usual 12.1Redmond, 20 August: 155.0 µg/m³, 14× its usual 11.4Redmond, 21 August: 157.0 µg/m³, 14× its usual 11.2Redmond, 22 August: 145.0 µg/m³, 13× its usual 10.8Redmond, 23 August: 63.5 µg/m³, 6.1× its usual 10.4Redmond, 24 August: 19.4 µg/m³Redmond, 25 August: 15.4 µg/m³Redmond, 26 August: 15.6 µg/m³Redmond, 27 August: 38.5 µg/m³, 4.0× its usual 9.7Redmond, 28 August: 119.0 µg/m³, 13× its usual 8.9Redmond, 29 August: 58.1 µg/m³, 6.8× its usual 8.5Redmond, 30 August: 27.7 µg/m³, 3.3× its usual 8.4Redmond, 31 August: 33.7 µg/m³, 4.2× its usual 8.0Redmond, 1 September: 13.5 µg/m³Redmond, 2 September: 6.9 µg/m³Redmond, 3 September: 7.9 µg/m³BendBend, 12 August: 20.5 µg/m³Bend, 13 August: 3.9 µg/m³Bend, 14 August: 6.0 µg/m³Bend, 15 August: 31.3 µg/m³, 3.3× its usual 9.4Bend, 16 August: 109.5 µg/m³, 13× its usual 8.7Bend, 17 August: 47.6 µg/m³, 5.5× its usual 8.7Bend, 18 August: 102.0 µg/m³, 12× its usual 8.7Bend, 19 August: 39.2 µg/m³, 4.6× its usual 8.6Bend, 20 August: 116.5 µg/m³, 14× its usual 8.4Bend, 21 August: 107.5 µg/m³, 13× its usual 8.4Bend, 22 August: 47.1 µg/m³, 5.7× its usual 8.2Bend, 23 August: 39.9 µg/m³, 4.9× its usual 8.2Bend, 24 August: 18.3 µg/m³Bend, 25 August: 10.0 µg/m³Bend, 26 August: 19.1 µg/m³Bend, 27 August: 85.7 µg/m³, 11× its usual 7.6Bend, 28 August: 154.5 µg/m³, 21× its usual 7.5Bend, 29 August: 57.8 µg/m³, 7.6× its usual 7.6Bend, 30 August: 29.0 µg/m³, 3.9× its usual 7.5Bend, 31 August: 43.0 µg/m³, 5.8× its usual 7.4Bend, 1 September: 9.9 µg/m³Bend, 2 September: 4.0 µg/m³Bend, 3 September: 5.1 µg/m³PrinevillePrineville, 12 August: 2.2 µg/m³Prineville, 13 August: 4.1 µg/m³Prineville, 14 August: 6.6 µg/m³Prineville, 15 August: 57.4 µg/m³, 5.0× its usual 11.4Prineville, 16 August: 75.5 µg/m³, 6.9× its usual 11.0Prineville, 17 August: 41.4 µg/m³, 3.8× its usual 11.0Prineville, 18 August: 66.9 µg/m³, 6.1× its usual 10.9Prineville, 19 August: 28.3 µg/m³, 2.6× its usual 10.7Prineville, 20 August: 85.6 µg/m³, 8.8× its usual 9.7Prineville, 21 August: 38.1 µg/m³, 3.9× its usual 9.7Prineville, 22 August: no readingPrineville, 23 August: no readingPrineville, 24 August: no readingPrineville, 25 August: 9.2 µg/m³Prineville, 26 August: 10.9 µg/m³Prineville, 27 August: 16.1 µg/m³Prineville, 28 August: 48.0 µg/m³, 7.1× its usual 6.8Prineville, 29 August: 16.4 µg/m³Prineville, 30 August: 22.5 µg/m³Prineville, 31 August: 9.4 µg/m³Prineville, 1 September: 10.7 µg/m³Prineville, 2 September: 5.3 µg/m³Prineville, 3 September: 3.7 µg/m³EugeneEugene, 12 August: 2.5 µg/m³Eugene, 13 August: 3.9 µg/m³Eugene, 14 August: 12.8 µg/m³Eugene, 15 August: 59.6 µg/m³, 12× its usual 5.0Eugene, 16 August: 21.2 µg/m³Eugene, 17 August: 11.2 µg/m³Eugene, 18 August: 4.9 µg/m³Eugene, 19 August: 5.4 µg/m³Eugene, 20 August: 53.6 µg/m³, 9.9× its usual 5.4Eugene, 21 August: 27.2 µg/m³, 5.0× its usual 5.4Eugene, 22 August: 3.4 µg/m³Eugene, 23 August: 7.5 µg/m³Eugene, 24 August: 21.6 µg/m³Eugene, 25 August: 58.7 µg/m³, 11× its usual 5.4Eugene, 26 August: 34.2 µg/m³, 6.3× its usual 5.4Eugene, 27 August: 24.1 µg/m³Eugene, 28 August: 20.9 µg/m³Eugene, 29 August: 11.6 µg/m³Eugene, 30 August: 8.3 µg/m³Eugene, 31 August: 16.5 µg/m³Eugene, 1 September: 10.3 µg/m³Eugene, 2 September: 15.0 µg/m³Eugene, 3 September: 5.5 µg/m³EphrataEphrata, 12 August: 5.8 µg/m³Ephrata, 13 August: 5.1 µg/m³Ephrata, 14 August: 6.3 µg/m³Ephrata, 15 August: 9.7 µg/m³Ephrata, 16 August: 37.5 µg/m³, 4.6× its usual 8.2Ephrata, 17 August: 44.1 µg/m³, 5.4× its usual 8.2Ephrata, 18 August: 9.3 µg/m³Ephrata, 19 August: 128.0 µg/m³, 16× its usual 8.0Ephrata, 20 August: 224.0 µg/m³, 29× its usual 7.8Ephrata, 21 August: 158.0 µg/m³, 20× its usual 7.8Ephrata, 22 August: 50.6 µg/m³, 6.6× its usual 7.7Ephrata, 23 August: 15.6 µg/m³Ephrata, 24 August: 12.3 µg/m³Ephrata, 25 August: 16.8 µg/m³Ephrata, 26 August: 14.1 µg/m³Ephrata, 27 August: 14.0 µg/m³Ephrata, 28 August: 14.9 µg/m³Ephrata, 29 August: 32.9 µg/m³Ephrata, 30 August: 9.8 µg/m³Ephrata, 31 August: 8.3 µg/m³Ephrata, 1 September: 7.7 µg/m³Ephrata, 2 September: 8.4 µg/m³Ephrata, 3 September: 7.8 µg/m³MadrasMadras, 12 August: 4.1 µg/m³Madras, 13 August: 5.5 µg/m³Madras, 14 August: 8.0 µg/m³Madras, 15 August: 16.9 µg/m³Madras, 16 August: 55.6 µg/m³, 5.1× its usual 10.9Madras, 17 August: 28.0 µg/m³, 2.6× its usual 10.8Madras, 18 August: 11.3 µg/m³Madras, 19 August: 48.9 µg/m³, 4.9× its usual 10.0Madras, 20 August: 161.0 µg/m³, 18× its usual 9.1Madras, 21 August: 145.0 µg/m³, 16× its usual 8.9Madras, 22 August: 51.3 µg/m³, 5.8× its usual 8.9Madras, 23 August: 26.2 µg/m³, 3.0× its usual 8.7Madras, 24 August: 12.4 µg/m³Madras, 25 August: 16.6 µg/m³Madras, 26 August: 16.2 µg/m³Madras, 27 August: 25.1 µg/m³, 3.1× its usual 8.0Madras, 28 August: 58.8 µg/m³, 7.4× its usual 7.9Madras, 29 August: 14.5 µg/m³Madras, 30 August: 6.0 µg/m³Madras, 31 August: 13.6 µg/m³Madras, 1 September: 9.2 µg/m³Madras, 2 September: 7.6 µg/m³Madras, 3 September: 5.5 µg/m³CrestonCreston, 12 August: 5.3 µg/m³Creston, 13 August: 6.0 µg/m³Creston, 14 August: 6.1 µg/m³Creston, 15 August: 6.6 µg/m³Creston, 16 August: 43.2 µg/m³, 6.1× its usual 7.1Creston, 17 August: 67.8 µg/m³, 9.4× its usual 7.2Creston, 18 August: 21.1 µg/m³Creston, 19 August: 142.0 µg/m³, 20× its usual 7.0Creston, 20 August: 68.5 µg/m³, 9.8× its usual 7.0Creston, 21 August: 48.1 µg/m³, 7.0× its usual 6.9Creston, 22 August: 21.5 µg/m³Creston, 23 August: 14.8 µg/m³Creston, 24 August: 7.1 µg/m³Creston, 25 August: 8.6 µg/m³Creston, 26 August: 9.6 µg/m³Creston, 27 August: 10.0 µg/m³Creston, 28 August: 12.5 µg/m³Creston, 29 August: 11.0 µg/m³Creston, 30 August: 5.8 µg/m³Creston, 31 August: 6.9 µg/m³Creston, 1 September: 5.7 µg/m³Creston, 2 September: 6.3 µg/m³Creston, 3 September: 6.4 µg/m³QuincyQuincy, 12 August: 4.0 µg/m³Quincy, 13 August: 4.9 µg/m³Quincy, 14 August: 5.5 µg/m³Quincy, 15 August: 6.6 µg/m³Quincy, 16 August: 35.4 µg/m³, 5.1× its usual 6.9Quincy, 17 August: 34.6 µg/m³, 4.9× its usual 7.0Quincy, 18 August: 5.2 µg/m³Quincy, 19 August: 102.0 µg/m³, 15× its usual 7.0Quincy, 20 August: 134.0 µg/m³, 19× its usual 6.9Quincy, 21 August: 125.0 µg/m³, 18× its usual 6.9Quincy, 22 August: 48.7 µg/m³, 7.1× its usual 6.9Quincy, 23 August: 9.6 µg/m³Quincy, 24 August: 15.9 µg/m³Quincy, 25 August: 17.1 µg/m³Quincy, 26 August: 12.5 µg/m³Quincy, 27 August: 13.7 µg/m³Quincy, 28 August: 15.1 µg/m³Quincy, 29 August: 15.2 µg/m³Quincy, 30 August: 5.1 µg/m³Quincy, 31 August: 4.2 µg/m³Quincy, 1 September: 6.8 µg/m³Quincy, 2 September: 7.7 µg/m³Quincy, 3 September: 6.4 µg/m³MoscowMoscow, 12 August: 5.8 µg/m³Moscow, 13 August: 7.6 µg/m³Moscow, 14 August: 8.4 µg/m³Moscow, 15 August: 10.3 µg/m³Moscow, 16 August: 26.3 µg/m³, 2.4× its usual 10.8Moscow, 17 August: 25.3 µg/m³, 2.4× its usual 10.7Moscow, 18 August: 9.3 µg/m³Moscow, 19 August: 45.3 µg/m³, 4.3× its usual 10.5Moscow, 20 August: 106.0 µg/m³, 10× its usual 10.3Moscow, 21 August: 6.2 µg/m³Moscow, 22 August: 25.6 µg/m³, 2.6× its usual 9.9Moscow, 23 August: 17.4 µg/m³Moscow, 24 August: 17.0 µg/m³Moscow, 25 August: 19.2 µg/m³Moscow, 26 August: 8.0 µg/m³Moscow, 27 August: 6.9 µg/m³Moscow, 28 August: 8.5 µg/m³Moscow, 29 August: 12.7 µg/m³Moscow, 30 August: 3.0 µg/m³Moscow, 31 August: 3.7 µg/m³Moscow, 1 September: 4.4 µg/m³Moscow, 2 September: 5.3 µg/m³Moscow, 3 September: 6.3 µg/m³AltamontAltamont, 12 August: 28.3 µg/m³Altamont, 13 August: 14.8 µg/m³Altamont, 14 August: 5.8 µg/m³Altamont, 15 August: 13.5 µg/m³Altamont, 16 August: 25.6 µg/m³, 3.8× its usual 6.8Altamont, 17 August: 9.2 µg/m³Altamont, 18 August: 39.7 µg/m³, 6.5× its usual 6.1Altamont, 19 August: 33.4 µg/m³, 5.6× its usual 6.0Altamont, 20 August: 15.2 µg/m³Altamont, 21 August: 4.3 µg/m³Altamont, 22 August: 35.0 µg/m³, 5.8× its usual 6.0Altamont, 23 August: 58.6 µg/m³, 9.8× its usual 6.0Altamont, 24 August: 30.2 µg/m³, 5.2× its usual 5.8Altamont, 25 August: 40.5 µg/m³, 7.1× its usual 5.7Altamont, 26 August: 12.8 µg/m³Altamont, 27 August: 20.5 µg/m³Altamont, 28 August: 63.2 µg/m³, 11× its usual 5.6Altamont, 29 August: 60.8 µg/m³, 11× its usual 5.5Altamont, 30 August: 13.3 µg/m³Altamont, 31 August: 24.4 µg/m³Altamont, 1 September: 23.5 µg/m³Altamont, 2 September: 3.9 µg/m³Altamont, 3 September: 4.2 µg/m³KamloopsKamloops, 12 August: 7.5 µg/m³Kamloops, 13 August: 7.5 µg/m³Kamloops, 14 August: 24.7 µg/m³Kamloops, 15 August: 36.9 µg/m³Kamloops, 16 August: no readingKamloops, 17 August: 81.9 µg/m³, 7.0× its usual 11.7Kamloops, 18 August: 54.9 µg/m³, 4.8× its usual 11.5Kamloops, 19 August: 12.2 µg/m³Kamloops, 20 August: 131.0 µg/m³, 12× its usual 11.2Kamloops, 21 August: 597.0 µg/m³, 55× its usual 10.9Kamloops, 22 August: 133.0 µg/m³, 12× its usual 10.8Kamloops, 23 August: 25.5 µg/m³Kamloops, 24 August: 32.7 µg/m³, 3.2× its usual 10.2Kamloops, 25 August: 31.6 µg/m³, 3.1× its usual 10.2Kamloops, 26 August: 30.4 µg/m³, 3.0× its usual 10.0Kamloops, 27 August: 34.4 µg/m³, 3.5× its usual 9.8Kamloops, 28 August: 54.8 µg/m³Kamloops, 29 August: 83.3 µg/m³Kamloops, 30 August: 18.7 µg/m³Kamloops, 31 August: 15.1 µg/m³Kamloops, 1 September: 13.2 µg/m³Kamloops, 2 September: 19.5 µg/m³Kamloops, 3 September: 53.5 µg/m³KelownaKelowna, 12 August: 4.7 µg/m³Kelowna, 13 August: 8.6 µg/m³Kelowna, 14 August: 15.6 µg/m³Kelowna, 15 August: no readingKelowna, 16 August: no readingKelowna, 17 August: 52.8 µg/m³, 5.8× its usual 9.1Kelowna, 18 August: 56.1 µg/m³, 6.2× its usual 9.1Kelowna, 19 August: 201.0 µg/m³, 22× its usual 9.0Kelowna, 20 August: 267.0 µg/m³, 30× its usual 8.9Kelowna, 21 August: 168.0 µg/m³, 19× its usual 8.9Kelowna, 22 August: 46.9 µg/m³, 5.3× its usual 8.9Kelowna, 23 August: 5.1 µg/m³Kelowna, 24 August: 15.2 µg/m³Kelowna, 25 August: 23.3 µg/m³Kelowna, 26 August: 31.4 µg/m³, 3.7× its usual 8.4Kelowna, 27 August: 25.7 µg/m³, 3.1× its usual 8.4Kelowna, 28 August: 31.1 µg/m³Kelowna, 29 August: 30.3 µg/m³Kelowna, 30 August: 7.2 µg/m³Kelowna, 31 August: 12.9 µg/m³Kelowna, 1 September: 20.5 µg/m³Kelowna, 2 September: 16.9 µg/m³Kelowna, 3 September: 8.1 µg/m³PentictonPenticton, 12 August: 2.9 µg/m³Penticton, 13 August: 5.0 µg/m³Penticton, 14 August: 10.6 µg/m³Penticton, 15 August: 23.6 µg/m³Penticton, 16 August: no readingPenticton, 17 August: 92.8 µg/m³, 13× its usual 7.2Penticton, 18 August: 39.5 µg/m³, 5.6× its usual 7.1Penticton, 19 August: 113.0 µg/m³, 16× its usual 7.1Penticton, 20 August: 251.0 µg/m³, 35× its usual 7.1Penticton, 21 August: 210.0 µg/m³, 30× its usual 6.9Penticton, 22 August: 82.9 µg/m³, 12× its usual 6.7Penticton, 23 August: 11.5 µg/m³Penticton, 24 August: 21.4 µg/m³Penticton, 25 August: 31.6 µg/m³, 4.6× its usual 6.8Penticton, 26 August: 28.0 µg/m³, 4.2× its usual 6.6Penticton, 27 August: 31.6 µg/m³, 4.9× its usual 6.5Penticton, 28 August: 39.0 µg/m³Penticton, 29 August: 32.8 µg/m³Penticton, 30 August: 4.5 µg/m³Penticton, 31 August: 11.3 µg/m³Penticton, 1 September: 17.9 µg/m³Penticton, 2 September: 14.7 µg/m³Penticton, 3 September: 7.0 µg/m³YrekaYreka, 12 August: 7.5 µg/m³Yreka, 13 August: 12.9 µg/m³Yreka, 14 August: 6.9 µg/m³Yreka, 15 August: 8.2 µg/m³Yreka, 16 August: 20.2 µg/m³Yreka, 17 August: 53.7 µg/m³, 8.8× its usual 6.1Yreka, 18 August: 99.3 µg/m³, 17× its usual 6.0Yreka, 19 August: 79.2 µg/m³, 13× its usual 5.9Yreka, 20 August: 45.0 µg/m³, 7.9× its usual 5.7Yreka, 21 August: 8.5 µg/m³Yreka, 22 August: 47.2 µg/m³, 8.3× its usual 5.7Yreka, 23 August: 85.8 µg/m³, 16× its usual 5.4Yreka, 24 August: 51.1 µg/m³, 10× its usual 5.0Yreka, 25 August: 64.3 µg/m³, 13× its usual 4.9Yreka, 26 August: 51.4 µg/m³, 10× its usual 4.9Yreka, 27 August: 126.0 µg/m³, 25× its usual 4.9Yreka, 28 August: 230.0 µg/m³, 46× its usual 4.9Yreka, 29 August: 144.0 µg/m³, 29× its usual 4.5Yreka, 30 August: 24.9 µg/m³Yreka, 31 August: 16.0 µg/m³Yreka, 1 September: 12.8 µg/m³Yreka, 2 September: 3.5 µg/m³Yreka, 3 September: 3.9 µg/m³Grants PassGrants Pass, 12 August: 15.7 µg/m³Grants Pass, 13 August: 7.0 µg/m³Grants Pass, 14 August: 11.1 µg/m³Grants Pass, 15 August: 11.7 µg/m³Grants Pass, 16 August: 16.1 µg/m³Grants Pass, 17 August: 50.5 µg/m³, 10× its usual 4.6Grants Pass, 18 August: 6.4 µg/m³Grants Pass, 19 August: 31.8 µg/m³, 6.4× its usual 4.7Grants Pass, 20 August: 56.1 µg/m³, 11× its usual 4.6Grants Pass, 21 August: 113.0 µg/m³, 23× its usual 4.7Grants Pass, 22 August: 46.6 µg/m³, 9.3× its usual 4.5Grants Pass, 23 August: 14.1 µg/m³Grants Pass, 24 August: 77.9 µg/m³, 16× its usual 4.3Grants Pass, 25 August: 175.0 µg/m³, 35× its usual 4.3Grants Pass, 26 August: 112.0 µg/m³, 22× its usual 4.2Grants Pass, 27 August: 214.0 µg/m³, 43× its usual 4.2Grants Pass, 28 August: 211.0 µg/m³, 42× its usual 4.2Grants Pass, 29 August: 39.1 µg/m³, 7.8× its usual 4.2Grants Pass, 30 August: 50.0 µg/m³, 10× its usual 4.2Grants Pass, 31 August: 63.2 µg/m³, 13× its usual 4.2Grants Pass, 1 September: 10.2 µg/m³Grants Pass, 2 September: 10.6 µg/m³Grants Pass, 3 September: 10.6 µg/m³VernonVernon, 12 August: 7.9 µg/m³Vernon, 13 August: 9.5 µg/m³Vernon, 14 August: 22.1 µg/m³Vernon, 15 August: 48.2 µg/m³Vernon, 16 August: no readingVernon, 17 August: 93.1 µg/m³, 9.6× its usual 9.7Vernon, 18 August: 30.5 µg/m³, 3.1× its usual 10.0Vernon, 19 August: 158.0 µg/m³, 16× its usual 10.0Vernon, 20 August: 201.0 µg/m³, 21× its usual 9.7Vernon, 21 August: 124.0 µg/m³, 13× its usual 9.5Vernon, 22 August: 32.7 µg/m³, 3.4× its usual 9.5Vernon, 23 August: 20.1 µg/m³Vernon, 24 August: 18.4 µg/m³Vernon, 25 August: 26.7 µg/m³, 2.9× its usual 9.2Vernon, 26 August: 26.8 µg/m³, 2.9× its usual 9.1Vernon, 27 August: 24.0 µg/m³Vernon, 28 August: 30.6 µg/m³Vernon, 29 August: 32.3 µg/m³Vernon, 30 August: 21.1 µg/m³Vernon, 31 August: 10.0 µg/m³Vernon, 1 September: 14.2 µg/m³Vernon, 2 September: 12.7 µg/m³Vernon, 3 September: 15.8 µg/m³Moses LakeMoses Lake, 12 August: 5.5 µg/m³Moses Lake, 13 August: 5.5 µg/m³Moses Lake, 14 August: 6.8 µg/m³Moses Lake, 15 August: 7.2 µg/m³Moses Lake, 16 August: 24.7 µg/m³Moses Lake, 17 August: 37.2 µg/m³, 4.7× its usual 8.0Moses Lake, 18 August: 7.1 µg/m³Moses Lake, 19 August: 140.0 µg/m³, 18× its usual 7.6Moses Lake, 20 August: 192.0 µg/m³, 25× its usual 7.6Moses Lake, 21 August: 154.0 µg/m³, 20× its usual 7.6Moses Lake, 22 August: 42.6 µg/m³, 5.7× its usual 7.5Moses Lake, 23 August: 10.7 µg/m³Moses Lake, 24 August: 10.4 µg/m³Moses Lake, 25 August: 15.6 µg/m³Moses Lake, 26 August: 14.3 µg/m³Moses Lake, 27 August: 17.8 µg/m³Moses Lake, 28 August: 16.1 µg/m³Moses Lake, 29 August: 18.0 µg/m³Moses Lake, 30 August: 8.0 µg/m³Moses Lake, 31 August: 4.3 µg/m³Moses Lake, 1 September: 7.1 µg/m³Moses Lake, 2 September: 8.3 µg/m³Moses Lake, 3 September: 7.1 µg/m³SandpointSandpoint, 12 August: 4.0 µg/m³Sandpoint, 13 August: 3.9 µg/m³Sandpoint, 14 August: 5.5 µg/m³Sandpoint, 15 August: 6.9 µg/m³Sandpoint, 16 August: 19.9 µg/m³Sandpoint, 17 August: 35.1 µg/m³, 3.6× its usual 9.8Sandpoint, 18 August: 25.7 µg/m³, 2.6× its usual 9.8Sandpoint, 19 August: 183.0 µg/m³, 19× its usual 9.8Sandpoint, 20 August: 70.8 µg/m³, 7.3× its usual 9.7Sandpoint, 21 August: 50.8 µg/m³, 5.2× its usual 9.7Sandpoint, 22 August: 27.4 µg/m³, 2.8× its usual 9.7Sandpoint, 23 August: 15.3 µg/m³Sandpoint, 24 August: 6.4 µg/m³Sandpoint, 25 August: 10.8 µg/m³Sandpoint, 26 August: 8.7 µg/m³Sandpoint, 27 August: 11.5 µg/m³Sandpoint, 28 August: 13.8 µg/m³Sandpoint, 29 August: 12.8 µg/m³Sandpoint, 30 August: 3.5 µg/m³Sandpoint, 31 August: 4.0 µg/m³Sandpoint, 1 September: 2.7 µg/m³Sandpoint, 2 September: 4.0 µg/m³Sandpoint, 3 September: 5.8 µg/m³MedfordMedford, 12 August: 14.6 µg/m³Medford, 13 August: 10.6 µg/m³Medford, 14 August: 10.3 µg/m³Medford, 15 August: 14.9 µg/m³Medford, 16 August: 18.4 µg/m³Medford, 17 August: 94.7 µg/m³, 15× its usual 6.5Medford, 18 August: 78.3 µg/m³, 12× its usual 6.5Medford, 19 August: 28.3 µg/m³, 4.4× its usual 6.5Medford, 20 August: 47.8 µg/m³, 7.4× its usual 6.5Medford, 21 August: 55.3 µg/m³, 8.1× its usual 6.8Medford, 22 August: 131.0 µg/m³, 20× its usual 6.7Medford, 23 August: 61.1 µg/m³, 9.4× its usual 6.5Medford, 24 August: 72.2 µg/m³, 11× its usual 6.4Medford, 25 August: 138.0 µg/m³, 22× its usual 6.3Medford, 26 August: 86.1 µg/m³, 14× its usual 6.1Medford, 27 August: 139.0 µg/m³, 24× its usual 5.9Medford, 28 August: 160.0 µg/m³, 28× its usual 5.8Medford, 29 August: 62.4 µg/m³, 11× its usual 5.7Medford, 30 August: 31.6 µg/m³, 5.5× its usual 5.7Medford, 31 August: 28.0 µg/m³, 5.1× its usual 5.5Medford, 1 September: 15.3 µg/m³Medford, 2 September: 7.5 µg/m³Medford, 3 September: 9.0 µg/m³AshlandAshland, 12 August: 10.7 µg/m³Ashland, 13 August: 11.9 µg/m³Ashland, 14 August: 9.8 µg/m³Ashland, 15 August: 15.5 µg/m³Ashland, 16 August: 17.5 µg/m³Ashland, 17 August: 135.0 µg/m³, 21× its usual 6.4Ashland, 18 August: 125.0 µg/m³, 19× its usual 6.7Ashland, 19 August: 32.1 µg/m³, 5.0× its usual 6.4Ashland, 20 August: 56.2 µg/m³, 8.8× its usual 6.4Ashland, 21 August: 43.9 µg/m³, 6.7× its usual 6.6Ashland, 22 August: 159.0 µg/m³, 24× its usual 6.6Ashland, 23 August: 84.6 µg/m³, 13× its usual 6.4Ashland, 24 August: 69.6 µg/m³, 11× its usual 6.2Ashland, 25 August: 142.0 µg/m³, 24× its usual 5.9Ashland, 26 August: 70.8 µg/m³, 12× its usual 5.7Ashland, 27 August: 127.0 µg/m³, 23× its usual 5.6Ashland, 28 August: 149.0 µg/m³, 28× its usual 5.4Ashland, 29 August: 66.7 µg/m³, 13× its usual 5.3Ashland, 30 August: 32.4 µg/m³, 6.0× its usual 5.4Ashland, 31 August: 28.7 µg/m³, 5.4× its usual 5.3Ashland, 1 September: 14.4 µg/m³Ashland, 2 September: 6.2 µg/m³Ashland, 3 September: 9.1 µg/m³TalentTalent, 12 August: 10.9 µg/m³Talent, 13 August: 9.2 µg/m³Talent, 14 August: 9.1 µg/m³Talent, 15 August: 13.7 µg/m³Talent, 16 August: 16.3 µg/m³Talent, 17 August: 126.0 µg/m³, 20× its usual 6.2Talent, 18 August: 80.1 µg/m³, 13× its usual 6.3Talent, 19 August: 25.4 µg/m³, 4.1× its usual 6.2Talent, 20 August: 52.8 µg/m³, 8.5× its usual 6.2Talent, 21 August: 42.1 µg/m³, 6.7× its usual 6.3Talent, 22 August: 134.0 µg/m³, 22× its usual 6.2Talent, 23 August: 59.6 µg/m³, 9.8× its usual 6.1Talent, 24 August: 75.2 µg/m³, 13× its usual 6.0Talent, 25 August: 141.0 µg/m³, 26× its usual 5.4Talent, 26 August: 72.0 µg/m³, 14× its usual 5.3Talent, 27 August: 129.0 µg/m³, 25× its usual 5.2Talent, 28 August: 149.0 µg/m³, 29× its usual 5.1Talent, 29 August: 61.8 µg/m³, 12× its usual 5.0Talent, 30 August: 32.6 µg/m³, 6.5× its usual 5.0Talent, 31 August: 29.8 µg/m³, 6.0× its usual 4.9Talent, 1 September: 12.8 µg/m³Talent, 2 September: 5.9 µg/m³Talent, 3 September: 8.4 µg/m³CastlegarCastlegar, 12 August: 3.8 µg/m³Castlegar, 13 August: 3.7 µg/m³Castlegar, 14 August: 4.9 µg/m³Castlegar, 15 August: 17.5 µg/m³Castlegar, 16 August: no readingCastlegar, 17 August: 130.0 µg/m³, 13× its usual 9.7Castlegar, 18 August: 46.0 µg/m³, 4.7× its usual 9.7Castlegar, 19 August: 142.0 µg/m³, 15× its usual 9.5Castlegar, 20 August: 110.0 µg/m³, 12× its usual 9.4Castlegar, 21 August: 96.3 µg/m³, 10× its usual 9.4Castlegar, 22 August: 58.1 µg/m³, 6.2× its usual 9.4Castlegar, 23 August: 18.4 µg/m³Castlegar, 24 August: 11.0 µg/m³Castlegar, 25 August: 9.0 µg/m³Castlegar, 26 August: 13.4 µg/m³Castlegar, 27 August: 15.9 µg/m³Castlegar, 28 August: 24.6 µg/m³Castlegar, 29 August: 21.1 µg/m³Castlegar, 30 August: 4.8 µg/m³Castlegar, 31 August: 10.3 µg/m³Castlegar, 1 September: 7.4 µg/m³Castlegar, 2 September: 10.0 µg/m³Castlegar, 3 September: 10.7 µg/m³LewistonLewiston, 12 August: 5.9 µg/m³Lewiston, 13 August: 7.9 µg/m³Lewiston, 14 August: 8.5 µg/m³Lewiston, 15 August: 10.6 µg/m³Lewiston, 16 August: 12.6 µg/m³Lewiston, 17 August: 27.0 µg/m³, 2.3× its usual 11.7Lewiston, 18 August: 12.1 µg/m³Lewiston, 19 August: 27.3 µg/m³, 2.6× its usual 10.7Lewiston, 20 August: 123.0 µg/m³, 12× its usual 10.6Lewiston, 21 August: 55.0 µg/m³, 5.2× its usual 10.6Lewiston, 22 August: 38.1 µg/m³, 3.8× its usual 10.1Lewiston, 23 August: 35.8 µg/m³Lewiston, 24 August: 20.5 µg/m³Lewiston, 25 August: 25.8 µg/m³Lewiston, 26 August: 15.9 µg/m³Lewiston, 27 August: 6.2 µg/m³Lewiston, 28 August: 10.1 µg/m³Lewiston, 29 August: 14.4 µg/m³Lewiston, 30 August: 6.8 µg/m³Lewiston, 31 August: 4.5 µg/m³Lewiston, 1 September: 4.6 µg/m³Lewiston, 2 September: 6.6 µg/m³Lewiston, 3 September: 6.6 µg/m³CranbrookCranbrook, 12 August: 7.0 µg/m³Cranbrook, 13 August: 7.4 µg/m³Cranbrook, 14 August: 7.6 µg/m³Cranbrook, 15 August: 12.2 µg/m³Cranbrook, 16 August: no readingCranbrook, 17 August: 104.0 µg/m³, 12× its usual 8.4Cranbrook, 18 August: 38.4 µg/m³, 4.6× its usual 8.3Cranbrook, 19 August: 101.0 µg/m³, 12× its usual 8.2Cranbrook, 20 August: 58.1 µg/m³, 7.1× its usual 8.2Cranbrook, 21 August: 54.5 µg/m³, 6.9× its usual 7.9Cranbrook, 22 August: 11.2 µg/m³Cranbrook, 23 August: 23.5 µg/m³Cranbrook, 24 August: 7.2 µg/m³Cranbrook, 25 August: 14.0 µg/m³Cranbrook, 26 August: 10.4 µg/m³Cranbrook, 27 August: 16.3 µg/m³Cranbrook, 28 August: 17.9 µg/m³Cranbrook, 29 August: 15.8 µg/m³Cranbrook, 30 August: 2.5 µg/m³Cranbrook, 31 August: 7.0 µg/m³Cranbrook, 1 September: 6.6 µg/m³Cranbrook, 2 September: 6.2 µg/m³Cranbrook, 3 September: 7.0 µg/m³QuesnelQuesnel, 12 August: 6.6 µg/m³Quesnel, 13 August: 9.9 µg/m³Quesnel, 14 August: 28.8 µg/m³Quesnel, 15 August: 51.8 µg/m³Quesnel, 16 August: no readingQuesnel, 17 August: 53.9 µg/m³, 5.7× its usual 9.4Quesnel, 18 August: 18.2 µg/m³Quesnel, 19 August: 13.8 µg/m³Quesnel, 20 August: 10.0 µg/m³Quesnel, 21 August: 27.4 µg/m³, 3.0× its usual 9.1Quesnel, 22 August: 63.3 µg/m³, 7.0× its usual 9.1Quesnel, 23 August: 49.0 µg/m³Quesnel, 24 August: 40.6 µg/m³, 4.6× its usual 8.9Quesnel, 25 August: 24.9 µg/m³Quesnel, 26 August: 29.2 µg/m³, 3.2× its usual 9.2Quesnel, 27 August: 36.6 µg/m³, 4.0× its usual 9.2Quesnel, 28 August: 33.6 µg/m³Quesnel, 29 August: 57.4 µg/m³Quesnel, 30 August: 29.9 µg/m³Quesnel, 31 August: 25.2 µg/m³Quesnel, 1 September: 23.4 µg/m³Quesnel, 2 September: 61.1 µg/m³Quesnel, 3 September: 219.0 µg/m³MeadMead, 12 August: 2.8 µg/m³Mead, 13 August: 3.4 µg/m³Mead, 14 August: 6.1 µg/m³Mead, 15 August: 6.6 µg/m³Mead, 16 August: 16.0 µg/m³Mead, 17 August: 16.2 µg/m³Mead, 18 August: 26.7 µg/m³, 3.2× its usual 8.4Mead, 19 August: 264.0 µg/m³, 34× its usual 7.8Mead, 20 August: 197.0 µg/m³, 26× its usual 7.5Mead, 21 August: 67.9 µg/m³, 9.3× its usual 7.3Mead, 22 August: 27.1 µg/m³, 3.7× its usual 7.3Mead, 23 August: 12.9 µg/m³Mead, 24 August: 7.3 µg/m³Mead, 25 August: 13.7 µg/m³Mead, 26 August: 16.8 µg/m³Mead, 27 August: 16.1 µg/m³Mead, 28 August: 15.6 µg/m³Mead, 29 August: 13.3 µg/m³Mead, 30 August: 5.2 µg/m³Mead, 31 August: 4.8 µg/m³Mead, 1 September: 3.8 µg/m³Mead, 2 September: 4.5 µg/m³Mead, 3 September: 3.8 µg/m³SpokaneSpokane, 12 August: 5.3 µg/m³Spokane, 13 August: 6.7 µg/m³Spokane, 14 August: 9.2 µg/m³Spokane, 15 August: 11.8 µg/m³Spokane, 16 August: 14.9 µg/m³Spokane, 17 August: 22.3 µg/m³Spokane, 18 August: 26.9 µg/m³, 2.9× its usual 9.2Spokane, 19 August: 256.0 µg/m³, 28× its usual 9.2Spokane, 20 August: 201.0 µg/m³, 23× its usual 8.8Spokane, 21 August: 63.1 µg/m³, 7.2× its usual 8.8Spokane, 22 August: 25.0 µg/m³, 2.8× its usual 8.8Spokane, 23 August: 12.0 µg/m³Spokane, 24 August: 10.5 µg/m³Spokane, 25 August: 13.8 µg/m³Spokane, 26 August: 17.0 µg/m³Spokane, 27 August: 17.5 µg/m³Spokane, 28 August: 18.4 µg/m³Spokane, 29 August: 14.7 µg/m³Spokane, 30 August: 6.2 µg/m³Spokane, 31 August: 4.1 µg/m³Spokane, 1 September: 5.1 µg/m³Spokane, 2 September: 5.9 µg/m³Spokane, 3 September: 5.1 µg/m³Spokane ValleySpokane Valley, 12 August: 4.7 µg/m³Spokane Valley, 13 August: 6.4 µg/m³Spokane Valley, 14 August: 8.7 µg/m³Spokane Valley, 15 August: 10.3 µg/m³Spokane Valley, 16 August: 15.9 µg/m³Spokane Valley, 17 August: 21.8 µg/m³Spokane Valley, 18 August: 30.0 µg/m³, 3.3× its usual 9.1Spokane Valley, 19 August: 237.0 µg/m³, 26× its usual 9.1Spokane Valley, 20 August: 175.0 µg/m³, 20× its usual 8.6Spokane Valley, 21 August: 39.0 µg/m³, 4.6× its usual 8.5Spokane Valley, 22 August: 23.7 µg/m³Spokane Valley, 23 August: 10.2 µg/m³Spokane Valley, 24 August: 7.5 µg/m³Spokane Valley, 25 August: 13.1 µg/m³Spokane Valley, 26 August: 14.7 µg/m³Spokane Valley, 27 August: 14.3 µg/m³Spokane Valley, 28 August: 16.7 µg/m³Spokane Valley, 29 August: 14.8 µg/m³Spokane Valley, 30 August: 3.8 µg/m³Spokane Valley, 31 August: 2.9 µg/m³Spokane Valley, 1 September: 4.3 µg/m³Spokane Valley, 2 September: 6.3 µg/m³Spokane Valley, 3 September: 4.6 µg/m³CheneyCheney, 12 August: 1.9 µg/m³Cheney, 13 August: 4.1 µg/m³Cheney, 14 August: 5.5 µg/m³Cheney, 15 August: no readingCheney, 16 August: no readingCheney, 17 August: no readingCheney, 18 August: 4.8 µg/m³Cheney, 19 August: 255.0 µg/m³, 35× its usual 7.3Cheney, 20 August: 264.0 µg/m³, 50× its usual 5.3Cheney, 21 August: 41.5 µg/m³, 8.3× its usual 5.0Cheney, 22 August: 28.4 µg/m³, 5.4× its usual 5.3Cheney, 23 August: 9.6 µg/m³Cheney, 24 August: 7.4 µg/m³Cheney, 25 August: 11.8 µg/m³Cheney, 26 August: 12.4 µg/m³Cheney, 27 August: 14.6 µg/m³Cheney, 28 August: 14.5 µg/m³Cheney, 29 August: 12.5 µg/m³Cheney, 30 August: 3.7 µg/m³Cheney, 31 August: 1.7 µg/m³Cheney, 1 September: 2.8 µg/m³Cheney, 2 September: 2.5 µg/m³Cheney, 3 September: 3.1 µg/m³Walla WallaWalla Walla, 12 August: 3.8 µg/m³Walla Walla, 13 August: 6.0 µg/m³Walla Walla, 14 August: 7.0 µg/m³Walla Walla, 15 August: 8.0 µg/m³Walla Walla, 16 August: 8.1 µg/m³Walla Walla, 17 August: 10.1 µg/m³Walla Walla, 18 August: 5.7 µg/m³Walla Walla, 19 August: 71.9 µg/m³, 10.0× its usual 7.2Walla Walla, 20 August: 226.0 µg/m³, 32× its usual 7.0Walla Walla, 21 August: 196.0 µg/m³, 28× its usual 7.0Walla Walla, 22 August: 25.1 µg/m³, 3.6× its usual 7.0Walla Walla, 23 August: 10.6 µg/m³Walla Walla, 24 August: 18.1 µg/m³Walla Walla, 25 August: 15.4 µg/m³Walla Walla, 26 August: 16.4 µg/m³Walla Walla, 27 August: 11.8 µg/m³Walla Walla, 28 August: 10.0 µg/m³Walla Walla, 29 August: no readingWalla Walla, 30 August: no readingWalla Walla, 31 August: 4.1 µg/m³Walla Walla, 1 September: 4.5 µg/m³Walla Walla, 2 September: 8.2 µg/m³Walla Walla, 3 September: 5.7 µg/m³HopeHope, 12 August: 4.5 µg/m³Hope, 13 August: 11.4 µg/m³Hope, 14 August: 11.3 µg/m³Hope, 15 August: 16.1 µg/m³Hope, 16 August: 9.3 µg/m³Hope, 17 August: 8.2 µg/m³Hope, 18 August: 2.6 µg/m³Hope, 19 August: 49.5 µg/m³, 8.1× its usual 6.1Hope, 20 August: 216.0 µg/m³, 35× its usual 6.2Hope, 21 August: 81.2 µg/m³, 13× its usual 6.2Hope, 22 August: 10.3 µg/m³Hope, 23 August: 4.8 µg/m³Hope, 24 August: 36.3 µg/m³, 5.8× its usual 6.3Hope, 25 August: 56.0 µg/m³, 9.2× its usual 6.1Hope, 26 August: 36.4 µg/m³, 6.0× its usual 6.1Hope, 27 August: 93.2 µg/m³, 15× its usual 6.1Hope, 28 August: 44.4 µg/m³Hope, 29 August: 9.5 µg/m³Hope, 30 August: 4.1 µg/m³Hope, 31 August: 8.8 µg/m³Hope, 1 September: 8.4 µg/m³Hope, 2 September: 10.8 µg/m³Hope, 3 September: 9.9 µg/m³Tri-CitiesTri-Cities, 12 August: 3.0 µg/m³Tri-Cities, 13 August: 3.9 µg/m³Tri-Cities, 14 August: 4.6 µg/m³Tri-Cities, 15 August: 5.3 µg/m³Tri-Cities, 16 August: 11.0 µg/m³Tri-Cities, 17 August: 11.7 µg/m³Tri-Cities, 18 August: 3.3 µg/m³Tri-Cities, 19 August: 107.0 µg/m³, 18× its usual 6.0Tri-Cities, 20 August: 193.5 µg/m³, 33× its usual 5.8Tri-Cities, 21 August: 211.5 µg/m³, 36× its usual 5.8Tri-Cities, 22 August: 24.8 µg/m³Tri-Cities, 23 August: 4.8 µg/m³Tri-Cities, 24 August: 10.0 µg/m³Tri-Cities, 25 August: 12.4 µg/m³Tri-Cities, 26 August: 12.6 µg/m³Tri-Cities, 27 August: 10.1 µg/m³Tri-Cities, 28 August: 12.6 µg/m³Tri-Cities, 29 August: 8.0 µg/m³Tri-Cities, 30 August: 2.1 µg/m³Tri-Cities, 31 August: 3.2 µg/m³Tri-Cities, 1 September: 3.9 µg/m³Tri-Cities, 2 September: 6.9 µg/m³Tri-Cities, 3 September: 4.8 µg/m³Airway HeightsAirway Heights, 12 August: 2.2 µg/m³Airway Heights, 13 August: 3.3 µg/m³Airway Heights, 14 August: 6.8 µg/m³Airway Heights, 15 August: 9.1 µg/m³Airway Heights, 16 August: 15.9 µg/m³Airway Heights, 17 August: 24.8 µg/m³Airway Heights, 18 August: 23.3 µg/m³Airway Heights, 19 August: 202.0 µg/m³, 26× its usual 7.8Airway Heights, 20 August: 168.0 µg/m³, 22× its usual 7.6Airway Heights, 21 August: 50.3 µg/m³, 6.6× its usual 7.6Airway Heights, 22 August: 23.9 µg/m³Airway Heights, 23 August: 10.6 µg/m³Airway Heights, 24 August: 10.0 µg/m³Airway Heights, 25 August: 12.1 µg/m³Airway Heights, 26 August: 16.2 µg/m³Airway Heights, 27 August: 14.1 µg/m³Airway Heights, 28 August: 14.5 µg/m³Airway Heights, 29 August: 14.8 µg/m³Airway Heights, 30 August: 7.7 µg/m³Airway Heights, 31 August: 4.3 µg/m³Airway Heights, 1 September: 3.4 µg/m³Airway Heights, 2 September: 3.6 µg/m³Airway Heights, 3 September: 4.1 µg/m³HermistonHermiston, 12 August: 4.6 µg/m³Hermiston, 13 August: 7.0 µg/m³Hermiston, 14 August: 9.0 µg/m³Hermiston, 15 August: 10.6 µg/m³Hermiston, 16 August: 10.2 µg/m³Hermiston, 17 August: 11.2 µg/m³Hermiston, 18 August: 6.0 µg/m³Hermiston, 19 August: 77.3 µg/m³, 10× its usual 7.4Hermiston, 20 August: 191.0 µg/m³, 27× its usual 7.0Hermiston, 21 August: 195.0 µg/m³, 28× its usual 7.0Hermiston, 22 August: 20.8 µg/m³Hermiston, 23 August: 7.5 µg/m³Hermiston, 24 August: 17.2 µg/m³Hermiston, 25 August: 17.0 µg/m³Hermiston, 26 August: 19.9 µg/m³Hermiston, 27 August: 16.4 µg/m³Hermiston, 28 August: 17.6 µg/m³Hermiston, 29 August: 13.1 µg/m³Hermiston, 30 August: 3.1 µg/m³Hermiston, 31 August: 5.3 µg/m³Hermiston, 1 September: 8.9 µg/m³Hermiston, 2 September: 8.8 µg/m³Hermiston, 3 September: 6.0 µg/m³Hood RiverHood River, 12 August: 2.4 µg/m³Hood River, 13 August: 3.6 µg/m³Hood River, 14 August: 4.8 µg/m³Hood River, 15 August: 8.8 µg/m³Hood River, 16 August: 6.1 µg/m³Hood River, 17 August: 6.2 µg/m³Hood River, 18 August: 4.0 µg/m³Hood River, 19 August: 60.2 µg/m³, 12× its usual 3.9Hood River, 20 August: 188.0 µg/m³, 38× its usual 3.9Hood River, 21 August: 96.7 µg/m³, 19× its usual 4.0Hood River, 22 August: 2.6 µg/m³Hood River, 23 August: 4.3 µg/m³Hood River, 24 August: 8.6 µg/m³Hood River, 25 August: 14.8 µg/m³Hood River, 26 August: 10.6 µg/m³Hood River, 27 August: 19.8 µg/m³Hood River, 28 August: 29.3 µg/m³, 5.9× its usual 3.8Hood River, 29 August: 5.2 µg/m³Hood River, 30 August: 2.0 µg/m³Hood River, 31 August: 5.0 µg/m³Hood River, 1 September: 4.7 µg/m³Hood River, 2 September: 5.6 µg/m³Hood River, 3 September: 6.7 µg/m³PendletonPendleton, 12 August: 3.0 µg/m³Pendleton, 13 August: 5.7 µg/m³Pendleton, 14 August: 7.4 µg/m³Pendleton, 15 August: 8.1 µg/m³Pendleton, 16 August: 6.5 µg/m³Pendleton, 17 August: 12.1 µg/m³Pendleton, 18 August: 6.3 µg/m³Pendleton, 19 August: 62.3 µg/m³, 8.0× its usual 7.8Pendleton, 20 August: 180.0 µg/m³, 23× its usual 7.7Pendleton, 21 August: 125.0 µg/m³, 16× its usual 7.7Pendleton, 22 August: 25.3 µg/m³, 3.4× its usual 7.4Pendleton, 23 August: 9.1 µg/m³Pendleton, 24 August: 17.1 µg/m³Pendleton, 25 August: 14.8 µg/m³Pendleton, 26 August: 16.9 µg/m³Pendleton, 27 August: 13.1 µg/m³Pendleton, 28 August: 11.7 µg/m³Pendleton, 29 August: 17.6 µg/m³Pendleton, 30 August: 2.7 µg/m³Pendleton, 31 August: 3.8 µg/m³Pendleton, 1 September: 6.7 µg/m³Pendleton, 2 September: 6.4 µg/m³Pendleton, 3 September: 4.6 µg/m³The DallesThe Dalles, 12 August: 3.2 µg/m³The Dalles, 13 August: 4.9 µg/m³The Dalles, 14 August: 6.1 µg/m³The Dalles, 15 August: 9.5 µg/m³The Dalles, 16 August: 8.0 µg/m³The Dalles, 17 August: 6.6 µg/m³The Dalles, 18 August: 3.5 µg/m³The Dalles, 19 August: 56.5 µg/m³, 9.7× its usual 5.8The Dalles, 20 August: 174.0 µg/m³, 30× its usual 5.8The Dalles, 21 August: 99.3 µg/m³, 17× its usual 5.8The Dalles, 22 August: 3.1 µg/m³The Dalles, 23 August: 4.9 µg/m³The Dalles, 24 August: 9.7 µg/m³The Dalles, 25 August: 16.1 µg/m³The Dalles, 26 August: 12.8 µg/m³The Dalles, 27 August: 42.3 µg/m³, 8.0× its usual 5.3The Dalles, 28 August: 72.3 µg/m³, 14× its usual 5.3The Dalles, 29 August: 8.5 µg/m³The Dalles, 30 August: 4.8 µg/m³The Dalles, 31 August: 6.1 µg/m³The Dalles, 1 September: 5.6 µg/m³The Dalles, 2 September: 6.9 µg/m³The Dalles, 3 September: 7.3 µg/m³WenatcheeWenatchee, 12 August: 4.1 µg/m³Wenatchee, 13 August: 4.6 µg/m³Wenatchee, 14 August: 5.2 µg/m³Wenatchee, 15 August: 8.1 µg/m³Wenatchee, 16 August: 21.3 µg/m³Wenatchee, 17 August: 8.2 µg/m³Wenatchee, 18 August: 4.2 µg/m³Wenatchee, 19 August: 50.4 µg/m³, 8.5× its usual 5.9Wenatchee, 20 August: 121.0 µg/m³, 21× its usual 5.8Wenatchee, 21 August: 163.0 µg/m³, 28× its usual 5.9Wenatchee, 22 August: 22.9 µg/m³Wenatchee, 23 August: 4.8 µg/m³Wenatchee, 24 August: 13.7 µg/m³Wenatchee, 25 August: 15.0 µg/m³Wenatchee, 26 August: 13.2 µg/m³Wenatchee, 27 August: 11.0 µg/m³Wenatchee, 28 August: 12.3 µg/m³Wenatchee, 29 August: 20.9 µg/m³Wenatchee, 30 August: 4.3 µg/m³Wenatchee, 31 August: 4.1 µg/m³Wenatchee, 1 September: 5.0 µg/m³Wenatchee, 2 September: 8.2 µg/m³Wenatchee, 3 September: 5.9 µg/m³SunnysideSunnyside, 12 August: 4.7 µg/m³Sunnyside, 13 August: 5.0 µg/m³Sunnyside, 14 August: 7.4 µg/m³Sunnyside, 15 August: 8.0 µg/m³Sunnyside, 16 August: 19.9 µg/m³Sunnyside, 17 August: 20.4 µg/m³Sunnyside, 18 August: 5.8 µg/m³Sunnyside, 19 August: 85.1 µg/m³, 9.9× its usual 8.6Sunnyside, 20 August: 148.0 µg/m³, 17× its usual 8.6Sunnyside, 21 August: 158.0 µg/m³, 18× its usual 8.6Sunnyside, 22 August: 53.9 µg/m³, 6.3× its usual 8.5Sunnyside, 23 August: 3.8 µg/m³Sunnyside, 24 August: 13.1 µg/m³Sunnyside, 25 August: 17.9 µg/m³Sunnyside, 26 August: 15.7 µg/m³Sunnyside, 27 August: 12.9 µg/m³Sunnyside, 28 August: 16.0 µg/m³Sunnyside, 29 August: 9.8 µg/m³Sunnyside, 30 August: 2.9 µg/m³Sunnyside, 31 August: 3.5 µg/m³Sunnyside, 1 September: 7.8 µg/m³Sunnyside, 2 September: 8.8 µg/m³Sunnyside, 3 September: 5.1 µg/m³FinleyFinley, 12 August: 1.9 µg/m³Finley, 13 August: 2.9 µg/m³Finley, 14 August: 4.0 µg/m³Finley, 15 August: 4.0 µg/m³Finley, 16 August: 8.9 µg/m³Finley, 17 August: 7.9 µg/m³Finley, 18 August: 1.6 µg/m³Finley, 19 August: 93.3 µg/m³, 19× its usual 4.7Finley, 20 August: 152.0 µg/m³, 30× its usual 4.6Finley, 21 August: 157.0 µg/m³, 31× its usual 4.6Finley, 22 August: 19.7 µg/m³Finley, 23 August: 3.6 µg/m³Finley, 24 August: 7.2 µg/m³Finley, 25 August: 9.5 µg/m³Finley, 26 August: 11.0 µg/m³Finley, 27 August: 9.8 µg/m³Finley, 28 August: 9.3 µg/m³Finley, 29 August: 5.5 µg/m³Finley, 30 August: 0.7 µg/m³Finley, 31 August: 2.5 µg/m³Finley, 1 September: 3.4 µg/m³Finley, 2 September: 5.7 µg/m³Finley, 3 September: 2.8 µg/m³PascoPasco, 12 August: 1.9 µg/m³Pasco, 13 August: 2.9 µg/m³Pasco, 14 August: 4.0 µg/m³Pasco, 15 August: 4.0 µg/m³Pasco, 16 August: 8.9 µg/m³Pasco, 17 August: 7.9 µg/m³Pasco, 18 August: 1.6 µg/m³Pasco, 19 August: 93.3 µg/m³, 19× its usual 4.7Pasco, 20 August: 152.0 µg/m³, 30× its usual 4.5Pasco, 21 August: 157.0 µg/m³, 31× its usual 4.5Pasco, 22 August: 19.7 µg/m³Pasco, 23 August: 3.6 µg/m³Pasco, 24 August: 7.2 µg/m³Pasco, 25 August: 9.5 µg/m³Pasco, 26 August: 11.0 µg/m³Pasco, 27 August: 9.8 µg/m³Pasco, 28 August: 9.3 µg/m³Pasco, 29 August: 5.5 µg/m³Pasco, 30 August: 0.7 µg/m³Pasco, 31 August: 2.5 µg/m³Pasco, 1 September: 3.4 µg/m³Pasco, 2 September: 5.7 µg/m³Pasco, 3 September: 2.8 µg/m³ProsserProsser, 12 August: 4.2 µg/m³Prosser, 13 August: 7.0 µg/m³Prosser, 14 August: 6.6 µg/m³Prosser, 15 August: 8.3 µg/m³Prosser, 16 August: 18.7 µg/m³Prosser, 17 August: 17.9 µg/m³Prosser, 18 August: 5.4 µg/m³Prosser, 19 August: 74.1 µg/m³, 9.9× its usual 7.5Prosser, 20 August: 150.0 µg/m³, 20× its usual 7.5Prosser, 21 August: 157.0 µg/m³, 21× its usual 7.5Prosser, 22 August: 29.8 µg/m³, 4.0× its usual 7.5Prosser, 23 August: 4.6 µg/m³Prosser, 24 August: 10.5 µg/m³Prosser, 25 August: 15.8 µg/m³Prosser, 26 August: 15.2 µg/m³Prosser, 27 August: 13.9 µg/m³Prosser, 28 August: 16.6 µg/m³Prosser, 29 August: 10.6 µg/m³Prosser, 30 August: 3.1 µg/m³Prosser, 31 August: 5.0 µg/m³Prosser, 1 September: 8.8 µg/m³Prosser, 2 September: 9.4 µg/m³Prosser, 3 September: 6.2 µg/m³ToppenishToppenish, 12 August: 4.2 µg/m³Toppenish, 13 August: 4.9 µg/m³Toppenish, 14 August: 6.0 µg/m³Toppenish, 15 August: 9.3 µg/m³Toppenish, 16 August: 24.8 µg/m³Toppenish, 17 August: 16.7 µg/m³Toppenish, 18 August: 4.0 µg/m³Toppenish, 19 August: 65.0 µg/m³, 7.1× its usual 9.2Toppenish, 20 August: 146.0 µg/m³, 17× its usual 8.8Toppenish, 21 August: 157.0 µg/m³, 18× its usual 8.8Toppenish, 22 August: 24.5 µg/m³Toppenish, 23 August: 4.8 µg/m³Toppenish, 24 August: 12.7 µg/m³Toppenish, 25 August: 18.9 µg/m³Toppenish, 26 August: 15.5 µg/m³Toppenish, 27 August: 14.0 µg/m³Toppenish, 28 August: 15.0 µg/m³Toppenish, 29 August: 9.4 µg/m³Toppenish, 30 August: 3.9 µg/m³Toppenish, 31 August: 6.0 µg/m³Toppenish, 1 September: 9.3 µg/m³Toppenish, 2 September: 10.0 µg/m³Toppenish, 3 September: 7.1 µg/m³PullmanPullman, 12 August: 5.4 µg/m³Pullman, 13 August: 6.8 µg/m³Pullman, 14 August: 7.3 µg/m³Pullman, 15 August: 8.0 µg/m³Pullman, 16 August: 17.3 µg/m³Pullman, 17 August: 22.0 µg/m³Pullman, 18 August: 6.1 µg/m³Pullman, 19 August: 53.5 µg/m³, 6.0× its usual 8.9Pullman, 20 August: 147.0 µg/m³, 17× its usual 8.6Pullman, 21 August: 6.4 µg/m³Pullman, 22 August: 28.8 µg/m³, 3.3× its usual 8.6Pullman, 23 August: 13.9 µg/m³Pullman, 24 August: 20.1 µg/m³Pullman, 25 August: 21.0 µg/m³Pullman, 26 August: 10.6 µg/m³Pullman, 27 August: 8.9 µg/m³Pullman, 28 August: 9.4 µg/m³Pullman, 29 August: 12.0 µg/m³Pullman, 30 August: 3.9 µg/m³Pullman, 31 August: 3.8 µg/m³Pullman, 1 September: 4.5 µg/m³Pullman, 2 September: 6.3 µg/m³Pullman, 3 September: 6.2 µg/m³EllensburgEllensburg, 12 August: 3.2 µg/m³Ellensburg, 13 August: 4.3 µg/m³Ellensburg, 14 August: 5.2 µg/m³Ellensburg, 15 August: 8.3 µg/m³Ellensburg, 16 August: 13.0 µg/m³Ellensburg, 17 August: 8.0 µg/m³Ellensburg, 18 August: 5.7 µg/m³Ellensburg, 19 August: 67.2 µg/m³, 11× its usual 6.2Ellensburg, 20 August: 145.0 µg/m³, 23× its usual 6.2Ellensburg, 21 August: 139.0 µg/m³, 22× its usual 6.2Ellensburg, 22 August: 10.0 µg/m³Ellensburg, 23 August: 3.3 µg/m³Ellensburg, 24 August: 14.7 µg/m³Ellensburg, 25 August: 17.4 µg/m³Ellensburg, 26 August: 12.4 µg/m³Ellensburg, 27 August: 9.2 µg/m³Ellensburg, 28 August: 13.4 µg/m³Ellensburg, 29 August: 8.6 µg/m³Ellensburg, 30 August: 6.1 µg/m³Ellensburg, 31 August: 3.8 µg/m³Ellensburg, 1 September: 5.3 µg/m³Ellensburg, 2 September: 6.3 µg/m³Ellensburg, 3 September: 6.2 µg/m³Coeur d'AleneCoeur d'Alene, 12 August: 3.5 µg/m³Coeur d'Alene, 13 August: 9.3 µg/m³Coeur d'Alene, 14 August: 13.0 µg/m³Coeur d'Alene, 15 August: 10.8 µg/m³Coeur d'Alene, 16 August: 14.8 µg/m³Coeur d'Alene, 17 August: 24.5 µg/m³Coeur d'Alene, 18 August: 24.5 µg/m³Coeur d'Alene, 19 August: 142.0 µg/m³, 14× its usual 9.8Coeur d'Alene, 20 August: 102.0 µg/m³, 11× its usual 9.3Coeur d'Alene, 21 August: 41.0 µg/m³, 4.4× its usual 9.4Coeur d'Alene, 22 August: 27.4 µg/m³, 2.9× its usual 9.4Coeur d'Alene, 23 August: 16.3 µg/m³Coeur d'Alene, 24 August: 10.8 µg/m³Coeur d'Alene, 25 August: 13.8 µg/m³Coeur d'Alene, 26 August: 15.5 µg/m³Coeur d'Alene, 27 August: 15.4 µg/m³Coeur d'Alene, 28 August: 12.8 µg/m³Coeur d'Alene, 29 August: 15.8 µg/m³Coeur d'Alene, 30 August: 4.3 µg/m³Coeur d'Alene, 31 August: 3.3 µg/m³Coeur d'Alene, 1 September: 4.1 µg/m³Coeur d'Alene, 2 September: 3.8 µg/m³Coeur d'Alene, 3 September: 4.3 µg/m³YakimaYakima, 12 August: 3.7 µg/m³Yakima, 13 August: 4.1 µg/m³Yakima, 14 August: 5.3 µg/m³Yakima, 15 August: 9.7 µg/m³Yakima, 16 August: 14.6 µg/m³Yakima, 17 August: 7.3 µg/m³Yakima, 18 August: 5.1 µg/m³Yakima, 19 August: 77.5 µg/m³, 11× its usual 6.9Yakima, 20 August: 140.0 µg/m³, 20× its usual 6.9Yakima, 21 August: 141.0 µg/m³, 20× its usual 7.0Yakima, 22 August: 20.9 µg/m³Yakima, 23 August: 3.5 µg/m³Yakima, 24 August: 13.7 µg/m³Yakima, 25 August: 14.8 µg/m³Yakima, 26 August: 14.3 µg/m³Yakima, 27 August: 12.0 µg/m³Yakima, 28 August: 12.8 µg/m³Yakima, 29 August: 8.8 µg/m³Yakima, 30 August: 3.0 µg/m³Yakima, 31 August: 4.8 µg/m³Yakima, 1 September: 6.7 µg/m³Yakima, 2 September: 8.4 µg/m³Yakima, 3 September: 7.8 µg/m³ChilliwackChilliwack, 12 August: 4.1 µg/m³Chilliwack, 13 August: 9.0 µg/m³Chilliwack, 14 August: 8.6 µg/m³Chilliwack, 15 August: 8.7 µg/m³Chilliwack, 16 August: 5.4 µg/m³Chilliwack, 17 August: 7.3 µg/m³Chilliwack, 18 August: 2.8 µg/m³Chilliwack, 19 August: 29.6 µg/m³, 4.6× its usual 6.5Chilliwack, 20 August: 115.0 µg/m³, 18× its usual 6.5Chilliwack, 21 August: 24.6 µg/m³Chilliwack, 22 August: 4.4 µg/m³Chilliwack, 23 August: 5.1 µg/m³Chilliwack, 24 August: 21.1 µg/m³Chilliwack, 25 August: 49.7 µg/m³, 7.8× its usual 6.4Chilliwack, 26 August: 38.3 µg/m³, 6.0× its usual 6.4Chilliwack, 27 August: 48.0 µg/m³, 7.6× its usual 6.3Chilliwack, 28 August: 25.3 µg/m³Chilliwack, 29 August: no readingChilliwack, 30 August: no readingChilliwack, 31 August: 6.9 µg/m³Chilliwack, 1 September: 8.6 µg/m³Chilliwack, 2 September: 12.9 µg/m³Chilliwack, 3 September: 8.9 µg/m³AgassizAgassiz, 12 August: 6.0 µg/m³Agassiz, 13 August: 10.1 µg/m³Agassiz, 14 August: 10.7 µg/m³Agassiz, 15 August: 11.5 µg/m³Agassiz, 16 August: 7.3 µg/m³Agassiz, 17 August: 7.6 µg/m³Agassiz, 18 August: 3.9 µg/m³Agassiz, 19 August: 50.5 µg/m³, 7.4× its usual 6.8Agassiz, 20 August: no readingAgassiz, 21 August: no readingAgassiz, 22 August: 7.2 µg/m³Agassiz, 23 August: 6.5 µg/m³Agassiz, 24 August: 26.8 µg/m³, 3.9× its usual 6.8Agassiz, 25 August: 52.2 µg/m³, 7.8× its usual 6.7Agassiz, 26 August: 40.9 µg/m³, 6.2× its usual 6.6Agassiz, 27 August: 66.8 µg/m³, 10× its usual 6.4Agassiz, 28 August: 26.3 µg/m³Agassiz, 29 August: 10.8 µg/m³Agassiz, 30 August: 3.6 µg/m³Agassiz, 31 August: 3.8 µg/m³Agassiz, 1 September: 6.3 µg/m³Agassiz, 2 September: 13.6 µg/m³Agassiz, 3 September: 10.4 µg/m³AuburnAuburn, 12 August: 4.7 µg/m³Auburn, 13 August: 10.7 µg/m³Auburn, 14 August: 11.0 µg/m³Auburn, 15 August: 9.9 µg/m³Auburn, 16 August: 8.5 µg/m³Auburn, 17 August: 8.2 µg/m³Auburn, 18 August: 7.8 µg/m³Auburn, 19 August: 11.0 µg/m³Auburn, 20 August: 70.5 µg/m³, 12× its usual 5.9Auburn, 21 August: 55.8 µg/m³, 9.5× its usual 5.9Auburn, 22 August: 4.4 µg/m³Auburn, 23 August: 5.5 µg/m³Auburn, 24 August: 9.4 µg/m³Auburn, 25 August: 16.7 µg/m³Auburn, 26 August: 27.9 µg/m³, 4.6× its usual 6.1Auburn, 27 August: 24.2 µg/m³Auburn, 28 August: 13.4 µg/m³Auburn, 29 August: 7.7 µg/m³Auburn, 30 August: 4.2 µg/m³Auburn, 31 August: 7.4 µg/m³Auburn, 1 September: 8.9 µg/m³Auburn, 2 September: 9.3 µg/m³Auburn, 3 September: 7.1 µg/m³SquamishSquamish, 12 August: 4.9 µg/m³Squamish, 13 August: 4.9 µg/m³Squamish, 14 August: 6.4 µg/m³Squamish, 15 August: 9.3 µg/m³Squamish, 16 August: no readingSquamish, 17 August: 8.4 µg/m³Squamish, 18 August: 9.1 µg/m³Squamish, 19 August: 14.5 µg/m³Squamish, 20 August: 69.2 µg/m³, 9.5× its usual 7.3Squamish, 21 August: 42.8 µg/m³, 5.9× its usual 7.3Squamish, 22 August: 12.6 µg/m³Squamish, 23 August: 3.8 µg/m³Squamish, 24 August: 12.3 µg/m³Squamish, 25 August: 38.7 µg/m³, 5.4× its usual 7.2Squamish, 26 August: 36.3 µg/m³, 5.0× its usual 7.2Squamish, 27 August: 23.3 µg/m³Squamish, 28 August: 21.6 µg/m³Squamish, 29 August: 11.7 µg/m³Squamish, 30 August: 7.2 µg/m³Squamish, 31 August: 7.4 µg/m³Squamish, 1 September: 8.6 µg/m³Squamish, 2 September: 14.1 µg/m³Squamish, 3 September: 11.0 µg/m³CoquitlamCoquitlam, 12 August: 2.4 µg/m³Coquitlam, 13 August: 6.4 µg/m³Coquitlam, 14 August: 8.1 µg/m³Coquitlam, 15 August: 8.3 µg/m³Coquitlam, 16 August: 5.9 µg/m³Coquitlam, 17 August: 5.6 µg/m³Coquitlam, 18 August: 2.7 µg/m³Coquitlam, 19 August: 11.3 µg/m³Coquitlam, 20 August: 62.5 µg/m³, 12× its usual 5.3Coquitlam, 21 August: 16.4 µg/m³Coquitlam, 22 August: 2.3 µg/m³Coquitlam, 23 August: 3.7 µg/m³Coquitlam, 24 August: 8.9 µg/m³Coquitlam, 25 August: 35.9 µg/m³, 6.4× its usual 5.6Coquitlam, 26 August: 29.5 µg/m³, 5.4× its usual 5.5Coquitlam, 27 August: 22.2 µg/m³Coquitlam, 28 August: 18.8 µg/m³Coquitlam, 29 August: 12.7 µg/m³Coquitlam, 30 August: 5.8 µg/m³Coquitlam, 31 August: 5.4 µg/m³Coquitlam, 1 September: 6.9 µg/m³Coquitlam, 2 September: 10.8 µg/m³Coquitlam, 3 September: 9.6 µg/m³IssaquahIssaquah, 12 August: 1.8 µg/m³Issaquah, 13 August: 5.4 µg/m³Issaquah, 14 August: 5.0 µg/m³Issaquah, 15 August: 4.7 µg/m³Issaquah, 16 August: 4.3 µg/m³Issaquah, 17 August: 4.2 µg/m³Issaquah, 18 August: 4.5 µg/m³Issaquah, 19 August: 9.6 µg/m³Issaquah, 20 August: 60.7 µg/m³, 12× its usual 3.7Issaquah, 21 August: 57.8 µg/m³, 12× its usual 3.5Issaquah, 22 August: 1.8 µg/m³Issaquah, 23 August: 3.8 µg/m³Issaquah, 24 August: 11.2 µg/m³Issaquah, 25 August: 18.7 µg/m³Issaquah, 26 August: 30.1 µg/m³, 6.0× its usual 3.4Issaquah, 27 August: 34.9 µg/m³, 7.0× its usual 3.4Issaquah, 28 August: 19.9 µg/m³Issaquah, 29 August: 8.7 µg/m³Issaquah, 30 August: 4.6 µg/m³Issaquah, 31 August: 6.5 µg/m³Issaquah, 1 September: 9.3 µg/m³Issaquah, 2 September: 8.4 µg/m³Issaquah, 3 September: 6.7 µg/m³White CenterWhite Center, 12 August: 5.4 µg/m³White Center, 13 August: 8.2 µg/m³White Center, 14 August: 9.2 µg/m³White Center, 15 August: 9.9 µg/m³White Center, 16 August: 10.3 µg/m³White Center, 17 August: 9.2 µg/m³White Center, 18 August: 8.4 µg/m³White Center, 19 August: 12.4 µg/m³White Center, 20 August: 60.3 µg/m³, 8.7× its usual 6.9White Center, 21 August: 30.3 µg/m³, 4.4× its usual 6.9White Center, 22 August: 5.1 µg/m³White Center, 23 August: 6.1 µg/m³White Center, 24 August: 10.0 µg/m³White Center, 25 August: 18.9 µg/m³White Center, 26 August: 33.7 µg/m³, 4.7× its usual 7.2White Center, 27 August: 24.6 µg/m³White Center, 28 August: 15.1 µg/m³White Center, 29 August: 8.9 µg/m³White Center, 30 August: 5.5 µg/m³White Center, 31 August: 8.7 µg/m³White Center, 1 September: 8.3 µg/m³White Center, 2 September: 11.8 µg/m³White Center, 3 September: 6.7 µg/m³GibsonsGibsons, 12 August: 4.6 µg/m³Gibsons, 13 August: 5.0 µg/m³Gibsons, 14 August: 5.6 µg/m³Gibsons, 15 August: 7.1 µg/m³Gibsons, 16 August: no readingGibsons, 17 August: 6.4 µg/m³Gibsons, 18 August: 5.1 µg/m³Gibsons, 19 August: 16.2 µg/m³Gibsons, 20 August: 59.5 µg/m³, 9.4× its usual 6.3Gibsons, 21 August: 35.6 µg/m³, 5.7× its usual 6.3Gibsons, 22 August: 5.4 µg/m³Gibsons, 23 August: 4.9 µg/m³Gibsons, 24 August: 9.3 µg/m³Gibsons, 25 August: 39.2 µg/m³, 6.1× its usual 6.4Gibsons, 26 August: 40.7 µg/m³, 6.4× its usual 6.4Gibsons, 27 August: 30.0 µg/m³, 4.8× its usual 6.3Gibsons, 28 August: 23.9 µg/m³Gibsons, 29 August: 13.4 µg/m³Gibsons, 30 August: 8.7 µg/m³Gibsons, 31 August: 9.2 µg/m³Gibsons, 1 September: 9.7 µg/m³Gibsons, 2 September: 15.4 µg/m³Gibsons, 3 September: 10.9 µg/m³GreenGreen, 12 August: 4.1 µg/m³Green, 13 August: 8.5 µg/m³Green, 14 August: 20.8 µg/m³Green, 15 August: 20.9 µg/m³Green, 16 August: 15.4 µg/m³Green, 17 August: 11.5 µg/m³Green, 18 August: 3.8 µg/m³Green, 19 August: 8.9 µg/m³Green, 20 August: 16.7 µg/m³Green, 21 August: 25.4 µg/m³, 5.1× its usual 3.9Green, 22 August: 3.4 µg/m³Green, 23 August: 4.7 µg/m³Green, 24 August: 18.6 µg/m³Green, 25 August: 75.6 µg/m³, 15× its usual 3.7Green, 26 August: 85.0 µg/m³, 17× its usual 3.7Green, 27 August: 202.0 µg/m³, 40× its usual 3.7Green, 28 August: 184.0 µg/m³, 37× its usual 3.7Green, 29 August: 43.3 µg/m³, 8.7× its usual 3.7Green, 30 August: 40.0 µg/m³, 8.0× its usual 3.7Green, 31 August: 78.4 µg/m³, 16× its usual 3.7Green, 1 September: 30.8 µg/m³Green, 2 September: 12.3 µg/m³Green, 3 September: 13.8 µg/m³Fort St. JohnFort St. John, 12 August: 2.3 µg/m³Fort St. John, 13 August: 2.4 µg/m³Fort St. John, 14 August: 5.6 µg/m³Fort St. John, 15 August: 5.1 µg/m³Fort St. John, 16 August: no readingFort St. John, 17 August: 4.7 µg/m³Fort St. John, 18 August: 4.3 µg/m³Fort St. John, 19 August: 5.4 µg/m³Fort St. John, 20 August: 9.3 µg/m³Fort St. John, 21 August: 15.5 µg/m³Fort St. John, 22 August: 22.1 µg/m³Fort St. John, 23 August: 50.4 µg/m³Fort St. John, 24 August: 81.7 µg/m³, 13× its usual 6.2Fort St. John, 25 August: 45.1 µg/m³Fort St. John, 26 August: 43.7 µg/m³, 7.2× its usual 6.1Fort St. John, 27 August: 46.8 µg/m³, 7.7× its usual 6.1Fort St. John, 28 August: 67.1 µg/m³Fort St. John, 29 August: 80.7 µg/m³Fort St. John, 30 August: 69.8 µg/m³Fort St. John, 31 August: 21.7 µg/m³Fort St. John, 1 September: 66.1 µg/m³Fort St. John, 2 September: 155.0 µg/m³Fort St. John, 3 September: 136.0 µg/m³Grande PrairieGrande Prairie, 12 August: 3.1 µg/m³Grande Prairie, 13 August: 4.6 µg/m³Grande Prairie, 14 August: 4.8 µg/m³Grande Prairie, 15 August: 10.6 µg/m³Grande Prairie, 16 August: 8.1 µg/m³Grande Prairie, 17 August: 18.7 µg/m³Grande Prairie, 18 August: 11.2 µg/m³Grande Prairie, 19 August: 5.3 µg/m³Grande Prairie, 20 August: 9.6 µg/m³Grande Prairie, 21 August: 21.1 µg/m³Grande Prairie, 22 August: 21.4 µg/m³Grande Prairie, 23 August: 13.8 µg/m³Grande Prairie, 24 August: 61.7 µg/m³, 7.5× its usual 8.2Grande Prairie, 25 August: 44.0 µg/m³Grande Prairie, 26 August: 38.6 µg/m³, 4.7× its usual 8.3Grande Prairie, 27 August: 48.8 µg/m³, 6.0× its usual 8.2Grande Prairie, 28 August: 81.8 µg/m³Grande Prairie, 29 August: 110.0 µg/m³Grande Prairie, 30 August: 102.0 µg/m³Grande Prairie, 31 August: 33.8 µg/m³Grande Prairie, 1 September: 28.6 µg/m³Grande Prairie, 2 September: 58.7 µg/m³Grande Prairie, 3 September: 160.0 µg/m³Fort McMurrayFort McMurray, 12 August: 8.3 µg/m³Fort McMurray, 13 August: 10.3 µg/m³Fort McMurray, 14 August: 19.0 µg/m³Fort McMurray, 15 August: 9.8 µg/m³Fort McMurray, 16 August: 39.3 µg/m³Fort McMurray, 17 August: 13.2 µg/m³Fort McMurray, 18 August: 53.9 µg/m³Fort McMurray, 19 August: 13.8 µg/m³Fort McMurray, 20 August: 7.5 µg/m³Fort McMurray, 21 August: 9.6 µg/m³Fort McMurray, 22 August: 18.3 µg/m³Fort McMurray, 23 August: 53.7 µg/m³Fort McMurray, 24 August: 76.4 µg/m³Fort McMurray, 25 August: 52.6 µg/m³Fort McMurray, 26 August: 80.6 µg/m³Fort McMurray, 27 August: 193.5 µg/m³, 14× its usual 14.1Fort McMurray, 28 August: 93.9 µg/m³Fort McMurray, 29 August: 65.7 µg/m³Fort McMurray, 30 August: 40.3 µg/m³Fort McMurray, 31 August: 139.0 µg/m³Fort McMurray, 1 September: 72.4 µg/m³Fort McMurray, 2 September: 306.5 µg/m³Fort McMurray, 3 September: 259.0 µg/m³Grand CentreGrand Centre, 12 August: 5.0 µg/m³Grand Centre, 13 August: 5.5 µg/m³Grand Centre, 14 August: 29.1 µg/m³Grand Centre, 15 August: 28.1 µg/m³Grand Centre, 16 August: 13.3 µg/m³Grand Centre, 17 August: 17.4 µg/m³Grand Centre, 18 August: 28.9 µg/m³Grand Centre, 19 August: 16.9 µg/m³Grand Centre, 20 August: 9.6 µg/m³Grand Centre, 21 August: 15.8 µg/m³Grand Centre, 22 August: 24.2 µg/m³Grand Centre, 23 August: 13.7 µg/m³Grand Centre, 24 August: 11.7 µg/m³Grand Centre, 25 August: 27.5 µg/m³Grand Centre, 26 August: 16.3 µg/m³Grand Centre, 27 August: 72.5 µg/m³, 7.6× its usual 9.6Grand Centre, 28 August: 66.8 µg/m³Grand Centre, 29 August: 40.8 µg/m³Grand Centre, 30 August: 40.2 µg/m³Grand Centre, 31 August: 62.0 µg/m³Grand Centre, 1 September: 135.0 µg/m³Grand Centre, 2 September: 214.0 µg/m³Grand Centre, 3 September: 292.0 µg/m³12 Aug1518212427301 Sep2
The 60 cities with the highest readings of 176, in the order the episode reached them, 3 days before to 3 after. Each square is a day, coloured by that day's PM2.5; outlined: at twice the city's usual or more.
Good0–50
Moderate51–100
Unhealthy for sensitive groups101–150
Unhealthy151–200
Very unhealthy201–300
Hazardous301+

Every city it reached

CityDaysHighestUsualAbove usual
KamloopsBritish Columbia, Canada9 597.021 August10.955×
CheneyWashington, United States4 264.020 August5.350×
YrekaCalifornia, United States12 230.028 August4.946×
Grants PassOregon, United States13 214.027 August4.243×
GreenOregon, United States8 202.027 August3.740×
Hood RiverOregon, United States4 188.020 August3.938×
Tri-CitiesWashington, United States3 211.521 August5.837×
PentictonBritish Columbia, Canada9 251.020 August7.135×
HopeBritish Columbia, Canada7 216.020 August6.235×
MeadWashington, United States5 264.019 August7.834×
Walla WallaWashington, United States4 226.020 August7.032×
FinleyWashington, United States3 157.021 August4.631×
PascoWashington, United States3 157.021 August4.531×
KelownaBritish Columbia, Canada8 267.020 August8.930×
The DallesOregon, United States5 174.020 August5.830×
TalentOregon, United States15 149.028 August5.129×
EphrataWashington, United States6 224.020 August7.829×
HermistonOregon, United States3 195.021 August7.028×
SpokaneWashington, United States5 256.019 August9.228×
WenatcheeWashington, United States3 163.021 August5.928×
MedfordOregon, United States15 160.028 August5.828×
Spokane ValleyWashington, United States4 237.019 August9.126×
Airway HeightsWashington, United States3 202.019 August7.826×
Moses LakeWashington, United States5 192.020 August7.625×
AshlandOregon, United States15 159.022 August6.624×
PendletonOregon, United States4 180.020 August7.723×
EllensburgWashington, United States3 145.020 August6.223×
ProsserWashington, United States4 157.021 August7.521×
VernonBritish Columbia, Canada8 201.020 August9.721×
BendOregon, United States14 154.528 August7.521×
CrestonBritish Columbia, Canada5 142.019 August7.020×
YakimaWashington, United States3 141.021 August7.020×
QuincyWashington, United States6 134.020 August6.919×
SandpointIdaho, United States6 183.019 August9.819×
SunnysideWashington, United States4 158.021 August8.618×
ToppenishWashington, United States3 157.021 August8.818×
MadrasOregon, United States9 161.020 August9.118×
ChilliwackBritish Columbia, Canada5 115.020 August6.518×
PullmanWashington, United States3 147.020 August8.617×
CastlegarBritish Columbia, Canada6 142.019 August9.515×
Coeur d'AleneIdaho, United States4 142.019 August9.815×
RedmondOregon, United States14 157.021 August11.214×
Fort McMurrayAlberta, Canada1 193.527 August14.114×
Fort St. JohnBritish Columbia, Canada3 81.724 August6.213×
CranbrookBritish Columbia, Canada5 104.017 August8.412×
IssaquahWashington, United States4 60.720 August3.712×
AuburnWashington, United States3 70.520 August5.912×
EugeneOregon, United States5 59.615 August5.012×
CoquitlamBritish Columbia, Canada3 62.520 August5.312×
LewistonIdaho, United States5 123.020 August10.612×
ShorelineWashington, United States3 59.320 August5.211×
AltamontOregon, United States9 63.228 August5.611×
ParklandWashington, United States2 56.220 August4.211×
Cottage GroveOregon, United States8 55.920 August5.011×
AgassizBritish Columbia, Canada5 66.827 August6.410×
EnumclawWashington, United States2 52.020 August2.510×
MoscowIdaho, United States5 106.020 August10.310×
TacomaWashington, United States2 52.620 August5.49.7×
Mill PlainWashington, United States2 48.420 August2.39.7×
OrchardsWashington, United States2 48.420 August2.39.7×
SquamishBritish Columbia, Canada4 69.220 August7.39.5×
GibsonsBritish Columbia, Canada5 59.520 August6.39.4×
WhistlerBritish Columbia, Canada4 52.121 August5.69.3×
SilvertonOregon, United States1 45.420 August4.49.1×
CanbyOregon, United States1 44.720 August4.98.9×
PrinevilleOregon, United States8 85.620 August9.78.8×
White CenterWashington, United States3 60.320 August6.98.7×
RentonWashington, United States4 52.320 August6.08.7×
West VancouverBritish Columbia, Canada3 45.020 August5.28.7×
Williams LakeBritish Columbia, Canada2 43.722 August4.78.7×
ReddingCalifornia, United States2 52.529 August6.18.6×
UkiahCalifornia, United States2 47.230 August5.58.6×
Sweet HomeOregon, United States5 42.020 August4.38.4×
GreshamOregon, United States1 41.520 August4.48.3×
Crescent CityCalifornia, United States3 41.127 August4.38.2×
StaytonOregon, United States4 41.020 August4.58.2×
BremertonWashington, United States2 41.020 August4.78.2×
VancouverWashington, United States1 40.820 August4.88.2×
Red BluffCalifornia, United States3 49.629 August6.28.0×
HillsboroOregon, United States1 40.020 August3.98.0×
BellevueWashington, United States1 39.620 August4.57.9×
RidgefieldWashington, United States1 39.420 August4.87.9×
Salmon CreekWashington, United States1 39.420 August4.87.9×
Forest GroveOregon, United States1 39.220 August3.27.8×
BeavertonOregon, United States1 39.020 August4.27.8×
PortlandOregon, United States1 38.620 August4.47.7×
Grand CentreAlberta, Canada1 72.527 August9.67.6×
LangfordBritish Columbia, Canada4 38.220 August4.87.6×
Grande PrairieAlberta, Canada3 61.724 August8.27.5×
SeattleWashington, United States3 45.720 August6.27.4×
BurnabyBritish Columbia, Canada3 39.720 August5.47.4×
CentraliaWashington, United States1 36.720 August4.37.3×
ChehalisWashington, United States1 36.720 August4.37.3×
AlbanyOregon, United States3 35.820 August3.97.2×
QuesnelBritish Columbia, Canada6 63.322 August9.17.0×
AbbotsfordBritish Columbia, Canada4 39.720 August5.77.0×
Port CoquitlamBritish Columbia, Canada2 36.520 August5.27.0×
LangleyBritish Columbia, Canada4 35.925 August5.17.0×
TigardOregon, United States1 40.320 August5.86.9×
Strawberry HillBritish Columbia, Canada3 36.726 August5.36.9×
SalemOregon, United States1 34.620 August4.26.9×
SacramentoCalifornia, United States2 35.330 August5.26.8×
Port AngelesWashington, United States2 33.920 August4.56.8×
WoodburnOregon, United States1 33.720 August3.46.7×
North VancouverBritish Columbia, Canada3 35.125 August5.36.6×
LyndenWashington, United States3 36.525 August5.66.5×
CourtenayBritish Columbia, Canada2 32.427 August2.86.5×
Port AlberniBritish Columbia, Canada1 31.720 August4.96.3×
North PortlandOregon, United States1 31.220 August3.36.2×
MilwaukieOregon, United States1 31.120 August3.96.2×
McMinnvilleOregon, United States1 30.620 August3.36.1×
NanaimoBritish Columbia, Canada1 30.227 August4.76.0×
LongviewWashington, United States1 29.720 August4.55.9×
HarewoodBritish Columbia, Canada2 29.627 August4.95.9×
ModestoCalifornia, United States2 34.030 August5.95.8×
VictoriaBritish Columbia, Canada2 32.526 August5.65.8×
DuncanBritish Columbia, Canada2 29.820 August5.15.8×
DallasOregon, United States1 29.020 August2.75.8×
Port TownsendWashington, United States1 29.026 August4.25.8×
WoodlandCalifornia, United States2 35.330 August6.25.7×
VancouverBritish Columbia, Canada2 30.226 August5.35.7×
TracyCalifornia, United States1 28.630 August5.05.7×
AndersonCalifornia, United States2 42.929 August7.65.6×
GaltCalifornia, United States2 31.130 August5.65.6×
SmithersBritish Columbia, Canada1 28.222 August4.45.6×
DeltaBritish Columbia, Canada2 27.326 August4.15.5×
BellinghamWashington, United States3 30.926 August5.75.4×
CorvallisOregon, United States1 27.220 August3.35.4×
SebastopolCalifornia, United States1 26.830 August2.55.4×
MantecaCalifornia, United States1 32.730 August6.35.2×
StocktonCalifornia, United States2 33.430 August6.55.1×
ChicoCalifornia, United States1 32.129 August6.35.1×
WillowsCalifornia, United States1 31.530 August6.25.1×
LaceyWashington, United States1 25.720 August3.25.1×
Campbell RiverBritish Columbia, Canada2 25.526 August2.85.1×
OaklandCalifornia, United States1 25.530 August5.15.0×
SheltonWashington, United States1 25.220 August4.45.0×
RichmondBritish Columbia, Canada1 25.227 August4.95.0×
TurlockCalifornia, United States2 37.931 August7.74.9×
HavreMontana, United States1 31.217 August6.44.9×
Prince GeorgeBritish Columbia, Canada1 47.622 August10.04.8×
Columbia FallsMontana, United States4 43.619 August9.14.8×
GuadalupeCalifornia, United States1 28.329 August5.94.8×
NipomoCalifornia, United States1 28.329 August5.94.8×
Arden-ArcadeCalifornia, United States1 26.330 August5.54.8×
GridleyCalifornia, United States2 31.330 August6.74.7×
MercedCalifornia, United States2 32.031 August6.94.6×
Arroyo GrandeCalifornia, United States1 27.329 August6.04.6×
OceanoCalifornia, United States1 27.329 August6.04.6×
ColusaCalifornia, United States1 33.730 August7.64.4×
Yuba CityCalifornia, United States1 30.830 August7.04.4×
EdmontonAlberta, Canada2 55.227 August12.84.3×
Prince AlbertSaskatchewan, Canada1 46.227 August10.84.3×
HelenaMontana, United States2 41.117 August9.64.3×
LethbridgeAlberta, Canada1 39.817 August9.34.3×
Helena Valley West CentralMontana, United States2 41.117 August9.74.2×
Fort SaskatchewanAlberta, Canada1 41.727 August10.34.0×
San JoseCalifornia, United States2 29.031 August7.34.0×
CalgaryAlberta, Canada2 49.217 August12.63.9×
La GrandeOregon, United States2 35.320 August9.03.9×
AirdrieAlberta, Canada1 34.317 August9.03.8×
Medicine HatAlberta, Canada1 32.317 August8.83.7×
HuronCalifornia, United States1 26.530 August7.13.7×
Rio VistaCalifornia, United States2 35.630 August10.33.5×
Drayton ValleyAlberta, Canada1 31.227 August8.93.5×
ButteMontana, United States1 29.317 August8.33.5×
EdsonAlberta, Canada1 25.327 August7.33.5×
Sherwood ParkAlberta, Canada1 28.527 August8.53.4×
St. AlbertAlberta, Canada1 28.727 August8.93.2×
ReginaSaskatchewan, Canada1 31.827 August10.13.1×
Swift CurrentSaskatchewan, Canada1 25.527 August8.23.1×
SaskatoonSaskatchewan, Canada1 33.127 August11.23.0×
Red DeerAlberta, Canada2 29.827 August10.13.0×
Garden CityIdaho, United States1 29.319 August10.22.9×
MaderaCalifornia, United States2 26.031 August9.42.8×
Flin FlonManitoba, Canada1 33.027 August15.02.2×

Daily means in µg/m³, over the days each city counted in this episode. Highest: its highest of those days. Usual: the city's median for the time of year of that day (its days within 21 days of the date, every year, leaving out the week either side of it). Above usual: its highest day against that, with a usual under 5 µg/m³ taken as 5.

Compared with other episodes in the United States and Canada

Number 8 of 173 episodes in the United States and Canada since our records began, by cities reached.

Bars: cities reached; colour: the level of the episode's highest daily reading. All 173.

Use this page

SmogRank, North-western United States and Canada, August 2023: 176 cities with PM2.5 at twice their usual or more, 15 to 31 August 2023, smogrank.com/episodes/2023-08-north-western-united-states-and-canada (accessed 17 November 2026).
Download top 10 (PNG)

You're welcome to reuse a single chart, image or figure with this citation and a link. Terms.

An episode is a run of days when many cities close to each other (four or more within 350 km on a day, 8 or more in all) each had a daily PM2.5 mean of at least 25 µg/m³ and at least 2 times their usual for that time of year. Found in our own measurements, not picked by hand. How we find episodes. Values are each city's daily mean of its own monitors; causes are the usual kinds for a pattern like this, not a confirmed source. Fire detections from NASA FIRMS; smoke maps from NOAA HMS. Dust: contains modified Copernicus Atmosphere Monitoring Service information 2023. Neither the European Commission nor ECMWF is responsible for any use that may be made of the Copernicus information or data it contains.