SmogRank / Episodes / United States
North-eastern United States and Canada, February 2026
For 6 days, from 14 to 19 February 2026, 96 cities in the United States and Canada had PM2.5 at least twice their usual for the time of year. The worst reading was Lancaster, Pennsylvania, United States: 54.3 µg/m³ on 15 February, about 6.4× its usual 8.5.
Day by day
How it spread
Every city it reached
| City | Days | Highest | Above usual |
|---|---|---|---|
| NepeanOntario, Canada | 1 | 54.017 February | 11× |
| GatineauQuebec, Canada | 1 | 47.317 February | 9.1× |
| NewtonMassachusetts, United States | 1 | 35.918 February | 7.2× |
| SouthfieldMichigan, United States | 3 | 43.515 February | 7.1× |
| LexingtonMassachusetts, United States | 1 | 32.918 February | 6.6× |
| LancasterPennsylvania, United States | 4 | 54.315 February | 6.4× |
| PatersonNew Jersey, United States | 1 | 30.518 February | 6.0× |
| ReadingPennsylvania, United States | 3 | 44.818 February | 5.9× |
| NewmarketOntario, Canada | 1 | 33.517 February | 5.9× |
| SarniaOntario, Canada | 2 | 38.015 February | 5.8× |
| DanburyConnecticut, United States | 1 | 32.018 February | 5.6× |
| AllistonOntario, Canada | 1 | 27.917 February | 5.6× |
| TorontoOntario, Canada | 1 | 37.217 February | 5.6× |
| AlbanyNew York, United States | 2 | 33.318 February | 5.6× |
| CornwallOntario, Canada | 1 | 35.917 February | 5.5× |
| SyracuseNew York, United States | 1 | 27.517 February | 5.5× |
| AllentownPennsylvania, United States | 1 | 35.318 February | 5.4× |
| LebanonPennsylvania, United States | 1 | 44.218 February | 5.4× |
| KingstonOntario, Canada | 1 | 26.717 February | 5.3× |
| OconomowocWisconsin, United States | 3 | 34.014 February | 5.3× |
| MississaugaOntario, Canada | 1 | 31.217 February | 5.3× |
| MolineIllinois, United States | 1 | 34.514 February | 5.2× |
| BethlehemPennsylvania, United States | 2 | 33.418 February | 5.2× |
| Ann ArborMichigan, United States | 2 | 36.015 February | 5.1× |
| BarrieOntario, Canada | 1 | 28.817 February | 5.1× |
| BellevilleOntario, Canada | 1 | 25.517 February | 5.1× |
| HartfordConnecticut, United States | 2 | 30.017 February | 5.1× |
| OakvilleOntario, Canada | 1 | 31.217 February | 5.0× |
| YorkPennsylvania, United States | 4 | 39.015 February | 5.0× |
| EastpointeMichigan, United States | 2 | 38.315 February | 5.0× |
| DavenportIowa, United States | 1 | 32.814 February | 5.0× |
| MiltonOntario, Canada | 1 | 33.717 February | 5.0× |
| Jersey CityNew Jersey, United States | 1 | 27.618 February | 4.9× |
| BramptonOntario, Canada | 1 | 28.317 February | 4.9× |
| LondonOntario, Canada | 3 | 36.114 February | 4.9× |
| WaterburyConnecticut, United States | 1 | 29.018 February | 4.8× |
| AuroraIllinois, United States | 1 | 30.815 February | 4.8× |
| New York CityNew York, United States | 2 | 31.618 February | 4.8× |
| ElginIllinois, United States | 2 | 31.415 February | 4.8× |
| Port HuronMichigan, United States | 2 | 34.915 February | 4.7× |
| DetroitMichigan, United States | 3 | 42.016 February | 4.7× |
| ChathamOntario, Canada | 1 | 30.815 February | 4.7× |
| SpringfieldMassachusetts, United States | 1 | 29.818 February | 4.7× |
| CarlislePennsylvania, United States | 4 | 35.815 February | 4.6× |
| St. ThomasOntario, Canada | 2 | 30.614 February | 4.6× |
| OttawaOntario, Canada | 1 | 26.317 February | 4.5× |
| Fort LeeNew Jersey, United States | 1 | 29.418 February | 4.5× |
| HarrisburgPennsylvania, United States | 4 | 37.815 February | 4.5× |
| Elmwood ParkIllinois, United States | 1 | 32.015 February | 4.4× |
| GuelphOntario, Canada | 1 | 27.617 February | 4.4× |
| WaterdownOntario, Canada | 1 | 27.517 February | 4.4× |
| ChesterPennsylvania, United States | 1 | 30.815 February | 4.3× |
| Grand RapidsMichigan, United States | 3 | 35.115 February | 4.3× |
| WilmingtonDelaware, United States | 2 | 32.315 February | 4.3× |
| KitchenerOntario, Canada | 1 | 28.817 February | 4.3× |
| Des PlainesIllinois, United States | 1 | 29.515 February | 4.3× |
| State CollegePennsylvania, United States | 1 | 27.716 February | 4.3× |
| LindenNew Jersey, United States | 1 | 27.918 February | 4.2× |
| EriePennsylvania, United States | 1 | 26.115 February | 4.2× |
| RockfordIllinois, United States | 2 | 29.814 February | 4.2× |
| Iowa CityIowa, United States | 1 | 29.914 February | 4.2× |
| LansingMichigan, United States | 2 | 29.015 February | 4.1× |
| NorristownPennsylvania, United States | 2 | 29.415 February | 4.1× |
| MilwaukeeWisconsin, United States | 2 | 31.314 February | 4.1× |
| ElizabethNew Jersey, United States | 1 | 31.718 February | 4.1× |
| TaylorMichigan, United States | 3 | 32.715 February | 4.1× |
| Cedar RapidsIowa, United States | 1 | 25.714 February | 4.1× |
| EvanstonIllinois, United States | 2 | 30.515 February | 4.1× |
| PennsaukenNew Jersey, United States | 3 | 30.715 February | 4.0× |
| DearbornMichigan, United States | 2 | 38.715 February | 4.0× |
| ClintonIowa, United States | 1 | 30.214 February | 4.0× |
| WaukeshaWisconsin, United States | 2 | 30.114 February | 4.0× |
| HamiltonOntario, Canada | 1 | 27.217 February | 4.0× |
| WindsorOntario, Canada | 3 | 35.615 February | 3.9× |
| Franklin ParkIllinois, United States | 2 | 32.415 February | 3.9× |
| YpsilantiMichigan, United States | 2 | 30.815 February | 3.9× |
| PawtucketRhode Island, United States | 1 | 25.918 February | 3.8× |
| HollandMichigan, United States | 1 | 26.515 February | 3.7× |
| Lincoln ParkMichigan, United States | 3 | 35.715 February | 3.6× |
| ElkhartIndiana, United States | 1 | 27.615 February | 3.6× |
| WheatonIllinois, United States | 2 | 36.715 February | 3.6× |
| KalamazooMichigan, United States | 2 | 29.716 February | 3.5× |
| OregonOhio, United States | 3 | 32.515 February | 3.5× |
| BrookfieldIllinois, United States | 1 | 28.015 February | 3.5× |
| DoltonIllinois, United States | 1 | 29.315 February | 3.4× |
| Bay CityMichigan, United States | 2 | 28.915 February | 3.4× |
| ChicagoIllinois, United States | 1 | 26.415 February | 3.4× |
| PhiladelphiaPennsylvania, United States | 2 | 27.215 February | 3.4× |
| South MilwaukeeWisconsin, United States | 1 | 26.214 February | 3.2× |
| WyomingMichigan, United States | 1 | 28.615 February | 3.2× |
| ToledoOhio, United States | 3 | 27.915 February | 3.2× |
| RedfordMichigan, United States | 4 | 37.915 February | 3.2× |
| Evergreen ParkIllinois, United States | 1 | 26.115 February | 2.7× |
| CamdenNew Jersey, United States | 1 | 33.115 February | 2.5× |
| AbingtonPennsylvania, United States | 1 | 29.215 February | 2.2× |
| SkokieIllinois, United States | 1 | 29.215 February | 2.1× |
Daily means in µg/m³. Usual: the city's median for this time of year (its days within 21 days of the date, every year, leaving out the week around it). Above usual: its highest day against that.
Against other episodes in the United States and Canada
Number 12 of 106 episodes in the United States and Canada since our records began, by cities reached.
- North-eastern United States and Canada, June and July 2023279
- North-eastern United States and Canada, July 2026264
- North-eastern United States and Canada, May and June 2023260
- North-eastern United States and Canada, July and August 2025241
- North-eastern United States and Canada, July 2023241
- North-eastern United States and Canada, June 2025196
- North-eastern United States and Canada, June 2023161
- North-eastern United States and Canada, July 2025119
- North-western United States and Canada, August 2023110
- North-eastern United States, June 2025104
- North-western United States and Canada, August 202699
- North-eastern United States and Canada, February 202696
Bars: cities reached; colour: the level of the episode's highest daily reading. All 106.
Use this page
SmogRank, North-eastern United States and Canada, February 2026: 96 cities with PM2.5 at twice their usual or more, 14 to 19 February 2026, smogrank.com/episodes/2026-02-north-eastern-united-states-and-canada-2 (accessed 2 October 2026).
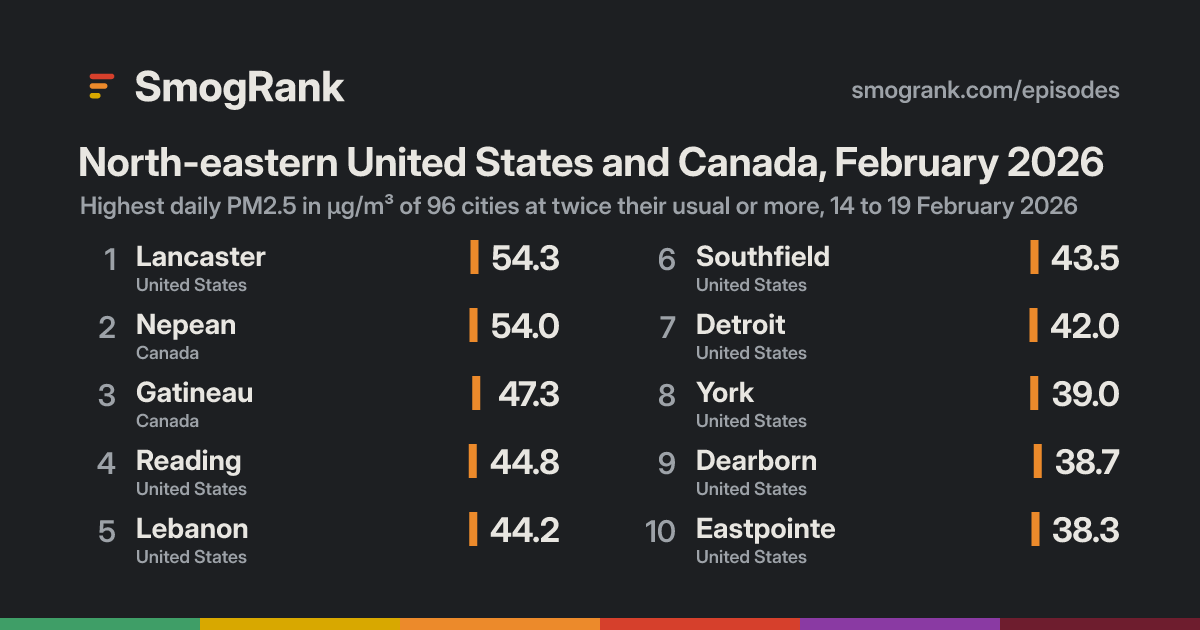
You're welcome to reuse a single chart, image or figure with this citation and a link. Terms.
An episode is a run of days when many cities close to each other (four or more within 350 km on a day, 8 or more in all) each had a daily PM2.5 mean of at least 25 µg/m³ and at least 2 times their usual for that time of year. Found in our own measurements, not picked by hand. How we find episodes. Values are each city's daily mean of its own monitors; causes are the usual kinds for a pattern like this, not a confirmed source.