SmogRank / Episodes / Slovakia
Slovakia, Czechia and Poland, June 2026
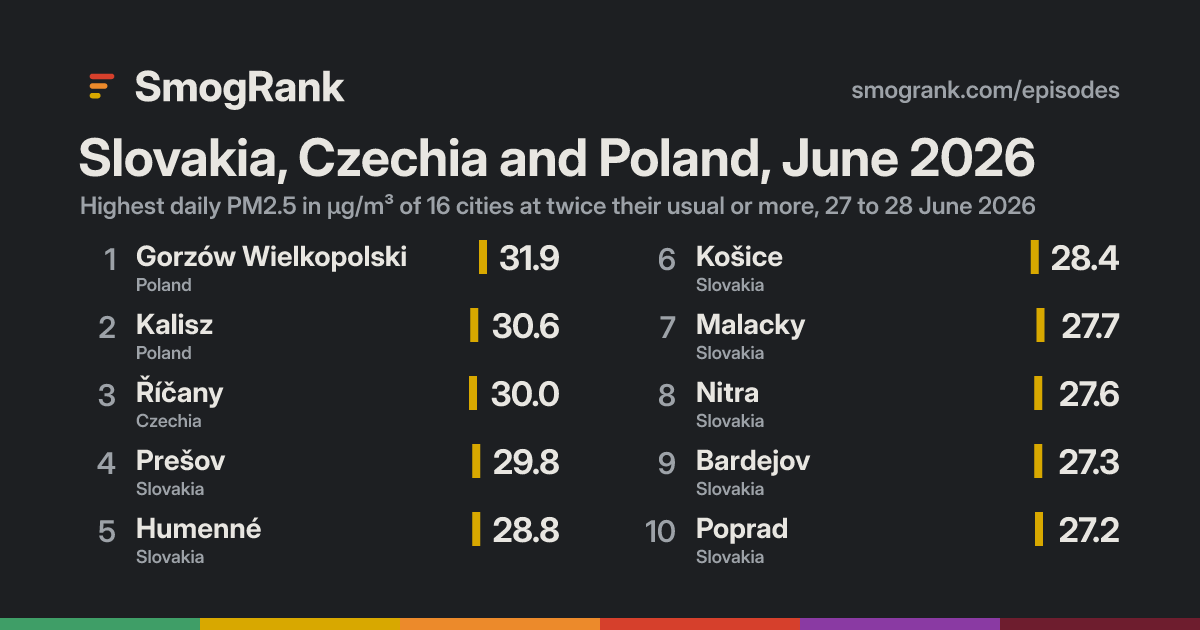
For 2 days, from 27 to 28 June 2026, 16 cities in Slovakia, Czechia and Poland had PM2.5 at least twice their usual for the time of year. The worst reading was Gorzów Wielkopolski, Lubusz, Poland: 31.9 µg/m³ on 28 June, about 4.1× its usual 7.8.
No cause named We have no fire or smoke records for these days, so we only say what the measurements show.
Cities reached 16 in 3 countries
Days 2 27 to 28 June 2026
Worst day 28 June 10 cities counted
Furthest above usual 5.3× Stodůlky
Day by day
Play 28 June 10 cities at twice their usual or more
Kędzierzyn-Koźle Opole Racibórz Jastrzębie Zdrój Brzeg Katowice Czechowice-Dziedzice Bielsko-Biala Wrocław Čadca Żywiec Radomsko Žilina Kłodzko Łask Prievidza Łódź Zgierz Kraków Handlová Partizánske Banská Bystrica Žiar nad Hronom Liptovský Mikuláš Trnava Poznań Sereď Włocławek Pezinok Senec Jelenia Góra Kielce Toruń Płock Devínska Nová Ves Bratislava Lučenec Żyrardów Klosterneuburg Vienna Tarnów Zielona Góra Starachowice Perchtoldsdorf Mödling Radom Pruszków Żary Mielec Dębica Warsaw Legionowo Konstancin-Jeziorna Kazincbarcika Sankt Pölten Ciechanów Jasło Wawer Otwock Miskolc Krosno Eisenhüttenstadt Rzeszów Vranov nad Topľou Cottbus Frankfurt (Oder) Nisko Amstetten Trebišov Snina Lubnjow Nyíregyháza Linz Steyr Ansfelden Traun Lublin Jarosław Schwedt (Oder) Strausberg Przemyśl Wels Königs Wusterhausen Neuenhagen Bernau bei Berlin Blankenfelde-Mahlow Passau Berlin Zamość Luckenwalde Teltow Kleinmachnow Oranienburg Potsdam Falkensee Wittenberg Nauen Altenburg Burghausen Neuruppin Brandenburg an der Havel Bitterfeld-Wolfen Greiz Zeitz Dessau Weiden Gera Marktredwitz Traunreut Schwandorf in Bayern Merseburg Weißenfels Halle (Saale) Köthen Landshut Kelheim Burg bei Magdeburg Bernburg Stendal Wittenberge Prešov Humenné Nitra Košice Púchov Martin Senica Zvolen Ružomberok Kalisz Poprad Malacky Bardejov Gorzów Wielkopolski Říčany Stodůlky 24 Jun 25 26 27 28 29 30 1 Jul Every measured city in the area, coloured by its PM2.5 that day; a dark ring marks a city at twice its usual or more. Bars: cities counted each day, coloured by their median level. Choose a day or press play; without JavaScript, the days link to that day's world ranking.
How it spread
Prešov Prešov, 24 June: 19.9 µg/m³, 1.4× usual Prešov, 25 June: 21.1 µg/m³, 1.5× usual Prešov, 26 June: 29.8 µg/m³, 2.2× usual Prešov, 27 June: 29.4 µg/m³, 2.1× usual Prešov, 28 June: no reading Prešov, 29 June: no reading Prešov, 30 June: no reading Prešov, 1 July: no reading Říčany Říčany, 24 June: 5.4 µg/m³, 0.8× usual Říčany, 25 June: 14.6 µg/m³, 2.0× usual Říčany, 26 June: 25.9 µg/m³, 3.6× usual Říčany, 27 June: 29.4 µg/m³, 4.1× usual Říčany, 28 June: 22.6 µg/m³, 3.1× usual Říčany, 29 June: 24.8 µg/m³, 3.4× usual Říčany, 30 June: 30.0 µg/m³, 4.2× usual Říčany, 1 July: 18.0 µg/m³, 2.5× usual Malacky Malacky, 24 June: 11.8 µg/m³, 1.3× usual Malacky, 25 June: 14.2 µg/m³, 1.5× usual Malacky, 26 June: 22.2 µg/m³, 2.4× usual Malacky, 27 June: 27.7 µg/m³, 3.0× usual Malacky, 28 June: 24.5 µg/m³, 2.7× usual Malacky, 29 June: no reading Malacky, 30 June: no reading Malacky, 1 July: 20.2 µg/m³, 2.2× usual Stodůlky Stodůlky, 24 June: 4.6 µg/m³, 0.9× usual Stodůlky, 25 June: 15.9 µg/m³, 3.2× usual Stodůlky, 26 June: 24.6 µg/m³, 4.9× usual Stodůlky, 27 June: 26.6 µg/m³, 5.3× usual Stodůlky, 28 June: 24.0 µg/m³, 4.8× usual Stodůlky, 29 June: 20.3 µg/m³, 4.1× usual Stodůlky, 30 June: 24.9 µg/m³, 5.0× usual Stodůlky, 1 July: 15.7 µg/m³, 3.1× usual Košice Košice, 24 June: 16.5 µg/m³, 1.3× usual Košice, 25 June: 17.5 µg/m³, 1.4× usual Košice, 26 June: 22.7 µg/m³, 1.8× usual Košice, 27 June: 25.6 µg/m³, 2.1× usual Košice, 28 June: 27.8 µg/m³, 2.2× usual Košice, 29 June: no reading Košice, 30 June: 28.4 µg/m³, 2.3× usual Košice, 1 July: 21.9 µg/m³, 1.8× usual Zvolen Zvolen, 24 June: 15.4 µg/m³, 1.5× usual Zvolen, 25 June: 18.5 µg/m³, 1.8× usual Zvolen, 26 June: 20.0 µg/m³, 1.9× usual Zvolen, 27 June: 25.3 µg/m³, 2.4× usual Zvolen, 28 June: 25.6 µg/m³, 2.4× usual Zvolen, 29 June: no reading Zvolen, 30 June: 26.6 µg/m³, 2.5× usual Zvolen, 1 July: 23.8 µg/m³, 2.3× usual Senica Senica, 24 June: 9.8 µg/m³, 0.9× usual Senica, 25 June: 11.0 µg/m³, 1.1× usual Senica, 26 June: 18.1 µg/m³, 1.7× usual Senica, 27 June: 25.3 µg/m³, 2.4× usual Senica, 28 June: 23.6 µg/m³, 2.3× usual Senica, 29 June: no reading Senica, 30 June: 23.6 µg/m³, 2.3× usual Senica, 1 July: 20.0 µg/m³, 1.9× usual Nitra Nitra, 24 June: 14.3 µg/m³, 1.3× usual Nitra, 25 June: 16.0 µg/m³, 1.4× usual Nitra, 26 June: 20.5 µg/m³, 1.8× usual Nitra, 27 June: 25.2 µg/m³, 2.2× usual Nitra, 28 June: 24.0 µg/m³, 2.1× usual Nitra, 29 June: no reading Nitra, 30 June: 27.6 µg/m³, 2.4× usual Nitra, 1 July: 24.2 µg/m³, 2.1× usual Poprad Poprad, 24 June: 15.9 µg/m³, 1.7× usual Poprad, 25 June: 16.0 µg/m³, 1.7× usual Poprad, 26 June: 20.8 µg/m³, 2.2× usual Poprad, 27 June: 25.1 µg/m³, 2.7× usual Poprad, 28 June: 27.2 µg/m³, 2.9× usual Poprad, 29 June: no reading Poprad, 30 June: 24.3 µg/m³, 2.6× usual Poprad, 1 July: 22.5 µg/m³, 2.4× usual Gorzów Wielkopolski Gorzów Wielkopolski, 24 June: 8.2 µg/m³, 1.1× usual Gorzów Wielkopolski, 25 June: 13.9 µg/m³, 1.8× usual Gorzów Wielkopolski, 26 June: 6.9 µg/m³, 0.9× usual Gorzów Wielkopolski, 27 June: 17.0 µg/m³, 2.2× usual Gorzów Wielkopolski, 28 June: 31.9 µg/m³, 4.1× usual Gorzów Wielkopolski, 29 June: 21.9 µg/m³, 2.8× usual Gorzów Wielkopolski, 30 June: 10.0 µg/m³, 1.3× usual Gorzów Wielkopolski, 1 July: 9.4 µg/m³, 1.2× usual Kalisz Kalisz, 24 June: 11.2 µg/m³, 1.0× usual Kalisz, 25 June: 16.7 µg/m³, 1.4× usual Kalisz, 26 June: 14.1 µg/m³, 1.2× usual Kalisz, 27 June: 17.3 µg/m³, 1.5× usual Kalisz, 28 June: 30.6 µg/m³, 2.6× usual Kalisz, 29 June: 23.5 µg/m³, 2.0× usual Kalisz, 30 June: 14.4 µg/m³, 1.2× usual Kalisz, 1 July: 14.8 µg/m³, 1.3× usual Bardejov Bardejov, 24 June: 14.6 µg/m³, 1.7× usual Bardejov, 25 June: 14.6 µg/m³, 1.7× usual Bardejov, 26 June: 21.9 µg/m³, 2.5× usual Bardejov, 27 June: 22.3 µg/m³, 2.6× usual Bardejov, 28 June: 27.3 µg/m³, 3.1× usual Bardejov, 29 June: no reading Bardejov, 30 June: 25.9 µg/m³, 3.0× usual Bardejov, 1 July: 23.8 µg/m³, 2.7× usual Humenné Humenné, 24 June: 16.8 µg/m³, 1.4× usual Humenné, 25 June: 16.7 µg/m³, 1.4× usual Humenné, 26 June: 21.7 µg/m³, 1.8× usual Humenné, 27 June: 24.9 µg/m³, 2.1× usual Humenné, 28 June: 26.6 µg/m³, 2.2× usual Humenné, 29 June: no reading Humenné, 30 June: 28.8 µg/m³, 2.4× usual Humenné, 1 July: 23.9 µg/m³, 2.0× usual Púchov Púchov, 24 June: 13.9 µg/m³, 1.2× usual Púchov, 25 June: 13.6 µg/m³, 1.2× usual Púchov, 26 June: 19.8 µg/m³, 1.8× usual Púchov, 27 June: 24.1 µg/m³, 2.2× usual Púchov, 28 June: 26.3 µg/m³, 2.3× usual Púchov, 29 June: no reading Púchov, 30 June: 24.6 µg/m³, 2.2× usual Púchov, 1 July: 17.2 µg/m³, 1.5× usual Martin Martin, 24 June: 16.7 µg/m³, 1.5× usual Martin, 25 June: 16.6 µg/m³, 1.5× usual Martin, 26 June: 18.9 µg/m³, 1.7× usual Martin, 27 June: 24.2 µg/m³, 2.2× usual Martin, 28 June: 25.8 µg/m³, 2.4× usual Martin, 29 June: no reading Martin, 30 June: 23.3 µg/m³, 2.2× usual Martin, 1 July: 20.0 µg/m³, 1.9× usual Ružomberok Ružomberok, 24 June: 15.5 µg/m³, 1.5× usual Ružomberok, 25 June: 15.2 µg/m³, 1.5× usual Ružomberok, 26 June: 17.4 µg/m³, 1.7× usual Ružomberok, 27 June: 23.8 µg/m³, 2.4× usual Ružomberok, 28 June: 25.0 µg/m³, 2.5× usual Ružomberok, 29 June: no reading Ružomberok, 30 June: 23.5 µg/m³, 2.3× usual Ružomberok, 1 July: 20.4 µg/m³, 2.0× usual 24 Jun 25 26 27 28 29 30 1 Jul Every counted city, in the order the episode reached them, 3 days before to 3 after. Each square is a day, coloured by that day's PM2.5; outlined: at twice the city's usual or more. Good 0–50
Moderate 51–100
Sensitive groups 101–150
Unhealthy 151–200
Very unhealthy 201–300
Hazardous 301+
Every city it reached
City Days Highest Usual Above usual
Stodůlky Prague, Czechia 1 27 June 5.0 5.3× Říčany Central Bohemia, Czechia 1 30 June 7.2 4.2× Gorzów Wielkopolski Lubusz, Poland 1 28 June 7.8 4.1× Bardejov Prešov Region, Slovakia 1 28 June 8.7 3.1× Malacky Bratislava Region, Slovakia 1 27 June 9.2 3.0× Poprad Prešov Region, Slovakia 2 28 June 9.3 2.9× Kalisz Greater Poland, Poland 1 28 June 11.6 2.6× Zvolen Banská Bystrica Region, Slovakia 2 30 June 10.5 2.5× Ružomberok Žilina Region, Slovakia 1 28 June 10.1 2.5× Nitra Nitra Region, Slovakia 1 30 June 11.3 2.4× Senica Trnava Region, Slovakia 1 27 June 10.4 2.4× Humenné Prešov Region, Slovakia 1 30 June 11.9 2.4× Martin Žilina Region, Slovakia 1 28 June 10.8 2.4× Púchov Trenčín Region, Slovakia 1 28 June 11.2 2.3× Košice Košice Region, Slovakia 2 30 June 12.4 2.3× Prešov Prešov Region, Slovakia 1 26 June 13.8 2.2×
Daily means in µg/m³. Usual: the city's median for this time of year (its days within 21 days of the date, every year, leaving out the week around it). Above usual: its highest day against that.
Against other episodes in Slovakia and Czechia
Number 10 of 18 episodes in Slovakia and Czechia since our records began, by cities reached.
Eastern Europe, December 2023 107 Eastern Europe, March 2023 56 Czechia and Slovakia, November and December 2023 41 Eastern Europe, December 2023 29 Eastern Europe, January 2025 26 Eastern Europe, April 2026 24 Czechia and Austria, October 2023 20 Germany, Slovakia and 2 more countries, June 2023 19 Czechia and Poland, November 2025 17 Slovakia, Czechia and Poland, June 2026 16 Czechia, Slovakia and Austria, December 2023 16 South-eastern Europe, December 2023 16 Bars: cities reached; colour: the level of the episode's highest daily reading. All 18 .
Use this page SmogRank, Slovakia, Czechia and Poland, June 2026: 16 cities with PM2.5 at twice their usual or more, 27 to 28 June 2026, smogrank.com/episodes/2026-06-slovakia-czechia-and-poland (accessed 2 October 2026).
Copy citation Download top 10 (PNG)
You're welcome to reuse a single chart, image or figure with this citation and a link. Terms .
An episode is a run of days when many cities close to each other (four or more within 350 km on a day, 8 or more in all) each had a daily PM2.5 mean of at least 25 µg/m³ and at least 2 times their usual for that time of year. Found in our own measurements, not picked by hand. How we find episodes . Values are each city's daily mean of its own monitors; causes are the usual kinds for a pattern like this, not a confirmed source.