Punjab, Pakistan. PM2.5 from 29 low-cost sensors, updated hourly. Only 23 of them reported in the last 24 hours.
95.5µg/m³
Unhealthy
Latest hour (00:00 UTC), 6.4× the WHO 24-hour guideline. 24-hour average 62.0 µg/m³.
Rank among 1,295 cities
24 hours#7of 1,295, at 62.0 µg/m³
7 days#10of 2,302, at 61.9 µg/m³
30 days#14of 2,311, at 55.6 µg/m³
This year#2of 2,169, at 86.3 µg/m³
Why it ranks here
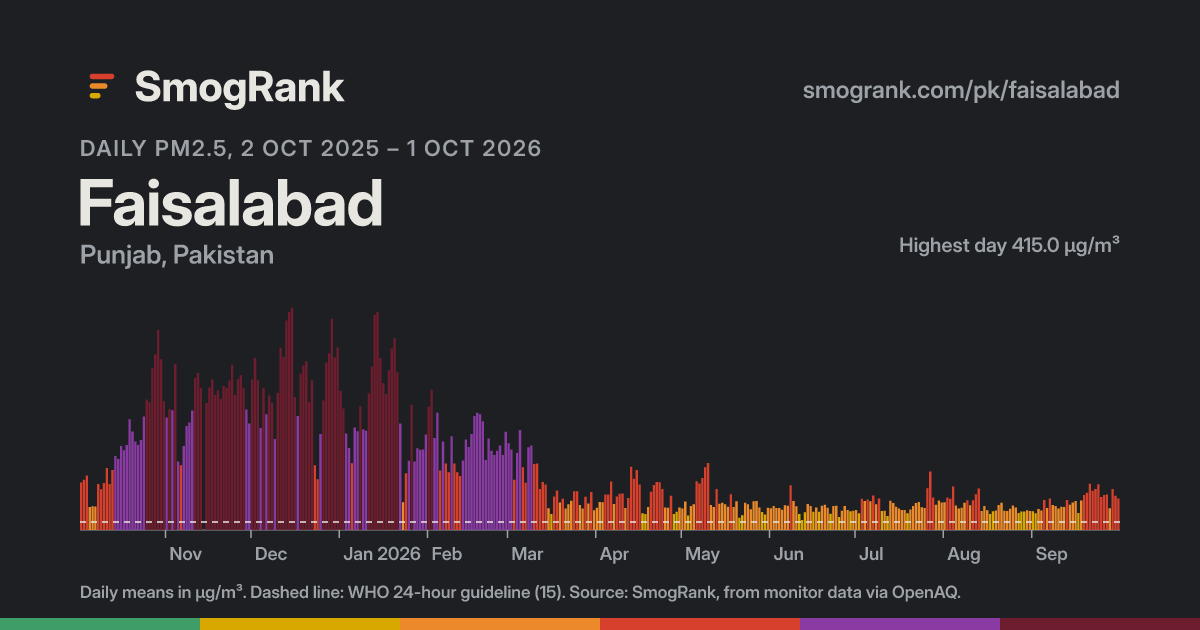
Chronic pollution. Its typical day over the past year was 76.5 µg/m³, 5.1× the WHO 24-hour guideline, so it ranks high most of the time, not only during events.
Seasonal. Over the past year its worst months were January, November, December, averaging up to 276.6 µg/m³ against 41.1 in its cleanest month. Seasonal peaks usually come from heating, crop burning, fire or dust seasons.
Based on Faisalabad's own measurements; causes are the usual kinds for a pattern like this, not a confirmed source.
The last 12 months, day by day
364 of 364 measured days were over the WHO 24-hour guideline (15 µg/m³). One row per month, one square per local day.
Good0–9.0
Moderate9.1–35.4
Sensitive groups35.5–55.4
Unhealthy55.5–125.4
Very unhealthy125.5–225.4
Hazardous225.5+
Last 4 days, hour by hour
Times in UTC. Dashed line: WHO 24-hour guideline (15 µg/m³).
Where it stood each day
Its rank on each day's world board, #1 being the most polluted city that day. The scale is logarithmic: each step down is ten times as many cities. See it among every city.
2026 against 2025, month by month
Faded bars: 2025. A month shows once it has 10 measured days.
This week against past years
Mean PM2.5 for 25 Sept to 1 Oct in each year. Dashed line: WHO 24-hour guideline.
Monitors
29 monitors: 0 reference, 29 low-cost
Station
Operator
Type
Naimat colonyCC BY 4.0
The Urban Unit
Low-cost
FDA-01CC BY 4.0
The Urban Unit
Low-cost
PHA OfficeCC BY 4.0
The Urban Unit
Low-cost
K-Block Gulistan colonyCC BY 4.0
The Urban Unit
Low-cost
WASA OFFICE CC BY 4.0
The Urban Unit
Low-cost
University TownCC BY 4.0
The Urban Unit
Low-cost
FDA-02CC BY 4.0
The Urban Unit
Low-cost
GC universityCC BY 4.0
The Urban Unit
Low-cost
University of Education CC BY 4.0
The Urban Unit
Low-cost
Ayub Agriculture Research InstituteCC BY 4.0
The Urban Unit
Low-cost
Punjab Food AuthorityCC BY 4.0
The Urban Unit
Low-cost
Riphah International UniversityCC BY 4.0
The Urban Unit
Low-cost
University of Agriculture CC BY 4.0
The Urban Unit
Low-cost
Faisalabad Chamber of Commerce CC BY 4.0
The Urban Unit
Low-cost
NFC Institute of Engineering CC BY 4.0
The Urban Unit
Low-cost
people Colony, Small d GroundCC BY 4.0
The Urban Unit
Low-cost
WWF-03 PU EpicAirCC BY 4.0
AirGradient
Low-cost
WWF-04 PU EpicAirCC BY 4.0
AirGradient
Low-cost
WWF-01 PU EpicAirCC BY 4.0
AirGradient
Low-cost
WWF-05 PU EpicAirCC BY 4.0
AirGradient
Low-cost
WWF-06 PU EpicAirCC BY 4.0
AirGradient
Low-cost
WWF-10 PU EpicAirCC BY 4.0
AirGradient
Low-cost
WWF-09 PU EpicAirCC BY 4.0
AirGradient
Low-cost
WWF-05 PU EpicAirCC BY 4.0
Pakistan Air Quality Initiative (PAQI پاکی)
Low-cost
Riphah International UniversityCC BY 4.0
Pakistan Air Quality Initiative (PAQI پاکی)
Low-cost
University of EducationCC BY 4.0
Pakistan Air Quality Initiative (PAQI پاکی)
Low-cost
Faisalabad Gatwala Canal Rd ACC BY 4.0
OpenAQ admin
Low-cost
Faisalabad Raza Garden BCC BY 4.0
OpenAQ admin
Low-cost
Faisalabad Civil Lines BCC BY 4.0
OpenAQ admin
Low-cost
No reference monitor here, so the value is the median of low-cost sensors, when at least a third of them report (two at the least, three always enough). Low-cost sensors can read high in humid air. Data via OpenAQ; licences as listed. How we rank. Embed this on your site.
Use this page
SmogRank, PM2.5 daily means, Faisalabad, Pakistan, 2 Oct 2025 – 1 Oct 2026, smogrank.com/pk/faisalabad (accessed 2 Oct 2026).