SmogRank / Countries / United States / Illinois
Most polluted cities in Illinois, United States
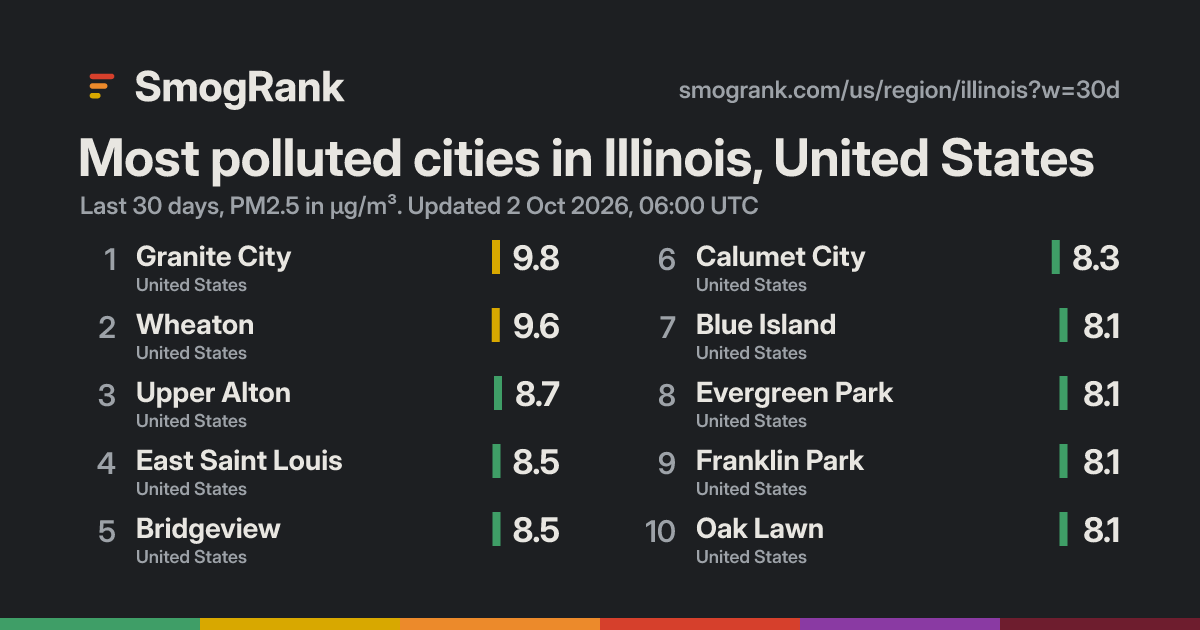
33 measured cities, last 30 days; 0 above the WHO 24-hour guideline. Worst: Granite City at 9.8 µg/m³, #409 in the world.
31 good 2 moderate
- 1Granite City 9.8
- 2Wheatonlow-cost sensors 9.8
- 3Upper Alton 8.8
- 4Bridgeview 8.7
- 5East Saint Louis 8.5
- 6Blue Islandlow-cost sensors 8.4
- 7Calumet City 8.3
- 8Franklin Park 8.3
- 9Oak Lawn 8.3
- 10Evergreen Parklow-cost sensors 8.1
- 11Skokielow-cost sensors 8.1
- 12Nileslow-cost sensors 8.0
- 13Naperville 7.9
- 14Park Ridgelow-cost sensors 7.9
- 15Brookfield 7.7
- 16Peoria 7.7
- 17Decatur 7.6
- 18Evanstonlow-cost sensors 7.5
- 19Dolton 7.4
- 20Chicago 7.1
- 21Champaign 6.9
- 22Elgin 6.9
- 23Springfield 6.7
- 24Bloomington 6.6
- 25Northbrook 6.6
- 26Aurora 6.4
- 27Elmwood Park 6.4
- 28Rockford 6.4
- 29Joliet 6.3
- 30Moline 5.7
- 31Cary 5.6
- 32Des Plaines 5.5
- 33Zion 4.9
Estimated: cities without a monitor
Illinois cities we can't measure, with model estimates for the last 7 days. Listed by population, not ranked: estimates aren't precise enough to rank. Model estimates from the Copernicus Atmosphere Monitoring Service (CAMS), adjusted to measured cities nearby where there are any. Adjusted, a single day lands within ×1.5 of what a monitor would read about two times in three; unadjusted, it can be off by half or double. Treat them as a guide, not a measurement.
| City | 7-day estimate |
|---|---|
| North Peoria | ≈ 6 µg/m³ |
| Waukegan | ≈ 5 µg/m³ |
| Cicero | ≈ 7 µg/m³ |
| Arlington Heights | ≈ 9 µg/m³ |
| Schaumburg | ≈ 8 µg/m³ |
| Bolingbrook | ≈ 9 µg/m³ |
| Palatine | ≈ 9 µg/m³ |
| Orland Park | ≈ 9 µg/m³ |
| Tinley Park | ≈ 8 µg/m³ |
| Berwyn | ≈ 7 µg/m³ |
| Mount Prospect | ≈ 9 µg/m³ |
| Normal | ≈ 6 µg/m³ |
| Oak Park | ≈ 7 µg/m³ |
| Hoffman Estates | ≈ 8 µg/m³ |
| Downers Grove | ≈ 9 µg/m³ |
| Glenview | ≈ 7 µg/m³ |
| Elmhurst | ≈ 9 µg/m³ |
| Lombard | ≈ 9 µg/m³ |
| DeKalb | ≈ 7 µg/m³ |
| Plainfield | ≈ 8 µg/m³ |
| Urbana | ≈ 6 µg/m³ |
| Belleville | ≈ 6 µg/m³ |
| Bartlett | ≈ 8 µg/m³ |
| Buffalo Grove | ≈ 9 µg/m³ |
| Quincy | ≈ 7 µg/m³ |
| Streamwood | ≈ 8 µg/m³ |
| Crystal Lake | ≈ 6 µg/m³ |
| Carol Stream | ≈ 8 µg/m³ |
| Romeoville | ≈ 9 µg/m³ |
| Rock Island | ≈ 8 µg/m³ |
| Carpentersville | ≈ 8 µg/m³ |
| Hanover Park | ≈ 8 µg/m³ |
| Wheeling | ≈ 9 µg/m³ |
| Addison | ≈ 9 µg/m³ |
| Glendale Heights | ≈ 8 µg/m³ |
| Oswego | ≈ 8 µg/m³ |
| Woodridge | ≈ 9 µg/m³ |
| Elk Grove Village | ≈ 9 µg/m³ |
| Pekin | ≈ 5 µg/m³ |
| St. Charles | ≈ 8 µg/m³ |
Use this board
SmogRank, most polluted cities in Illinois, United States, PM2.5, last 30 days to 2 Oct 2026, 00:00 UTC, smogrank.com/us/region/illinois?w=30d.
You're welcome to reuse a single chart, image or figure with this citation and a link. Terms.
Updated 2026-10-02 00:07 UTC. Values are PM2.5 in µg/m³ (fine particles), the median of each city's monitors.