The world's most polluted cities, ranked
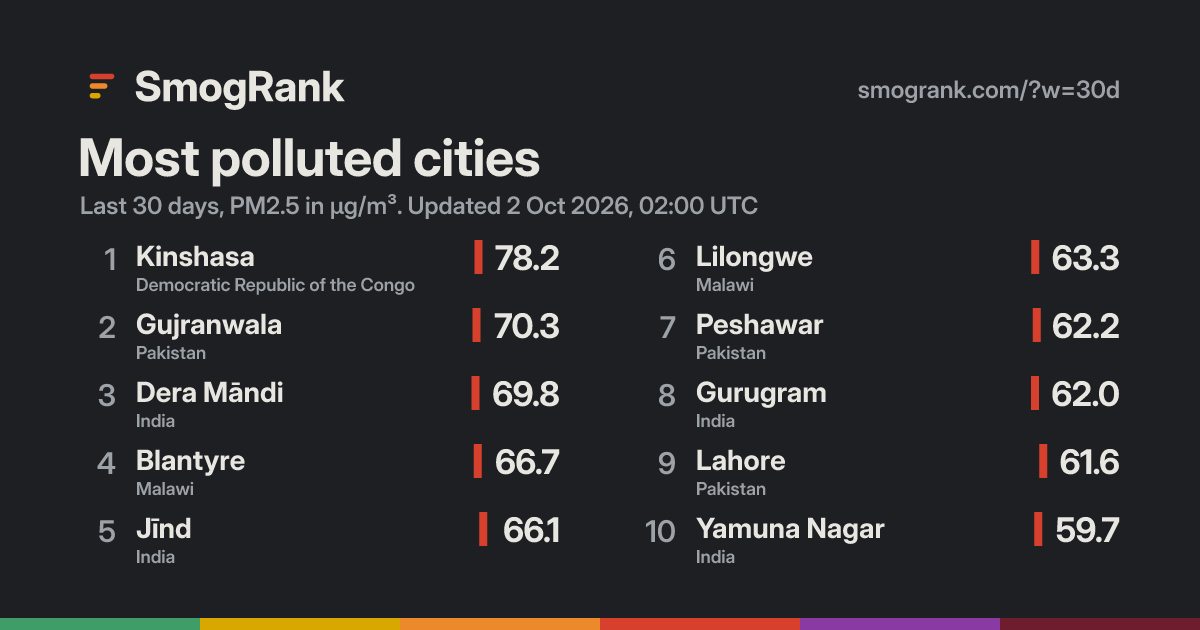
227 of 2,311 measured cities in 84 countries breathed air above the WHO 24-hour guideline of 15 µg/m³ over the last 30 days. The worst was Kinshasa, Democratic Republic of the Congo, at 78.2.
#1,448 Limburg an der Lahn 5.7 µg/m³, more polluted than 36% of 2,311
← Kinshasa 78.2
WHO 24-hour guideline Every ranked city, one column each, worst on the left and cleanest on the right. Point at it to read a city; tap to open it. Rank City Last 30 days, daily µg/m³
1 Kinshasa low-cost sensors Kinshasa, Democratic Republic of the Congo 78.2 2 Gujranwala low-cost sensors Punjab, Pakistan 70.3 3 Dera Māndi Delhi, India 69.8 4 Blantyre low-cost sensors Southern Region, Malawi 66.7 5 Jīnd Haryana, India 66.1 6 Lilongwe low-cost sensors Central Region, Malawi 63.3 7 Peshawar low-cost sensors Khyber Pakhtunkhwa, Pakistan 62.2 8 Gurugram Haryana, India 62.0 9 Lahore low-cost sensors Punjab, Pakistan 61.6 10 Yamuna Nagar Haryana, India 59.7 11 Zomba low-cost sensors Southern Region, Malawi 58.6 12 Kampala low-cost sensors Central Region, Uganda 56.4 13 Multan low-cost sensors Punjab, Pakistan 56.2 14 Faisalabad low-cost sensors Punjab, Pakistan 55.6 15 Jammu low-cost sensors Jammu and Kashmir, India 55.1 16 Noida Uttar Pradesh, India 52.4 17 Kaithal Haryana, India 51.5 18 Sialkot low-cost sensors Punjab, Pakistan 50.9 19 Bhiwadi Rajasthan, India 50.8 20 Dhaka low-cost sensors Dhaka Division, Bangladesh 50.5 21 Singapore low-cost sensors Singapore 49.0 22 Dādri Uttar Pradesh, India 48.8 23 Dhāruhera Haryana, India 48.3 24 Rahim Yar Khan low-cost sensors Punjab, Pakistan 47.4 25 Saint-Louis low-cost sensors Saint-Louis, Senegal 46.1 26 Dubai low-cost sensors Dubai, United Arab Emirates 45.7 27 Queenstown Estate low-cost sensors Singapore 45.5 28 Jalandhar Punjab, India 45.1 29 Bahadurgarh Haryana, India 43.0 30 Faridabad Haryana, India 41.9 30 Chittoor Andhra Pradesh, India 41.9 32 Rawalpindi low-cost sensors Punjab, Pakistan 41.6 33 Bahawalpur low-cost sensors Punjab, Pakistan 41.5 34 Karonga low-cost sensors Northern Region, Malawi 40.7 35 Hāpur Uttar Pradesh, India 40.5 36 Tabanan low-cost sensors Bali, Indonesia 40.4 36 Baddi Himachal Pradesh, India 40.4 38 Dushanbe Dushanbe, Tajikistan 40.1 39 Alipur low-cost sensors Islamabad, Pakistan 39.9 40 Harare low-cost sensors Harare, Zimbabwe 39.6 41 Ambāla Haryana, India 39.5 42 Anantapur Andhra Pradesh, India 39.0 43 Delhi Delhi, India 38.3 44 Thānesar Haryana, India 38.2 45 Sri Ganganagar Rajasthan, India 37.9 46 Sonīpat Haryana, India 37.8 46 Muzaffarnagar Uttar Pradesh, India 37.8 48 Narela Delhi, India 37.5 49 Islamabad low-cost sensors Islamabad, Pakistan 37.4 50 Greater Noida Uttar Pradesh, India 37.3 All 2,311 cities
Good 0–9.0
Moderate 9.1–35.4
Sensitive groups 35.5–55.4
Unhealthy 55.5–125.4
Very unhealthy 125.5–225.4
Hazardous 225.5+
PM2.5 in µg/m³, coloured by the US EPA's PM2.5 categories. Show values as: µg/m³ · US AQI · India AQI · China AQI · European AQI · UK DAQI · Canada AQHI+ . About the scales
Who led, day by day Kinshasa 5 days #1 2026-09-02: 70.1 µg/m³, #6 2026-09-03: 43.2 µg/m³ 2026-09-04: 73.1 µg/m³, #4 2026-09-05: 51.9 µg/m³ 2026-09-06: 78.5 µg/m³, #5 2026-09-07: 111.2 µg/m³, #1 2026-09-08: 138.0 µg/m³, #1 2026-09-09: 58.3 µg/m³ 2026-09-10: 70.7 µg/m³, #5 2026-09-11: 83.0 µg/m³, #1 2026-09-12: 70.9 µg/m³, #3 2026-09-14: 86.5 µg/m³, #3 2026-09-15: 102.1 µg/m³, #3 2026-09-16: 51.1 µg/m³ 2026-09-17: 56.0 µg/m³, #9 2026-09-18: 72.4 µg/m³, #1 2026-09-19: 71.9 µg/m³ 2026-09-20: 73.4 µg/m³ 2026-09-21: 71.2 µg/m³ 2026-09-23: 113.0 µg/m³, #2 2026-09-24: 151.0 µg/m³, #1 2026-09-25: 114.0 µg/m³, #2 2026-09-26: 65.6 µg/m³, #10 2026-09-27: 50.1 µg/m³ 2026-09-28: 58.2 µg/m³ 2026-09-30: 75.5 µg/m³, #4 2026-10-01: 49.9 µg/m³, #9 Gurugram 4 days #1 2026-09-02: 48.7 µg/m³ 2026-09-03: 46.3 µg/m³ 2026-09-04: 30.4 µg/m³ 2026-09-05: 28.9 µg/m³ 2026-09-06: 33.2 µg/m³ 2026-09-07: 45.1 µg/m³ 2026-09-08: 28.8 µg/m³ 2026-09-09: 49.7 µg/m³ 2026-09-10: 57.7 µg/m³ 2026-09-11: 39.0 µg/m³ 2026-09-12: 19.6 µg/m³ 2026-09-13: 24.3 µg/m³ 2026-09-14: 23.9 µg/m³ 2026-09-15: 32.6 µg/m³ 2026-09-16: 21.8 µg/m³ 2026-09-17: 31.4 µg/m³ 2026-09-18: 34.4 µg/m³ 2026-09-19: 181.0 µg/m³, #1 2026-09-20: 212.0 µg/m³, #1 2026-09-21: 144.0 µg/m³, #2 2026-09-22: 51.2 µg/m³ 2026-09-24: 67.3 µg/m³ 2026-09-25: 61.5 µg/m³ 2026-09-26: 86.4 µg/m³, #4 2026-09-27: 109.0 µg/m³, #1 2026-09-28: 104.0 µg/m³, #1 Saint-Louis 3 days #1 2026-09-02: 7.0 µg/m³ 2026-09-03: 5.7 µg/m³ 2026-09-04: 7.2 µg/m³ 2026-09-05: 24.9 µg/m³ 2026-09-06: 17.2 µg/m³ 2026-09-07: 7.4 µg/m³ 2026-09-08: 8.7 µg/m³ 2026-09-09: 145.0 µg/m³, #1 2026-09-12: 12.7 µg/m³ 2026-09-13: 38.3 µg/m³ 2026-09-14: 25.0 µg/m³ 2026-09-17: 231.9 µg/m³, #1 2026-09-18: 53.9 µg/m³, #9 2026-09-19: 26.6 µg/m³ 2026-09-20: 12.3 µg/m³ 2026-09-21: 309.7 µg/m³, #1 2026-09-22: 43.8 µg/m³ 2026-09-23: 51.0 µg/m³ 2026-09-24: 5.1 µg/m³ 2026-09-25: 6.4 µg/m³ 2026-09-26: 24.7 µg/m³ 2026-09-27: 7.3 µg/m³ 2026-09-28: 42.3 µg/m³ 2026-09-29: 8.2 µg/m³ 2026-09-30: 30.3 µg/m³ Dera Māndi 2 days #1 2026-09-02: 69.2 µg/m³, #7 2026-09-03: 88.8 µg/m³, #3 2026-09-04: 76.4 µg/m³, #1 2026-09-05: 68.1 µg/m³, #8 2026-09-06: 42.4 µg/m³ 2026-09-07: 35.9 µg/m³ 2026-09-08: 40.2 µg/m³ 2026-09-09: 55.9 µg/m³ 2026-09-10: 45.4 µg/m³ 2026-09-11: 42.8 µg/m³ 2026-09-12: 45.1 µg/m³ 2026-09-13: 47.5 µg/m³ 2026-09-14: 53.9 µg/m³ 2026-09-15: 70.8 µg/m³, #7 2026-09-16: 57.7 µg/m³, #10 2026-09-17: 74.3 µg/m³, #3 2026-09-18: 54.5 µg/m³, #8 2026-09-19: 85.1 µg/m³, #4 2026-09-20: 147.0 µg/m³, #2 2026-09-21: 102.0 µg/m³, #6 2026-09-22: 94.9 µg/m³, #5 2026-09-23: 90.5 µg/m³, #8 2026-09-24: 122.0 µg/m³, #2 2026-09-25: 158.0 µg/m³, #1 2026-09-26: 40.0 µg/m³ 2026-09-27: 44.0 µg/m³ 2026-09-28: 47.8 µg/m³ 2026-09-29: 53.4 µg/m³ Blantyre 2 days #1 2026-09-02: 105.0 µg/m³, #2 2026-09-03: 80.8 µg/m³, #5 2026-09-04: 64.4 µg/m³, #8 2026-09-05: 91.5 µg/m³, #2 2026-09-06: 119.0 µg/m³, #2 2026-09-07: 69.0 µg/m³, #5 2026-09-08: 27.9 µg/m³ 2026-09-09: 19.6 µg/m³ 2026-09-10: 34.0 µg/m³ 2026-09-11: 54.1 µg/m³ 2026-09-12: 91.4 µg/m³, #2 2026-09-13: 121.0 µg/m³, #1 2026-09-14: 116.0 µg/m³, #1 2026-09-15: 116.0 µg/m³, #2 2026-09-16: 75.3 µg/m³, #4 2026-09-17: 38.7 µg/m³ 2026-09-18: 53.8 µg/m³, #10 2026-09-19: 90.0 µg/m³, #2 2026-09-20: 61.0 µg/m³ 2026-09-21: 58.7 µg/m³ 2026-09-22: 75.0 µg/m³ 2026-09-23: 47.2 µg/m³ 2026-09-24: 70.1 µg/m³ 2026-09-25: 43.2 µg/m³ 2026-09-26: 64.2 µg/m³ 2026-09-27: 49.1 µg/m³ 2026-09-28: 60.5 µg/m³, #8 2026-09-29: 63.9 µg/m³, #7 2026-09-30: 29.6 µg/m³ 2026-10-01: 12.3 µg/m³ Gujranwala 2 days #1 2026-09-02: 48.3 µg/m³ 2026-09-03: 50.9 µg/m³ 2026-09-04: 45.9 µg/m³ 2026-09-05: 63.5 µg/m³, #10 2026-09-06: 51.0 µg/m³ 2026-09-07: 69.1 µg/m³, #4 2026-09-08: 80.0 µg/m³, #2 2026-09-09: 65.9 µg/m³, #8 2026-09-10: 49.4 µg/m³ 2026-09-11: 58.0 µg/m³, #6 2026-09-12: 59.6 µg/m³, #6 2026-09-13: 77.4 µg/m³, #2 2026-09-14: 46.7 µg/m³ 2026-09-15: 45.1 µg/m³ 2026-09-16: 55.2 µg/m³ 2026-09-17: 34.1 µg/m³ 2026-09-18: 46.2 µg/m³ 2026-09-19: 89.2 µg/m³, #3 2026-09-20: 87.6 µg/m³, #5 2026-09-21: 130.0 µg/m³, #3 2026-09-22: 108.5 µg/m³, #1 2026-09-23: 104.0 µg/m³, #3 2026-09-24: 96.4 µg/m³, #5 2026-09-25: 83.0 µg/m³, #6 2026-09-26: 67.8 µg/m³, #9 2026-09-27: 105.5 µg/m³, #2 2026-09-28: 53.9 µg/m³ 2026-09-29: 52.5 µg/m³ 2026-09-30: 81.0 µg/m³, #3 2026-10-01: 104.0 µg/m³, #1 Lilongwe 1 day #1 2026-09-02: 116.0 µg/m³, #1 2026-09-03: 100.0 µg/m³, #2 2026-09-04: 74.8 µg/m³, #3 2026-09-05: 68.6 µg/m³, #7 2026-09-06: 65.6 µg/m³, #8 2026-09-07: 73.3 µg/m³, #3 2026-09-08: 46.4 µg/m³ 2026-09-09: 25.8 µg/m³ 2026-09-10: 37.6 µg/m³ 2026-09-11: 47.4 µg/m³ 2026-09-12: 59.8 µg/m³, #5 2026-09-13: 58.5 µg/m³, #10 2026-09-14: 72.1 µg/m³, #6 2026-09-15: 95.2 µg/m³, #4 2026-09-16: 78.7 µg/m³, #2 2026-09-17: 61.8 µg/m³, #5 2026-09-18: 49.6 µg/m³ 2026-09-19: 61.9 µg/m³ 2026-09-20: 64.1 µg/m³ 2026-09-21: 64.1 µg/m³ 2026-09-22: 95.1 µg/m³, #4 2026-09-23: 94.7 µg/m³, #6 2026-09-24: 62.0 µg/m³ 2026-09-25: 62.1 µg/m³ 2026-09-26: 54.8 µg/m³ 2026-09-27: 41.7 µg/m³ 2026-09-28: 43.2 µg/m³ 2026-09-29: 49.5 µg/m³ 2026-09-30: 48.9 µg/m³ 2026-10-01: 26.9 µg/m³ Smederevo 1 day #1 2026-09-02: 45.2 µg/m³ 2026-09-03: 128.0 µg/m³, #1 2026-09-04: 12.2 µg/m³ 2026-09-05: 10.0 µg/m³ 2026-09-07: 13.5 µg/m³ 2026-09-09: 16.3 µg/m³ 2026-09-10: 16.7 µg/m³ 2026-09-11: 15.2 µg/m³ 2026-09-12: 13.2 µg/m³ 2026-09-14: 15.6 µg/m³ 2026-09-15: 12.6 µg/m³ 2026-09-16: 20.6 µg/m³ 2026-09-17: 20.6 µg/m³ 2026-09-18: 12.3 µg/m³ 2026-09-19: 13.3 µg/m³ 2026-09-21: 13.6 µg/m³ 2026-09-22: 7.9 µg/m³ 2026-09-23: 7.2 µg/m³ 2026-09-24: 10.1 µg/m³ 2026-09-25: 16.0 µg/m³ 2026-09-26: 25.2 µg/m³ 2026-09-27: 22.0 µg/m³ 2026-09-28: 17.3 µg/m³ 2026-09-29: 21.0 µg/m³ 2026-09-30: 17.3 µg/m³ Neelankarai 1 day #1 2026-09-02: 44.2 µg/m³ 2026-09-03: 18.3 µg/m³ 2026-09-04: 16.4 µg/m³ 2026-09-05: 162.0 µg/m³, #1 2026-09-06: 101.0 µg/m³, #3 2026-09-07: 48.1 µg/m³ 2026-09-10: 70.4 µg/m³, #6 2026-09-24: 20.2 µg/m³ 2026-09-25: 16.7 µg/m³ 2026-09-26: 20.6 µg/m³ 2026-09-27: 32.1 µg/m³ 2026-09-28: 30.0 µg/m³ Bhāgalpur 1 day #1 2026-09-02: 78.3 µg/m³, #5 2026-09-03: 63.9 µg/m³, #6 2026-09-04: 69.3 µg/m³, #5 2026-09-05: 62.4 µg/m³ 2026-09-06: 128.0 µg/m³, #1 2026-09-08: 40.7 µg/m³ 2026-09-09: 41.3 µg/m³ 2026-09-10: 70.2 µg/m³, #7 2026-09-13: 12.7 µg/m³ 2026-09-16: 10.1 µg/m³ 2026-09-18: 40.1 µg/m³ 2026-09-19: 60.4 µg/m³ 2026-09-20: 69.7 µg/m³ 2026-09-21: 19.7 µg/m³ 2026-09-22: 34.4 µg/m³ 2026-09-23: 32.3 µg/m³ 2026-09-26: 16.2 µg/m³ Sep 2 Oct 1 Every city that was the world's most polluted on at least one of the last 30 days. Filled square: #1 that day; ring: in the top 10; dot: measured but lower. Each city's own local day. The world's air, last 30 days 2026-09-02: 9 of 2352 cities unhealthy (0%) 2026-09-02: 32 of 2352 cities unhealthy for sensitive groups (1%) 2026-09-02: 732 of 2352 cities moderate (31%) 2026-09-02: 1579 of 2352 cities good (67%) Sep 2 2026-09-03: 1 of 2356 cities very unhealthy (0%) 2026-09-03: 12 of 2356 cities unhealthy (1%) 2026-09-03: 40 of 2356 cities unhealthy for sensitive groups (2%) 2026-09-03: 575 of 2356 cities moderate (24%) 2026-09-03: 1728 of 2356 cities good (73%) 2026-09-04: 12 of 2347 cities unhealthy (1%) 2026-09-04: 28 of 2347 cities unhealthy for sensitive groups (1%) 2026-09-04: 496 of 2347 cities moderate (21%) 2026-09-04: 1811 of 2347 cities good (77%) 2026-09-05: 1 of 2355 cities very unhealthy (0%) 2026-09-05: 12 of 2355 cities unhealthy (1%) 2026-09-05: 26 of 2355 cities unhealthy for sensitive groups (1%) 2026-09-05: 510 of 2355 cities moderate (22%) 2026-09-05: 1806 of 2355 cities good (77%) 2026-09-06: 1 of 2144 cities very unhealthy (0%) 2026-09-06: 10 of 2144 cities unhealthy (0%) 2026-09-06: 35 of 2144 cities unhealthy for sensitive groups (2%) 2026-09-06: 432 of 2144 cities moderate (20%) 2026-09-06: 1666 of 2144 cities good (78%) 2026-09-07: 12 of 2332 cities unhealthy (1%) 2026-09-07: 44 of 2332 cities unhealthy for sensitive groups (2%) 2026-09-07: 419 of 2332 cities moderate (18%) 2026-09-07: 1857 of 2332 cities good (80%) Sep 7 2026-09-08: 1 of 2296 cities very unhealthy (0%) 2026-09-08: 14 of 2296 cities unhealthy (1%) 2026-09-08: 43 of 2296 cities unhealthy for sensitive groups (2%) 2026-09-08: 485 of 2296 cities moderate (21%) 2026-09-08: 1753 of 2296 cities good (76%) 2026-09-09: 1 of 2331 cities very unhealthy (0%) 2026-09-09: 19 of 2331 cities unhealthy (1%) 2026-09-09: 41 of 2331 cities unhealthy for sensitive groups (2%) 2026-09-09: 434 of 2331 cities moderate (19%) 2026-09-09: 1836 of 2331 cities good (79%) 2026-09-10: 14 of 2277 cities unhealthy (1%) 2026-09-10: 43 of 2277 cities unhealthy for sensitive groups (2%) 2026-09-10: 392 of 2277 cities moderate (17%) 2026-09-10: 1828 of 2277 cities good (80%) 2026-09-11: 8 of 2087 cities unhealthy (0%) 2026-09-11: 47 of 2087 cities unhealthy for sensitive groups (2%) 2026-09-11: 392 of 2087 cities moderate (19%) 2026-09-11: 1640 of 2087 cities good (79%) 2026-09-12: 9 of 2141 cities unhealthy (0%) 2026-09-12: 35 of 2141 cities unhealthy for sensitive groups (2%) 2026-09-12: 490 of 2141 cities moderate (23%) 2026-09-12: 1607 of 2141 cities good (75%) 2026-09-13: 12 of 1995 cities unhealthy (1%) 2026-09-13: 41 of 1995 cities unhealthy for sensitive groups (2%) 2026-09-13: 485 of 1995 cities moderate (24%) 2026-09-13: 1457 of 1995 cities good (73%) 2026-09-14: 11 of 2148 cities unhealthy (1%) 2026-09-14: 37 of 2148 cities unhealthy for sensitive groups (2%) 2026-09-14: 418 of 2148 cities moderate (19%) 2026-09-14: 1682 of 2148 cities good (78%) Sep 14 2026-09-15: 1 of 2236 cities very unhealthy (0%) 2026-09-15: 12 of 2236 cities unhealthy (1%) 2026-09-15: 54 of 2236 cities unhealthy for sensitive groups (2%) 2026-09-15: 439 of 2236 cities moderate (20%) 2026-09-15: 1730 of 2236 cities good (77%) 2026-09-16: 12 of 2312 cities unhealthy (1%) 2026-09-16: 50 of 2312 cities unhealthy for sensitive groups (2%) 2026-09-16: 535 of 2312 cities moderate (23%) 2026-09-16: 1715 of 2312 cities good (74%) 2026-09-17: 1 of 2312 cities hazardous (0%) 2026-09-17: 8 of 2312 cities unhealthy (0%) 2026-09-17: 40 of 2312 cities unhealthy for sensitive groups (2%) 2026-09-17: 520 of 2312 cities moderate (22%) 2026-09-17: 1743 of 2312 cities good (75%) 2026-09-18: 6 of 2358 cities unhealthy (0%) 2026-09-18: 31 of 2358 cities unhealthy for sensitive groups (1%) 2026-09-18: 576 of 2358 cities moderate (24%) 2026-09-18: 1745 of 2358 cities good (74%) 2026-09-19: 1 of 2377 cities very unhealthy (0%) 2026-09-19: 23 of 2377 cities unhealthy (1%) 2026-09-19: 53 of 2377 cities unhealthy for sensitive groups (2%) 2026-09-19: 548 of 2377 cities moderate (23%) 2026-09-19: 1752 of 2377 cities good (74%) 2026-09-20: 2 of 2128 cities very unhealthy (0%) 2026-09-20: 31 of 2128 cities unhealthy (1%) 2026-09-20: 44 of 2128 cities unhealthy for sensitive groups (2%) 2026-09-20: 421 of 2128 cities moderate (20%) 2026-09-20: 1630 of 2128 cities good (77%) 2026-09-21: 1 of 2254 cities hazardous (0%) 2026-09-21: 2 of 2254 cities very unhealthy (0%) 2026-09-21: 32 of 2254 cities unhealthy (1%) 2026-09-21: 55 of 2254 cities unhealthy for sensitive groups (2%) 2026-09-21: 396 of 2254 cities moderate (18%) 2026-09-21: 1768 of 2254 cities good (78%) Sep 21 2026-09-22: 34 of 2311 cities unhealthy (1%) 2026-09-22: 65 of 2311 cities unhealthy for sensitive groups (3%) 2026-09-22: 472 of 2311 cities moderate (20%) 2026-09-22: 1740 of 2311 cities good (75%) 2026-09-23: 42 of 2367 cities unhealthy (2%) 2026-09-23: 45 of 2367 cities unhealthy for sensitive groups (2%) 2026-09-23: 453 of 2367 cities moderate (19%) 2026-09-23: 1827 of 2367 cities good (77%) 2026-09-24: 1 of 2370 cities very unhealthy (0%) 2026-09-24: 29 of 2370 cities unhealthy (1%) 2026-09-24: 54 of 2370 cities unhealthy for sensitive groups (2%) 2026-09-24: 581 of 2370 cities moderate (25%) 2026-09-24: 1705 of 2370 cities good (72%) 2026-09-25: 1 of 2338 cities very unhealthy (0%) 2026-09-25: 18 of 2338 cities unhealthy (1%) 2026-09-25: 39 of 2338 cities unhealthy for sensitive groups (2%) 2026-09-25: 694 of 2338 cities moderate (30%) 2026-09-25: 1586 of 2338 cities good (68%) 2026-09-26: 21 of 2359 cities unhealthy (1%) 2026-09-26: 31 of 2359 cities unhealthy for sensitive groups (1%) 2026-09-26: 720 of 2359 cities moderate (31%) 2026-09-26: 1587 of 2359 cities good (67%) 2026-09-27: 16 of 2260 cities unhealthy (1%) 2026-09-27: 29 of 2260 cities unhealthy for sensitive groups (1%) 2026-09-27: 639 of 2260 cities moderate (28%) 2026-09-27: 1576 of 2260 cities good (70%) 2026-09-28: 14 of 2320 cities unhealthy (1%) 2026-09-28: 47 of 2320 cities unhealthy for sensitive groups (2%) 2026-09-28: 685 of 2320 cities moderate (30%) 2026-09-28: 1574 of 2320 cities good (68%) Sep 28 2026-09-29: 15 of 2352 cities unhealthy (1%) 2026-09-29: 54 of 2352 cities unhealthy for sensitive groups (2%) 2026-09-29: 775 of 2352 cities moderate (33%) 2026-09-29: 1508 of 2352 cities good (64%) 2026-09-30: 12 of 2212 cities unhealthy (1%) 2026-09-30: 18 of 2212 cities unhealthy for sensitive groups (1%) 2026-09-30: 681 of 2212 cities moderate (31%) 2026-09-30: 1501 of 2212 cities good (68%) 2026-10-01: 6 of 1397 cities unhealthy (0%) 2026-10-01: 13 of 1397 cities unhealthy for sensitive groups (1%) 2026-10-01: 475 of 1397 cities moderate (34%) 2026-10-01: 903 of 1397 cities good (65%) Oct 1 Each day's ranked cities split by band, worst at the top: a taller red and purple share means a worse day for more of the world, not just one city.
Climbing fastest Movement shows once the board is a day old.
Cleanest air Cities with reference monitors only.
What's missing We rank only cities whose monitor data we're allowed to reuse. The government monitoring networks of China and Turkey publish no terms that allow this, so we leave them out: most cities there are missing here, not clean. The few of their cities that appear are measured by community low-cost sensors, tagged as such. Why .
Use this board SmogRank, most polluted cities, PM2.5, last 30 days to 2 Oct 2026, 02:00 UTC, smogrank.com/?w=30d.
Copy citation Download top 10 (PNG)
You're welcome to reuse a single chart, image or figure with this citation and a link. Terms .
Updated 2026-10-02 02:07 UTC. Values are PM2.5 (fine particles), the median of each city's monitors in µg/m³.