SmogRank / Episodes / United States
North-western United States and Canada, July and August 2026
For 20 days, from 16 July to 4 August 2026, 117 cities in the United States and Canada had PM2.5 at least twice their usual for the time of year. The worst reading was Prineville, Oregon, United States: 168.0 µg/m³ on 21 July, about 29× its usual 5.8. Ended 4 August.
Day by day
On the map: 4,532 fire detections, smoke traced by NOAA.
- Fires, seenHeat satellites detected that day (via NASA FIRMS); bigger and glowing means more detections in the area. Farm burning and other fires count too, not only wildfires.
- Smoke, tracedOutlined by NOAA analysts from satellite images, light to heavy. Traced for North America only; it can be high above the ground.
Under the cities, for each UTC day: fires satellites detected (via NASA FIRMS), smoke NOAA analysts traced and volcanic ash warnings for aircraft. They show what was in the air, not that it caused the readings.
Fires: NASA FIRMS (VIIRS). Traced smoke: NOAA Hazard Mapping System. Volcanic ash: aviation ash warnings (SIGMETs) via NOAA's Aviation Weather Center.
How it spread
Every city it reached
| City | Days | Highest | Above usual |
|---|---|---|---|
| PrinevilleOregon, United States | 16 | 168.021 July | 29× |
| OntarioOregon, United States | 15 | 135.027 July | 22× |
| Spokane ValleyWashington, United States | 8 | 129.017 July | 20× |
| La GrandeOregon, United States | 15 | 122.020 July | 19× |
| Twin FallsIdaho, United States | 6 | 121.027 July | 18× |
| Williams LakeBritish Columbia, Canada | 5 | 87.925 July | 18× |
| CheneyWashington, United States | 1 | 85.83 August | 17× |
| QuincyWashington, United States | 4 | 97.53 August | 17× |
| WenatcheeWashington, United States | 4 | 79.73 August | 16× |
| BoiseIdaho, United States | 14 | 93.327 July | 15× |
| Coeur d'AleneIdaho, United States | 3 | 97.817 July | 15× |
| SpokaneWashington, United States | 7 | 98.117 July | 15× |
| Walla WallaWashington, United States | 9 | 82.921 July | 14× |
| Airway HeightsWashington, United States | 7 | 96.43 August | 14× |
| NampaIdaho, United States | 16 | 119.027 July | 14× |
| Grande PrairieAlberta, Canada | 5 | 94.620 July | 14× |
| Fort St. JohnBritish Columbia, Canada | 3 | 82.321 July | 14× |
| AshlandOregon, United States | 2 | 68.117 July | 13× |
| KamloopsBritish Columbia, Canada | 8 | 146.031 July | 13× |
| Liberty LakeWashington, United States | 5 | 117.017 July | 13× |
| MeadWashington, United States | 6 | 92.53 August | 13× |
| MadrasOregon, United States | 11 | 77.121 July | 13× |
| KelownaBritish Columbia, Canada | 2 | 82.423 July | 12× |
| PendletonOregon, United States | 10 | 75.121 July | 12× |
| RedmondOregon, United States | 5 | 79.323 July | 12× |
| BendOregon, United States | 3 | 59.121 July | 12× |
| TalentOregon, United States | 2 | 58.217 July | 12× |
| Idaho FallsIdaho, United States | 2 | 71.127 July | 12× |
| AltamontOregon, United States | 2 | 62.218 July | 12× |
| Baker CityOregon, United States | 17 | 82.720 July | 11× |
| AirdrieAlberta, Canada | 8 | 85.024 July | 11× |
| EphrataWashington, United States | 7 | 69.93 August | 10× |
| Red DeerAlberta, Canada | 6 | 99.424 July | 10× |
| WeiserIdaho, United States | 13 | 105.026 July | 10× |
| HopeBritish Columbia, Canada | 2 | 56.222 July | 10× |
| VernonBritish Columbia, Canada | 7 | 72.023 July | 9.9× |
| Moses LakeWashington, United States | 5 | 69.63 August | 9.8× |
| PocatelloIdaho, United States | 3 | 59.227 July | 9.7× |
| HavreMontana, United States | 5 | 62.72 August | 9.5× |
| LethbridgeAlberta, Canada | 6 | 86.22 August | 9.3× |
| MedfordOregon, United States | 2 | 48.117 July | 9.3× |
| YakimaWashington, United States | 1 | 47.33 August | 8.3× |
| EllensburgWashington, United States | 2 | 45.13 August | 8.2× |
| CalgaryAlberta, Canada | 9 | 91.324 July | 8.1× |
| Sherwood ParkAlberta, Canada | 5 | 74.621 July | 8.1× |
| EdsonAlberta, Canada | 3 | 57.520 July | 8.1× |
| LoganUtah, United States | 3 | 38.43 August | 7.7× |
| SandpointIdaho, United States | 6 | 67.02 August | 7.6× |
| ChilliwackBritish Columbia, Canada | 2 | 42.222 July | 7.5× |
| CodyWyoming, United States | 1 | 39.03 August | 7.5× |
| MissoulaMontana, United States | 7 | 49.43 August | 7.4× |
| CastlegarBritish Columbia, Canada | 11 | 58.123 July | 7.3× |
| WorlandWyoming, United States | 1 | 36.73 August | 7.3× |
| Columbia FallsMontana, United States | 5 | 65.82 August | 7.2× |
| MeridianIdaho, United States | 3 | 59.23 August | 7.0× |
| Tri-CitiesWashington, United States | 4 | 33.922 July | 6.8× |
| PriceUtah, United States | 2 | 35.63 August | 6.7× |
| Fort SaskatchewanAlberta, Canada | 5 | 76.421 July | 6.6× |
| St. AlbertAlberta, Canada | 5 | 59.821 July | 6.6× |
| Prince GeorgeBritish Columbia, Canada | 3 | 43.621 July | 6.6× |
| CrestonBritish Columbia, Canada | 9 | 43.723 July | 6.4× |
| RivertonWyoming, United States | 1 | 31.43 August | 6.3× |
| ButteMontana, United States | 3 | 41.527 July | 6.2× |
| AgassizBritish Columbia, Canada | 2 | 35.822 July | 6.2× |
| Drayton ValleyAlberta, Canada | 4 | 50.721 July | 6.0× |
| ArvadaColorado, United States | 2 | 39.64 August | 6.0× |
| HermistonOregon, United States | 4 | 33.422 July | 6.0× |
| FinleyWashington, United States | 1 | 29.93 August | 6.0× |
| Cañon CityColorado, United States | 1 | 33.34 August | 5.9× |
| YrekaCalifornia, United States | 2 | 33.217 July | 5.9× |
| Steamboat SpringsColorado, United States | 1 | 31.83 August | 5.8× |
| LittletonColorado, United States | 1 | 29.14 August | 5.8× |
| ToppenishWashington, United States | 2 | 42.93 August | 5.7× |
| The DallesOregon, United States | 2 | 28.63 August | 5.7× |
| EdmontonAlberta, Canada | 5 | 76.321 July | 5.6× |
| QuesnelBritish Columbia, Canada | 4 | 45.321 July | 5.6× |
| PuebloColorado, United States | 1 | 28.14 August | 5.6× |
| AbbotsfordBritish Columbia, Canada | 2 | 27.922 July | 5.6× |
| SunnysideWashington, United States | 2 | 41.83 August | 5.5× |
| CasperWyoming, United States | 1 | 29.03 August | 5.5× |
| Swift CurrentSaskatchewan, Canada | 7 | 51.624 July | 5.4× |
| CranbrookBritish Columbia, Canada | 4 | 40.924 July | 5.4× |
| Hood RiverOregon, United States | 1 | 27.23 August | 5.4× |
| ProsserWashington, United States | 2 | 35.53 August | 5.3× |
| Fort CollinsColorado, United States | 2 | 35.33 August | 5.3× |
| LanderWyoming, United States | 1 | 29.03 August | 5.3× |
| Ken CarylColorado, United States | 1 | 28.54 August | 5.3× |
| PascoWashington, United States | 1 | 26.73 August | 5.3× |
| Medicine HatAlberta, Canada | 8 | 51.32 August | 5.2× |
| PullmanWashington, United States | 9 | 38.83 August | 5.2× |
| BillingsMontana, United States | 3 | 36.63 August | 5.0× |
| LockwoodMontana, United States | 3 | 36.63 August | 5.0× |
| BoulderColorado, United States | 2 | 32.33 August | 5.0× |
| Colorado SpringsColorado, United States | 1 | 30.74 August | 4.9× |
| GilletteWyoming, United States | 1 | 35.23 August | 4.8× |
| LewistownMontana, United States | 4 | 40.527 July | 4.7× |
| WindsorColorado, United States | 2 | 28.84 August | 4.7× |
| Fort McMurrayAlberta, Canada | 3 | 83.220 July | 4.6× |
| Grand CentreAlberta, Canada | 3 | 58.321 July | 4.6× |
| HelenaMontana, United States | 3 | 41.227 July | 4.6× |
| Helena Valley West CentralMontana, United States | 3 | 41.227 July | 4.6× |
| MoscowIdaho, United States | 6 | 41.53 August | 4.5× |
| DenverColorado, United States | 1 | 29.54 August | 4.5× |
| LewistonIdaho, United States | 12 | 38.727 July | 4.4× |
| West JordanUtah, United States | 1 | 35.93 August | 4.4× |
| ThorntonColorado, United States | 1 | 31.84 August | 4.3× |
| LongmontColorado, United States | 2 | 31.43 August | 4.3× |
| GlendiveMontana, United States | 2 | 32.927 July | 4.0× |
| SheridanWyoming, United States | 1 | 31.23 August | 4.0× |
| Great FallsMontana, United States | 6 | 48.427 July | 3.8× |
| BozemanMontana, United States | 1 | 28.53 August | 3.8× |
| GreeleyColorado, United States | 1 | 26.04 August | 3.7× |
| EstevanSaskatchewan, Canada | 3 | 48.32 August | 3.5× |
| Rapid CitySouth Dakota, United States | 1 | 28.73 August | 3.2× |
| SmithfieldUtah, United States | 1 | 25.23 August | 3.1× |
| ReginaSaskatchewan, Canada | 2 | 35.92 August | 2.7× |
| Prince AlbertSaskatchewan, Canada | 1 | 44.921 July | 2.2× |
Daily means in µg/m³, over the days each city counted in this episode. Highest: its highest of those days. Usual: the city's median for the time of year of that day (its days within 21 days of the date, every year, leaving out the week either side of it). Above usual: its highest day against that, with a usual under 5 µg/m³ taken as 5.
Compared with other episodes in the United States and Canada
Number 12 of 173 episodes in the United States and Canada since our records began, by cities reached.
- Eastern United States and Canada, June and July 2023343
- Northern United States and Canada, July 2026328
- United States and Canada, July 2023322
- Eastern United States and Canada, May and June 2023317
- North-eastern United States and Canada, 29 July to 9 August 2025292
- Northern United States and Canada, May and June 2025247
- United States and Canada, June 2023195
- North-western United States and Canada, August 2023176
- North-western United States and Canada, 4 to 22 August 2026149
- Northern United States and Canada, July 2025140
- Northern United States and Canada, June 2025134
- North-western United States and Canada, July and August 2026117
Bars: cities reached; colour: the level of the episode's highest daily reading. All 173.
Use this page
SmogRank, North-western United States and Canada, July and August 2026: 117 cities with PM2.5 at twice their usual or more, 16 July to 4 August 2026, smogrank.com/episodes/2026-07-north-western-united-states-and-canada (accessed 17 November 2026).
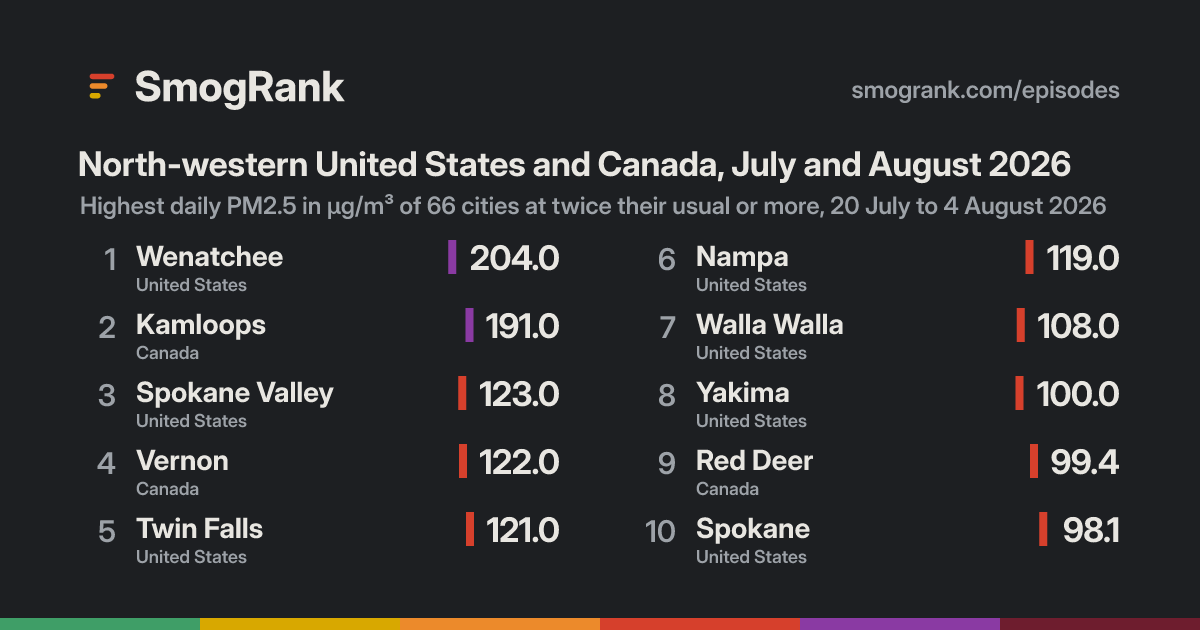
You're welcome to reuse a single chart, image or figure with this citation and a link. Terms.
An episode is a run of days when many cities close to each other (four or more within 350 km on a day, 8 or more in all) each had a daily PM2.5 mean of at least 25 µg/m³ and at least 2 times their usual for that time of year. Found in our own measurements, not picked by hand. How we find episodes. Values are each city's daily mean of its own monitors; causes are the usual kinds for a pattern like this, not a confirmed source. Fire detections from NASA FIRMS; smoke maps from NOAA HMS. Dust: contains modified Copernicus Atmosphere Monitoring Service information 2026. Neither the European Commission nor ECMWF is responsible for any use that may be made of the Copernicus information or data it contains.