SmogRank / Episodes / United States

Texas and Louisiana, United States, January 2024

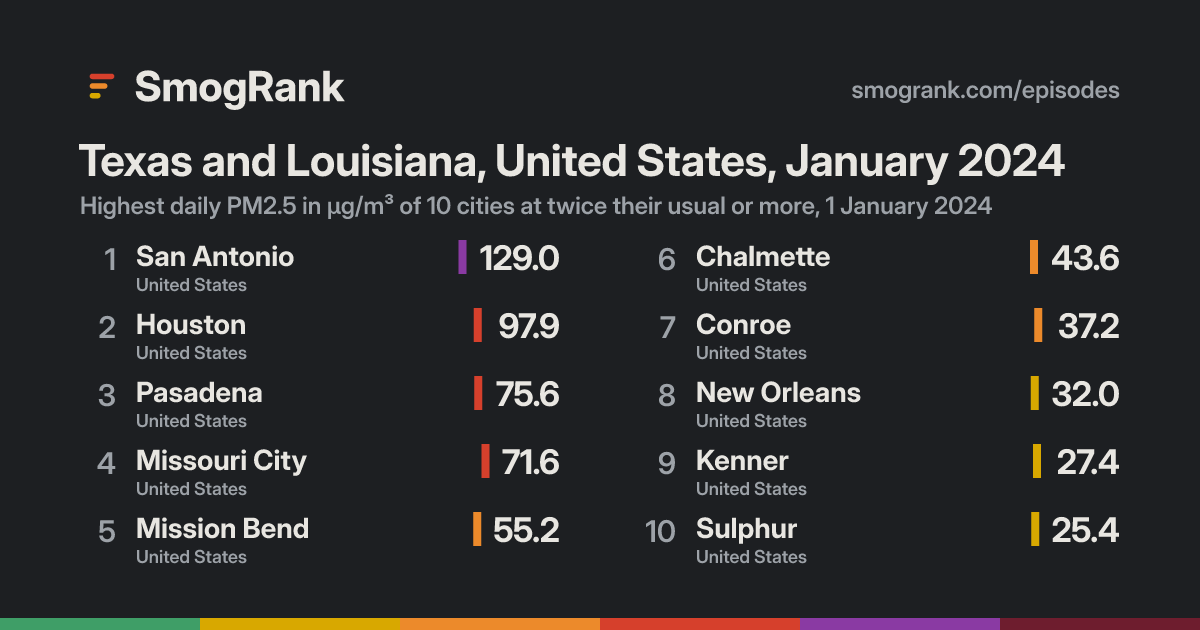
For 1 day, on 1 January 2024, 10 cities in the United States had PM2.5 at least twice their usual for the time of year. The worst reading was San Antonio, Texas, United States: 129.0 µg/m³ on 1 January, about 17× its usual 7.7.

Likely New Year fireworksIt came on the night of 31 December, when smoke from fireworks often fills the air over many cities at once.
Cities reached10in 1 country
Days11 January 2024
Worst day1 January10 cities counted
Furthest above usual17×San Antonio

Day by day

1 January 10 cities at twice their usual or more
Port ArthurBaytownGalvestonLa PorteCollege StationLafayetteBaton RougeCorsicanaBeltonAustinCorpus ChristiLive OakJacksonHattiesburgSulphurConroeKennerNew OrleansChalmetteMission BendPasadenaMissouri CityHoustonSan Antonio
29 Dec30311 Jan234
Every measured city in the area, coloured by its PM2.5 that day; a dark ring marks a city at twice its usual or more. Bars: cities counted each day, coloured by their median level. Choose a day or press play; without JavaScript, the days link to that day's world ranking.

How it spread

San AntonioSan Antonio, 29 December: 6.8 µg/m³, 0.9× usualSan Antonio, 30 December: 15.4 µg/m³, 2.0× usualSan Antonio, 31 December: 60.2 µg/m³, 7.8× usualSan Antonio, 1 January: 129.0 µg/m³, 17× usualSan Antonio, 2 January: 8.6 µg/m³, 1.1× usualSan Antonio, 3 January: 5.3 µg/m³, 0.7× usualSan Antonio, 4 January: 8.1 µg/m³, 1.1× usualConroeConroe, 29 December: 6.0 µg/m³, 0.7× usualConroe, 30 December: 9.3 µg/m³, 1.0× usualConroe, 31 December: 33.0 µg/m³, 3.6× usualConroe, 1 January: 37.2 µg/m³, 4.1× usualConroe, 2 January: 10.2 µg/m³, 1.1× usualConroe, 3 January: 8.3 µg/m³, 0.9× usualConroe, 4 January: 9.8 µg/m³, 1.1× usualHoustonHouston, 29 December: 9.5 µg/m³, 0.9× usualHouston, 30 December: 13.3 µg/m³, 1.2× usualHouston, 31 December: 12.1 µg/m³, 1.1× usualHouston, 1 January: 97.9 µg/m³, 9.1× usualHouston, 2 January: 9.6 µg/m³, 0.9× usualHouston, 3 January: 9.4 µg/m³, 0.9× usualHouston, 4 January: 11.9 µg/m³, 1.1× usualPasadenaPasadena, 29 December: 9.5 µg/m³, 1.0× usualPasadena, 30 December: 12.3 µg/m³, 1.3× usualPasadena, 31 December: 12.6 µg/m³, 1.4× usualPasadena, 1 January: 75.6 µg/m³, 8.2× usualPasadena, 2 January: 8.7 µg/m³, 0.9× usualPasadena, 3 January: 8.6 µg/m³, 0.9× usualPasadena, 4 January: 8.5 µg/m³, 0.9× usualMissouri CityMissouri City, 29 December: 7.9 µg/m³, 0.9× usualMissouri City, 30 December: 10.6 µg/m³, 1.2× usualMissouri City, 31 December: 11.7 µg/m³, 1.4× usualMissouri City, 1 January: 71.6 µg/m³, 8.4× usualMissouri City, 2 January: 10.1 µg/m³, 1.2× usualMissouri City, 3 January: 10.1 µg/m³, 1.2× usualMissouri City, 4 January: 11.2 µg/m³, 1.3× usualMission BendMission Bend, 29 December: 5.2 µg/m³, 0.7× usualMission Bend, 30 December: 6.4 µg/m³, 0.9× usualMission Bend, 31 December: 10.1 µg/m³, 1.4× usualMission Bend, 1 January: 55.2 µg/m³, 7.6× usualMission Bend, 2 January: 8.1 µg/m³, 1.1× usualMission Bend, 3 January: 7.8 µg/m³, 1.1× usualMission Bend, 4 January: 10.6 µg/m³, 1.5× usualChalmetteChalmette, 29 December: 10.0 µg/m³, 1.6× usualChalmette, 30 December: 13.1 µg/m³, 2.1× usualChalmette, 31 December: 17.0 µg/m³, 2.7× usualChalmette, 1 January: 43.6 µg/m³, 7.0× usualChalmette, 2 January: 4.6 µg/m³, 0.7× usualChalmette, 3 January: 6.5 µg/m³, 1.0× usualChalmette, 4 January: 7.5 µg/m³, 1.2× usualNew OrleansNew Orleans, 29 December: 9.3 µg/m³, 1.9× usualNew Orleans, 30 December: 10.6 µg/m³, 2.1× usualNew Orleans, 31 December: 12.4 µg/m³, 2.5× usualNew Orleans, 1 January: 32.0 µg/m³, 6.4× usualNew Orleans, 2 January: 3.5 µg/m³, 0.7× usualNew Orleans, 3 January: 5.4 µg/m³, 1.1× usualNew Orleans, 4 January: 6.2 µg/m³, 1.2× usualKennerKenner, 29 December: 11.2 µg/m³, 1.7× usualKenner, 30 December: 11.7 µg/m³, 1.8× usualKenner, 31 December: 21.8 µg/m³, 3.4× usualKenner, 1 January: 27.4 µg/m³, 4.2× usualKenner, 2 January: 5.0 µg/m³, 0.8× usualKenner, 3 January: 7.0 µg/m³, 1.1× usualKenner, 4 January: 9.5 µg/m³, 1.5× usualSulphurSulphur, 29 December: 9.1 µg/m³, 1.3× usualSulphur, 30 December: 12.9 µg/m³, 1.8× usualSulphur, 31 December: 18.7 µg/m³, 2.6× usualSulphur, 1 January: 25.4 µg/m³, 3.6× usualSulphur, 2 January: 9.3 µg/m³, 1.3× usualSulphur, 3 January: 9.6 µg/m³, 1.4× usualSulphur, 4 January: 13.6 µg/m³, 1.9× usual29 Dec30311 Jan234
Every counted city, in the order the episode reached them, 3 days before to 3 after. Each square is a day, coloured by that day's PM2.5; outlined: at twice the city's usual or more.
Good0–50
Moderate51–100
Sensitive groups101–150
Unhealthy151–200
Very unhealthy201–300
Hazardous301+

Every city it reached

CityDaysHighestUsualAbove usual
San AntonioTexas, United States1 129.01 January7.717×
HoustonTexas, United States1 97.91 January10.89.1×
Missouri CityTexas, United States1 71.61 January8.58.4×
PasadenaTexas, United States1 75.61 January9.28.2×
Mission BendTexas, United States1 55.21 January7.37.6×
ChalmetteLouisiana, United States1 43.61 January6.27.0×
New OrleansLouisiana, United States1 32.01 January4.96.4×
KennerLouisiana, United States1 27.41 January6.54.2×
ConroeTexas, United States1 37.21 January9.14.1×
SulphurLouisiana, United States1 25.41 January7.13.6×

Daily means in µg/m³. Usual: the city's median for this time of year (its days within 21 days of the date, every year, leaving out the week around it). Above usual: its highest day against that.

Against other episodes in the United States

Number 96 of 131 episodes in the United States since our records began, by cities reached.

Bars: cities reached; colour: the level of the episode's highest daily reading. All 131.

Use this page

SmogRank, Texas and Louisiana, United States, January 2024: 10 cities with PM2.5 at twice their usual or more, 1 January 2024, smogrank.com/episodes/2024-01-texas-and-louisiana-united-states (accessed 3 October 2026).

Download top 10 (PNG)

You're welcome to reuse a single chart, image or figure with this citation and a link. Terms.

An episode is a run of days when many cities close to each other (four or more within 350 km on a day, 8 or more in all) each had a daily PM2.5 mean of at least 25 µg/m³ and at least 2 times their usual for that time of year. Found in our own measurements, not picked by hand. How we find episodes. Values are each city's daily mean of its own monitors; causes are the usual kinds for a pattern like this, not a confirmed source.