SmogRank / Episodes / United States

Southern United States and Mexico, July and August 2024

For 3 days, from 31 July to 2 August 2024, 56 cities in the United States and Mexico had PM2.5 at least twice their usual for the time of year. The worst reading was West Memphis, Arkansas, United States: 46.6 µg/m³ on 1 August, about 3.7× its usual 12.5.

No cause namedWe have no fire or smoke records for these days, so we only say what the measurements show.
Cities reached56in 2 countries
Days331 July to 2 August 2024
Worst day1 August36 cities counted
Furthest above usual4.5×Bartlett

Day by day

1 August 36 cities at twice their usual or more
SulphurKennerNew OrleansChalmetteHattiesburgGulfportPascagoulaPrichardFairhopeWest PensacolaDallasFerry PassMidwayMontgomeryTrussvilleDecaturHuntsvilleGadsdenClarksvilleColumbusNashvillePonca CityHendersonvilleTallahasseeAlbanyKennesawAtlantaCandler-McAfeeCookevilleWarner RobinsMaconValdostaAthensMaryvilleCiudad Benito JuárezKnoxvilleEast LakeSafety HarborLubbockSarasotaAmarilloAshevilleKingsportTulsaBaytownHoustonSpringdalePhenix CityBaton RougeTexarkanaGalvestonMissouri CityPasadenaLa PorteJenksDentonFort WorthConroeLaredoEagle PassPort ArthurSaginawCorsicanaEdinburgLittle RockChattanoogaJacksonJacksonBeltonOklahoma CityMission BendHeroica MatamorosAustinEast RidgeLawtonMissionShreveportColumbiaLawrencevilleCollege StationGainesvilleTaylorEdmondMooreMcDonoughLafayetteMcAlesterCorpus ChristiWest MemphisBessemerDyersburgLive OakAdaHernandoBirminghamFort SmithGeorgetownSan MarcosBartlett
28 Jul2930311 Aug2345
Every measured city in the area, coloured by its PM2.5 that day; a dark ring marks a city at twice its usual or more. Bars: cities counted each day, coloured by their median level. Choose a day or press play; without JavaScript, the days link to that day's world ranking.

How it spread

Corpus ChristiCorpus Christi, 28 July: 7.7 µg/m³Corpus Christi, 29 July: 12.9 µg/m³Corpus Christi, 30 July: 26.1 µg/m³Corpus Christi, 31 July: 39.7 µg/m³, 3.7× its usual 10.8Corpus Christi, 1 August: 19.1 µg/m³Corpus Christi, 2 August: 6.2 µg/m³Corpus Christi, 3 August: 5.9 µg/m³Corpus Christi, 4 August: 7.4 µg/m³Corpus Christi, 5 August: 10.2 µg/m³MissionMission, 28 July: 9.1 µg/m³Mission, 29 July: 12.5 µg/m³Mission, 30 July: 26.3 µg/m³Mission, 31 July: 37.8 µg/m³, 3.4× its usual 11.1Mission, 1 August: 16.3 µg/m³Mission, 2 August: 6.2 µg/m³Mission, 3 August: 14.9 µg/m³Mission, 4 August: 20.0 µg/m³Mission, 5 August: 15.2 µg/m³ShreveportShreveport, 28 July: 11.2 µg/m³Shreveport, 29 July: 9.8 µg/m³Shreveport, 30 July: 13.0 µg/m³Shreveport, 31 July: 36.7 µg/m³, 3.1× its usual 11.8Shreveport, 1 August: 39.9 µg/m³, 3.4× its usual 11.8Shreveport, 2 August: 27.3 µg/m³, 2.3× its usual 12.0Shreveport, 3 August: 19.2 µg/m³Shreveport, 4 August: 11.7 µg/m³Shreveport, 5 August: 15.1 µg/m³Live OakLive Oak, 28 July: 5.6 µg/m³Live Oak, 29 July: 11.1 µg/m³Live Oak, 30 July: 17.3 µg/m³Live Oak, 31 July: 36.3 µg/m³, 3.8× its usual 9.5Live Oak, 1 August: 28.4 µg/m³, 3.0× its usual 9.4Live Oak, 2 August: 7.9 µg/m³Live Oak, 3 August: 5.6 µg/m³Live Oak, 4 August: 8.1 µg/m³Live Oak, 5 August: 9.7 µg/m³LaredoLaredo, 28 July: no readingLaredo, 29 July: no readingLaredo, 30 July: 16.6 µg/m³Laredo, 31 July: 36.3 µg/m³, 3.1× its usual 11.7Laredo, 1 August: 23.2 µg/m³Laredo, 2 August: 2.6 µg/m³Laredo, 3 August: 4.9 µg/m³Laredo, 4 August: 8.3 µg/m³Laredo, 5 August: 11.5 µg/m³AustinAustin, 28 July: 6.1 µg/m³Austin, 29 July: 9.4 µg/m³Austin, 30 July: 15.2 µg/m³Austin, 31 July: 35.4 µg/m³, 3.3× its usual 10.8Austin, 1 August: 28.7 µg/m³, 2.7× its usual 10.7Austin, 2 August: 8.7 µg/m³Austin, 3 August: 7.1 µg/m³Austin, 4 August: 7.9 µg/m³Austin, 5 August: 12.7 µg/m³ConroeConroe, 28 July: 8.2 µg/m³Conroe, 29 July: 8.9 µg/m³Conroe, 30 July: 19.9 µg/m³Conroe, 31 July: 35.4 µg/m³, 3.1× its usual 11.6Conroe, 1 August: 29.5 µg/m³, 2.5× its usual 11.6Conroe, 2 August: 12.0 µg/m³Conroe, 3 August: 11.0 µg/m³Conroe, 4 August: 19.5 µg/m³Conroe, 5 August: 23.7 µg/m³HoustonHouston, 28 July: 8.1 µg/m³Houston, 29 July: 8.4 µg/m³Houston, 30 July: 21.7 µg/m³Houston, 31 July: 34.2 µg/m³, 2.7× its usual 12.6Houston, 1 August: 23.1 µg/m³Houston, 2 August: 12.1 µg/m³Houston, 3 August: 8.5 µg/m³Houston, 4 August: 13.1 µg/m³Houston, 5 August: 17.8 µg/m³EdinburgEdinburg, 28 July: 7.5 µg/m³Edinburg, 29 July: 10.8 µg/m³Edinburg, 30 July: 22.1 µg/m³Edinburg, 31 July: 34.0 µg/m³, 3.2× its usual 10.6Edinburg, 1 August: 13.8 µg/m³Edinburg, 2 August: 5.8 µg/m³Edinburg, 3 August: 11.9 µg/m³Edinburg, 4 August: 16.5 µg/m³Edinburg, 5 August: 12.7 µg/m³San MarcosSan Marcos, 28 July: 5.1 µg/m³San Marcos, 29 July: no readingSan Marcos, 30 July: no readingSan Marcos, 31 July: 33.8 µg/m³, 4.3× its usual 7.9San Marcos, 1 August: 27.4 µg/m³, 3.5× its usual 7.9San Marcos, 2 August: 8.1 µg/m³San Marcos, 3 August: 5.0 µg/m³San Marcos, 4 August: 6.2 µg/m³San Marcos, 5 August: 8.8 µg/m³CorsicanaCorsicana, 28 July: 7.4 µg/m³Corsicana, 29 July: 7.1 µg/m³Corsicana, 30 July: 11.3 µg/m³Corsicana, 31 July: 33.1 µg/m³, 3.2× its usual 10.4Corsicana, 1 August: 33.0 µg/m³, 3.1× its usual 10.5Corsicana, 2 August: 15.0 µg/m³Corsicana, 3 August: 8.9 µg/m³Corsicana, 4 August: 14.1 µg/m³Corsicana, 5 August: 12.2 µg/m³TaylorTaylor, 28 July: 5.7 µg/m³Taylor, 29 July: no readingTaylor, 30 July: no readingTaylor, 31 July: 32.9 µg/m³, 3.6× its usual 9.1Taylor, 1 August: 27.3 µg/m³, 3.0× its usual 9.2Taylor, 2 August: 8.5 µg/m³Taylor, 3 August: 8.4 µg/m³Taylor, 4 August: 7.0 µg/m³Taylor, 5 August: 10.9 µg/m³Heroica MatamorosHeroica Matamoros, 28 July: 5.9 µg/m³Heroica Matamoros, 29 July: 10.3 µg/m³Heroica Matamoros, 30 July: 24.3 µg/m³Heroica Matamoros, 31 July: 32.8 µg/m³, 3.3× its usual 9.8Heroica Matamoros, 1 August: 10.5 µg/m³Heroica Matamoros, 2 August: 2.9 µg/m³Heroica Matamoros, 3 August: 11.6 µg/m³Heroica Matamoros, 4 August: 14.7 µg/m³Heroica Matamoros, 5 August: 9.6 µg/m³Mission BendMission Bend, 28 July: 6.6 µg/m³Mission Bend, 29 July: 7.0 µg/m³Mission Bend, 30 July: 19.2 µg/m³Mission Bend, 31 July: 32.6 µg/m³, 3.3× its usual 9.8Mission Bend, 1 August: 22.1 µg/m³Mission Bend, 2 August: 9.2 µg/m³Mission Bend, 3 August: 4.7 µg/m³Mission Bend, 4 August: 8.7 µg/m³Mission Bend, 5 August: 12.7 µg/m³Port ArthurPort Arthur, 28 July: 7.0 µg/m³Port Arthur, 29 July: 10.0 µg/m³Port Arthur, 30 July: 23.5 µg/m³Port Arthur, 31 July: 32.6 µg/m³, 3.2× its usual 10.1Port Arthur, 1 August: 22.7 µg/m³Port Arthur, 2 August: 13.9 µg/m³Port Arthur, 3 August: 10.0 µg/m³Port Arthur, 4 August: 15.9 µg/m³Port Arthur, 5 August: 17.4 µg/m³PasadenaPasadena, 28 July: 5.1 µg/m³Pasadena, 29 July: 6.0 µg/m³Pasadena, 30 July: 18.2 µg/m³Pasadena, 31 July: 32.5 µg/m³, 3.0× its usual 10.8Pasadena, 1 August: 21.1 µg/m³Pasadena, 2 August: 13.0 µg/m³Pasadena, 3 August: 6.9 µg/m³Pasadena, 4 August: 11.3 µg/m³Pasadena, 5 August: 14.6 µg/m³GeorgetownGeorgetown, 28 July: 5.7 µg/m³Georgetown, 29 July: no readingGeorgetown, 30 July: no readingGeorgetown, 31 July: 32.4 µg/m³, 4.3× its usual 7.6Georgetown, 1 August: 27.7 µg/m³, 3.6× its usual 7.6Georgetown, 2 August: 7.6 µg/m³Georgetown, 3 August: 5.6 µg/m³Georgetown, 4 August: 6.3 µg/m³Georgetown, 5 August: 10.6 µg/m³BeltonBelton, 28 July: 5.8 µg/m³Belton, 29 July: 9.1 µg/m³Belton, 30 July: 13.3 µg/m³Belton, 31 July: 32.2 µg/m³, 3.3× its usual 9.9Belton, 1 August: 28.7 µg/m³, 2.9× its usual 9.9Belton, 2 August: 11.0 µg/m³Belton, 3 August: 10.2 µg/m³Belton, 4 August: 11.2 µg/m³Belton, 5 August: 15.2 µg/m³Missouri CityMissouri City, 28 July: 8.2 µg/m³Missouri City, 29 July: 8.5 µg/m³Missouri City, 30 July: 20.5 µg/m³Missouri City, 31 July: 31.9 µg/m³, 3.0× its usual 10.5Missouri City, 1 August: 21.6 µg/m³Missouri City, 2 August: 9.7 µg/m³Missouri City, 3 August: 7.5 µg/m³Missouri City, 4 August: 10.9 µg/m³Missouri City, 5 August: 13.7 µg/m³College StationCollege Station, 28 July: 6.2 µg/m³College Station, 29 July: 6.4 µg/m³College Station, 30 July: 14.9 µg/m³College Station, 31 July: 31.8 µg/m³, 3.5× its usual 9.0College Station, 1 August: 26.1 µg/m³, 2.9× its usual 8.9College Station, 2 August: 8.8 µg/m³College Station, 3 August: 7.5 µg/m³College Station, 4 August: 11.1 µg/m³College Station, 5 August: 12.9 µg/m³Eagle PassEagle Pass, 28 July: 6.9 µg/m³Eagle Pass, 29 July: 11.9 µg/m³Eagle Pass, 30 July: 10.6 µg/m³Eagle Pass, 31 July: 31.5 µg/m³, 3.2× its usual 9.8Eagle Pass, 1 August: 30.1 µg/m³, 3.2× its usual 9.5Eagle Pass, 2 August: 5.2 µg/m³Eagle Pass, 3 August: 4.4 µg/m³Eagle Pass, 4 August: no readingEagle Pass, 5 August: no readingSaginawSaginaw, 28 July: 7.3 µg/m³Saginaw, 29 July: 9.0 µg/m³Saginaw, 30 July: 10.6 µg/m³Saginaw, 31 July: 31.3 µg/m³, 3.0× its usual 10.3Saginaw, 1 August: 33.0 µg/m³, 3.2× its usual 10.4Saginaw, 2 August: 23.2 µg/m³Saginaw, 3 August: 8.7 µg/m³Saginaw, 4 August: 15.6 µg/m³Saginaw, 5 August: 16.8 µg/m³BaytownBaytown, 28 July: 6.3 µg/m³Baytown, 29 July: 8.3 µg/m³Baytown, 30 July: 19.3 µg/m³Baytown, 31 July: 31.2 µg/m³, 2.6× its usual 11.8Baytown, 1 August: 21.7 µg/m³Baytown, 2 August: no readingBaytown, 3 August: no readingBaytown, 4 August: no readingBaytown, 5 August: no readingFort WorthFort Worth, 28 July: 6.7 µg/m³Fort Worth, 29 July: 7.9 µg/m³Fort Worth, 30 July: 9.2 µg/m³Fort Worth, 31 July: 30.3 µg/m³, 2.8× its usual 10.8Fort Worth, 1 August: 33.3 µg/m³, 3.1× its usual 10.9Fort Worth, 2 August: 23.0 µg/m³Fort Worth, 3 August: 9.2 µg/m³Fort Worth, 4 August: 13.2 µg/m³Fort Worth, 5 August: 15.0 µg/m³LafayetteLafayette, 28 July: 6.8 µg/m³Lafayette, 29 July: 9.0 µg/m³Lafayette, 30 July: 15.8 µg/m³Lafayette, 31 July: 29.2 µg/m³, 3.7× its usual 7.9Lafayette, 1 August: 25.4 µg/m³, 3.2× its usual 7.9Lafayette, 2 August: 13.7 µg/m³Lafayette, 3 August: 10.4 µg/m³Lafayette, 4 August: 13.1 µg/m³Lafayette, 5 August: 15.1 µg/m³La PorteLa Porte, 28 July: 4.1 µg/m³La Porte, 29 July: 6.0 µg/m³La Porte, 30 July: 17.7 µg/m³La Porte, 31 July: 29.2 µg/m³, 3.1× its usual 9.4La Porte, 1 August: 19.0 µg/m³La Porte, 2 August: 7.9 µg/m³La Porte, 3 August: 6.8 µg/m³La Porte, 4 August: 8.8 µg/m³La Porte, 5 August: 14.0 µg/m³GalvestonGalveston, 28 July: 3.1 µg/m³Galveston, 29 July: no readingGalveston, 30 July: 18.8 µg/m³Galveston, 31 July: 28.5 µg/m³, 3.0× its usual 9.4Galveston, 1 August: 18.2 µg/m³Galveston, 2 August: 5.2 µg/m³Galveston, 3 August: 5.9 µg/m³Galveston, 4 August: 6.8 µg/m³Galveston, 5 August: 12.5 µg/m³TexarkanaTexarkana, 28 July: 10.7 µg/m³Texarkana, 29 July: 8.8 µg/m³Texarkana, 30 July: 11.6 µg/m³Texarkana, 31 July: 27.1 µg/m³, 2.3× its usual 12.0Texarkana, 1 August: 34.0 µg/m³, 2.8× its usual 12.0Texarkana, 2 August: 26.7 µg/m³, 2.3× its usual 11.8Texarkana, 3 August: 15.1 µg/m³Texarkana, 4 August: 12.1 µg/m³Texarkana, 5 August: no readingBaton RougeBaton Rouge, 28 July: 6.4 µg/m³Baton Rouge, 29 July: 7.1 µg/m³Baton Rouge, 30 July: 12.5 µg/m³Baton Rouge, 31 July: 26.6 µg/m³, 2.8× its usual 9.6Baton Rouge, 1 August: 27.4 µg/m³, 2.8× its usual 9.7Baton Rouge, 2 August: 14.6 µg/m³Baton Rouge, 3 August: 12.9 µg/m³Baton Rouge, 4 August: 13.7 µg/m³Baton Rouge, 5 August: 13.6 µg/m³DentonDenton, 28 July: 6.3 µg/m³Denton, 29 July: 8.6 µg/m³Denton, 30 July: 9.0 µg/m³Denton, 31 July: 26.2 µg/m³, 2.5× its usual 10.5Denton, 1 August: 32.8 µg/m³, 3.1× its usual 10.5Denton, 2 August: 22.5 µg/m³Denton, 3 August: 9.2 µg/m³Denton, 4 August: 9.5 µg/m³Denton, 5 August: 13.9 µg/m³West MemphisWest Memphis, 28 July: 11.4 µg/m³West Memphis, 29 July: 10.2 µg/m³West Memphis, 30 July: 12.0 µg/m³West Memphis, 31 July: 19.5 µg/m³West Memphis, 1 August: 46.6 µg/m³, 3.7× its usual 12.5West Memphis, 2 August: 26.7 µg/m³, 2.1× its usual 12.5West Memphis, 3 August: 12.9 µg/m³West Memphis, 4 August: 18.5 µg/m³West Memphis, 5 August: 20.5 µg/m³BartlettBartlett, 28 July: 8.0 µg/m³Bartlett, 29 July: 9.7 µg/m³Bartlett, 30 July: 12.2 µg/m³Bartlett, 31 July: 17.2 µg/m³Bartlett, 1 August: 45.4 µg/m³, 4.5× its usual 10.2Bartlett, 2 August: 28.8 µg/m³, 2.9× its usual 10.1Bartlett, 3 August: 15.0 µg/m³Bartlett, 4 August: 24.5 µg/m³Bartlett, 5 August: 24.0 µg/m³Little RockLittle Rock, 28 July: 11.9 µg/m³Little Rock, 29 July: 11.1 µg/m³Little Rock, 30 July: 12.7 µg/m³Little Rock, 31 July: 23.0 µg/m³Little Rock, 1 August: 38.8 µg/m³, 3.2× its usual 12.1Little Rock, 2 August: 26.6 µg/m³, 2.2× its usual 12.1Little Rock, 3 August: 12.5 µg/m³Little Rock, 4 August: 16.3 µg/m³Little Rock, 5 August: 20.1 µg/m³HernandoHernando, 28 July: 7.4 µg/m³Hernando, 29 July: 7.8 µg/m³Hernando, 30 July: 8.3 µg/m³Hernando, 31 July: 13.2 µg/m³Hernando, 1 August: 36.2 µg/m³, 4.1× its usual 8.9Hernando, 2 August: 25.3 µg/m³, 2.8× its usual 8.9Hernando, 3 August: 11.9 µg/m³Hernando, 4 August: 16.4 µg/m³Hernando, 5 August: 16.5 µg/m³McAlesterMcAlester, 28 July: 8.7 µg/m³McAlester, 29 July: 7.3 µg/m³McAlester, 30 July: 7.9 µg/m³McAlester, 31 July: 21.2 µg/m³McAlester, 1 August: 36.0 µg/m³, 3.7× its usual 9.7McAlester, 2 August: 21.5 µg/m³McAlester, 3 August: 12.5 µg/m³McAlester, 4 August: 13.2 µg/m³McAlester, 5 August: 15.6 µg/m³MooreMoore, 28 July: 9.0 µg/m³Moore, 29 July: 7.8 µg/m³Moore, 30 July: 9.9 µg/m³Moore, 31 July: 19.4 µg/m³Moore, 1 August: 35.5 µg/m³, 3.6× its usual 10.0Moore, 2 August: 23.9 µg/m³Moore, 3 August: 11.4 µg/m³Moore, 4 August: 13.6 µg/m³Moore, 5 August: 15.7 µg/m³AdaAda, 28 July: 7.9 µg/m³Ada, 29 July: 6.1 µg/m³Ada, 30 July: 7.1 µg/m³Ada, 31 July: 20.3 µg/m³Ada, 1 August: 34.7 µg/m³, 3.9× its usual 8.9Ada, 2 August: 30.9 µg/m³, 3.3× its usual 9.4Ada, 3 August: 8.3 µg/m³Ada, 4 August: 10.7 µg/m³Ada, 5 August: 9.2 µg/m³SpringdaleSpringdale, 28 July: 11.7 µg/m³Springdale, 29 July: 10.4 µg/m³Springdale, 30 July: 11.4 µg/m³Springdale, 31 July: 20.9 µg/m³Springdale, 1 August: 34.4 µg/m³, 2.7× its usual 12.7Springdale, 2 August: 18.2 µg/m³Springdale, 3 August: 14.4 µg/m³Springdale, 4 August: 13.3 µg/m³Springdale, 5 August: 16.3 µg/m³EdmondEdmond, 28 July: 8.5 µg/m³Edmond, 29 July: 7.1 µg/m³Edmond, 30 July: 9.4 µg/m³Edmond, 31 July: 17.7 µg/m³Edmond, 1 August: 34.3 µg/m³, 3.6× its usual 9.4Edmond, 2 August: 20.7 µg/m³Edmond, 3 August: 9.9 µg/m³Edmond, 4 August: 11.6 µg/m³Edmond, 5 August: 13.2 µg/m³Fort SmithFort Smith, 28 July: 4.8 µg/m³Fort Smith, 29 July: 4.3 µg/m³Fort Smith, 30 July: 5.0 µg/m³Fort Smith, 31 July: 18.0 µg/m³Fort Smith, 1 August: 33.9 µg/m³, 4.2× its usual 8.0Fort Smith, 2 August: 16.0 µg/m³Fort Smith, 3 August: 5.8 µg/m³Fort Smith, 4 August: 7.8 µg/m³Fort Smith, 5 August: 12.9 µg/m³Oklahoma CityOklahoma City, 28 July: 8.3 µg/m³Oklahoma City, 29 July: 7.5 µg/m³Oklahoma City, 30 July: 9.6 µg/m³Oklahoma City, 31 July: 17.4 µg/m³Oklahoma City, 1 August: 32.5 µg/m³, 3.3× its usual 9.9Oklahoma City, 2 August: 20.4 µg/m³Oklahoma City, 3 August: 11.7 µg/m³Oklahoma City, 4 August: 13.3 µg/m³Oklahoma City, 5 August: 14.4 µg/m³JacksonJackson, 28 July: 5.2 µg/m³Jackson, 29 July: 5.6 µg/m³Jackson, 30 July: 8.2 µg/m³Jackson, 31 July: 19.2 µg/m³Jackson, 1 August: 31.6 µg/m³, 3.3× its usual 9.6Jackson, 2 August: 22.6 µg/m³Jackson, 3 August: 12.2 µg/m³Jackson, 4 August: 8.2 µg/m³Jackson, 5 August: 9.9 µg/m³DyersburgDyersburg, 28 July: 5.0 µg/m³Dyersburg, 29 July: 6.6 µg/m³Dyersburg, 30 July: no readingDyersburg, 31 July: 10.9 µg/m³Dyersburg, 1 August: 30.6 µg/m³, 3.8× its usual 8.0Dyersburg, 2 August: 15.4 µg/m³Dyersburg, 3 August: 9.9 µg/m³Dyersburg, 4 August: 11.9 µg/m³Dyersburg, 5 August: 14.3 µg/m³LawtonLawton, 28 July: 7.2 µg/m³Lawton, 29 July: 5.6 µg/m³Lawton, 30 July: 3.1 µg/m³Lawton, 31 July: 11.9 µg/m³Lawton, 1 August: 29.5 µg/m³, 3.4× its usual 8.7Lawton, 2 August: 21.1 µg/m³Lawton, 3 August: 9.9 µg/m³Lawton, 4 August: 10.7 µg/m³Lawton, 5 August: no readingJenksJenks, 28 July: 8.8 µg/m³Jenks, 29 July: 6.7 µg/m³Jenks, 30 July: 8.2 µg/m³Jenks, 31 July: 15.6 µg/m³Jenks, 1 August: 29.5 µg/m³, 3.1× its usual 9.6Jenks, 2 August: 13.7 µg/m³Jenks, 3 August: 9.7 µg/m³Jenks, 4 August: 10.7 µg/m³Jenks, 5 August: 12.1 µg/m³JacksonJackson, 28 July: 4.6 µg/m³Jackson, 29 July: 5.2 µg/m³Jackson, 30 July: 8.7 µg/m³Jackson, 31 July: 10.2 µg/m³Jackson, 1 August: 29.0 µg/m³, 3.3× its usual 8.9Jackson, 2 August: 19.1 µg/m³Jackson, 3 August: 9.2 µg/m³Jackson, 4 August: 14.1 µg/m³Jackson, 5 August: 15.6 µg/m³BirminghamBirmingham, 28 July: no readingBirmingham, 29 July: no readingBirmingham, 30 July: 12.0 µg/m³Birmingham, 31 July: 15.7 µg/m³Birmingham, 1 August: 28.7 µg/m³, 3.1× its usual 9.2Birmingham, 2 August: 37.5 µg/m³, 4.1× its usual 9.2Birmingham, 3 August: 14.5 µg/m³Birmingham, 4 August: 15.0 µg/m³Birmingham, 5 August: 11.5 µg/m³TulsaTulsa, 28 July: 9.9 µg/m³Tulsa, 29 July: 7.5 µg/m³Tulsa, 30 July: 9.4 µg/m³Tulsa, 31 July: 17.2 µg/m³Tulsa, 1 August: 28.0 µg/m³, 2.5× its usual 11.0Tulsa, 2 August: 12.4 µg/m³Tulsa, 3 August: 10.3 µg/m³Tulsa, 4 August: 12.3 µg/m³Tulsa, 5 August: 14.9 µg/m³ColumbiaColumbia, 28 July: 6.4 µg/m³Columbia, 29 July: 5.4 µg/m³Columbia, 30 July: 7.5 µg/m³Columbia, 31 July: 8.0 µg/m³Columbia, 1 August: 25.0 µg/m³, 3.5× its usual 7.2Columbia, 2 August: 21.7 µg/m³Columbia, 3 August: 8.3 µg/m³Columbia, 4 August: 12.3 µg/m³Columbia, 5 August: 11.4 µg/m³GainesvilleGainesville, 28 July: 12.5 µg/m³Gainesville, 29 July: 9.1 µg/m³Gainesville, 30 July: 10.4 µg/m³Gainesville, 31 July: 11.2 µg/m³Gainesville, 1 August: 12.4 µg/m³Gainesville, 2 August: 30.6 µg/m³, 3.6× its usual 8.5Gainesville, 3 August: 16.4 µg/m³Gainesville, 4 August: 14.1 µg/m³Gainesville, 5 August: 7.9 µg/m³East RidgeEast Ridge, 28 July: 11.8 µg/m³East Ridge, 29 July: 5.5 µg/m³East Ridge, 30 July: 7.5 µg/m³East Ridge, 31 July: 8.2 µg/m³East Ridge, 1 August: 16.6 µg/m³East Ridge, 2 August: 28.9 µg/m³, 3.4× its usual 8.5East Ridge, 3 August: 11.4 µg/m³East Ridge, 4 August: 9.7 µg/m³East Ridge, 5 August: 11.0 µg/m³ChattanoogaChattanooga, 28 July: 11.2 µg/m³Chattanooga, 29 July: 5.0 µg/m³Chattanooga, 30 July: 6.8 µg/m³Chattanooga, 31 July: 8.1 µg/m³Chattanooga, 1 August: 16.5 µg/m³Chattanooga, 2 August: 28.3 µg/m³, 3.3× its usual 8.7Chattanooga, 3 August: 8.8 µg/m³Chattanooga, 4 August: 9.6 µg/m³Chattanooga, 5 August: 10.2 µg/m³BessemerBessemer, 28 July: 5.6 µg/m³Bessemer, 29 July: 4.5 µg/m³Bessemer, 30 July: 7.2 µg/m³Bessemer, 31 July: 9.7 µg/m³Bessemer, 1 August: 20.8 µg/m³Bessemer, 2 August: 27.7 µg/m³, 3.8× its usual 7.3Bessemer, 3 August: 9.1 µg/m³Bessemer, 4 August: 10.6 µg/m³Bessemer, 5 August: 7.6 µg/m³McDonoughMcDonough, 28 July: 9.0 µg/m³McDonough, 29 July: 4.5 µg/m³McDonough, 30 July: 5.7 µg/m³McDonough, 31 July: 5.4 µg/m³McDonough, 1 August: 9.2 µg/m³McDonough, 2 August: 27.4 µg/m³, 3.7× its usual 7.5McDonough, 3 August: 16.7 µg/m³McDonough, 4 August: 9.7 µg/m³McDonough, 5 August: 2.7 µg/m³LawrencevilleLawrenceville, 28 July: 13.0 µg/m³Lawrenceville, 29 July: 7.6 µg/m³Lawrenceville, 30 July: 9.3 µg/m³Lawrenceville, 31 July: 9.5 µg/m³Lawrenceville, 1 August: 11.0 µg/m³Lawrenceville, 2 August: 26.1 µg/m³, 3.5× its usual 7.5Lawrenceville, 3 August: 17.7 µg/m³Lawrenceville, 4 August: 14.2 µg/m³Lawrenceville, 5 August: 5.4 µg/m³Phenix CityPhenix City, 28 July: 6.3 µg/m³Phenix City, 29 July: 5.4 µg/m³Phenix City, 30 July: 6.3 µg/m³Phenix City, 31 July: 7.2 µg/m³Phenix City, 1 August: 9.0 µg/m³Phenix City, 2 August: 25.4 µg/m³, 2.8× its usual 9.0Phenix City, 3 August: 14.3 µg/m³Phenix City, 4 August: 7.2 µg/m³Phenix City, 5 August: 3.7 µg/m³28 Jul2930311 Aug2345
Every counted city, in the order the episode reached them, 3 days before to 3 after. Each square is a day, coloured by that day's PM2.5; outlined: at twice the city's usual or more.
Good0–50
Moderate51–100
Sensitive groups101–150
Unhealthy151–200
Very unhealthy201–300
Hazardous301+

Every city it reached

CityDaysHighestUsualAbove usual
BartlettTennessee, United States2 45.41 August10.24.5×
San MarcosTexas, United States2 33.831 July7.94.3×
GeorgetownTexas, United States2 32.431 July7.64.3×
Fort SmithArkansas, United States1 33.91 August8.04.2×
BirminghamAlabama, United States2 37.52 August9.24.1×
HernandoMississippi, United States2 36.21 August8.94.1×
AdaOklahoma, United States2 34.71 August8.93.9×
Live OakTexas, United States2 36.331 July9.53.8×
DyersburgTennessee, United States1 30.61 August8.03.8×
BessemerAlabama, United States1 27.72 August7.33.8×
West MemphisArkansas, United States2 46.61 August12.53.7×
Corpus ChristiTexas, United States1 39.731 July10.83.7×
McAlesterOklahoma, United States1 36.01 August9.73.7×
LafayetteLouisiana, United States2 29.231 July7.93.7×
McDonoughGeorgia, United States1 27.42 August7.53.7×
MooreOklahoma, United States1 35.51 August10.03.6×
EdmondOklahoma, United States1 34.31 August9.43.6×
TaylorTexas, United States2 32.931 July9.13.6×
GainesvilleGeorgia, United States1 30.62 August8.53.6×
College StationTexas, United States2 31.831 July9.03.5×
LawrencevilleGeorgia, United States1 26.12 August7.53.5×
ColumbiaTennessee, United States1 25.01 August7.23.5×
ShreveportLouisiana, United States3 39.91 August11.83.4×
MissionTexas, United States1 37.831 July11.13.4×
LawtonOklahoma, United States1 29.51 August8.73.4×
East RidgeTennessee, United States1 28.92 August8.53.4×
AustinTexas, United States2 35.431 July10.83.3×
Heroica MatamorosTamaulipas, Mexico1 32.831 July9.83.3×
Mission BendTexas, United States1 32.631 July9.83.3×
Oklahoma CityOklahoma, United States1 32.51 August9.93.3×
BeltonTexas, United States2 32.231 July9.93.3×
JacksonMississippi, United States1 31.61 August9.63.3×
JacksonTennessee, United States1 29.01 August8.93.3×
ChattanoogaTennessee, United States1 28.32 August8.73.3×
Little RockArkansas, United States2 38.81 August12.13.2×
EdinburgTexas, United States1 34.031 July10.63.2×
CorsicanaTexas, United States2 33.131 July10.43.2×
SaginawTexas, United States2 33.01 August10.43.2×
Port ArthurTexas, United States1 32.631 July10.13.2×
Eagle PassTexas, United States2 31.531 July9.83.2×
LaredoTexas, United States1 36.331 July11.73.1×
ConroeTexas, United States2 35.431 July11.63.1×
Fort WorthTexas, United States2 33.31 August10.93.1×
DentonTexas, United States2 32.81 August10.53.1×
JenksOklahoma, United States1 29.51 August9.63.1×
La PorteTexas, United States1 29.231 July9.43.1×
PasadenaTexas, United States1 32.531 July10.83.0×
Missouri CityTexas, United States1 31.931 July10.53.0×
GalvestonTexas, United States1 28.531 July9.43.0×
TexarkanaTexas, United States3 34.01 August12.02.8×
Baton RougeLouisiana, United States2 27.41 August9.72.8×
Phenix CityAlabama, United States1 25.42 August9.02.8×
SpringdaleArkansas, United States1 34.41 August12.72.7×
HoustonTexas, United States1 34.231 July12.62.7×
BaytownTexas, United States1 31.231 July11.82.6×
TulsaOklahoma, United States1 28.01 August11.02.5×

Daily means in µg/m³, over the days each city counted in this episode. Highest: its highest of those days. Usual: the city's median for the time of year of that day (its days within 21 days of the date, every year, leaving out the week around it). Above usual: its highest day against that, with a usual under 5 µg/m³ taken as 5.

Against other episodes in the United States and Mexico

Number 19 of 141 episodes in the United States and Mexico since our records began, by cities reached.

Bars: cities reached; colour: the level of the episode's highest daily reading. All 141.

Use this page

SmogRank, Southern United States and Mexico, July and August 2024: 56 cities with PM2.5 at twice their usual or more, 31 July to 2 August 2024, smogrank.com/episodes/2024-07-southern-united-states-and-mexico (accessed 4 October 2026).
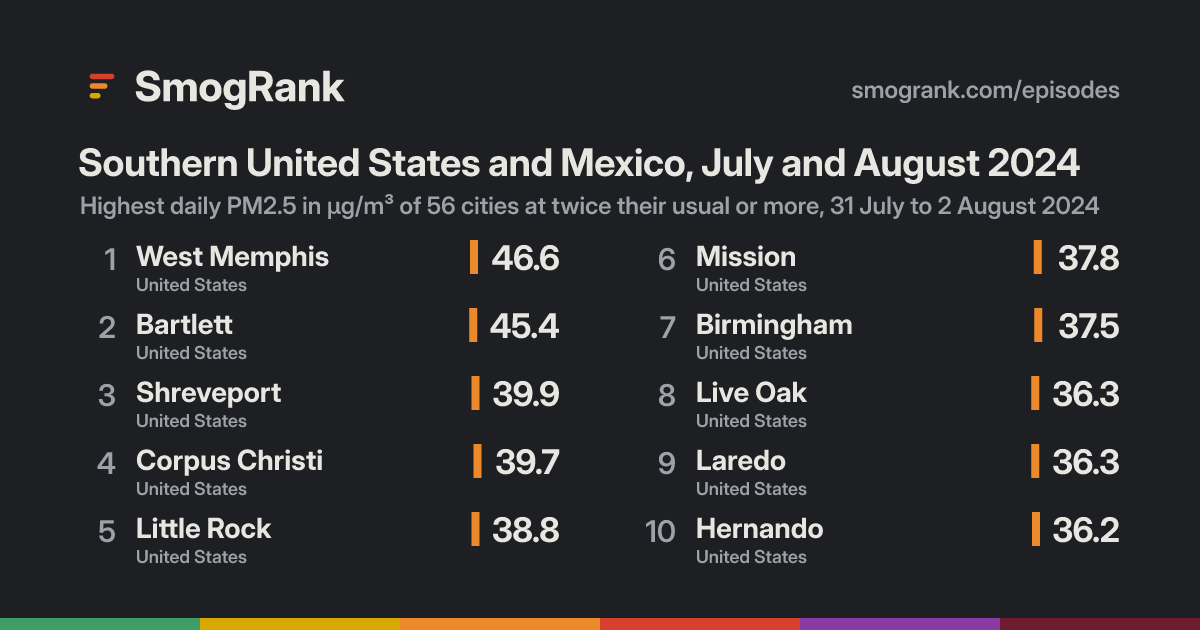
Download top 10 (PNG)

You're welcome to reuse a single chart, image or figure with this citation and a link. Terms.

An episode is a run of days when many cities close to each other (four or more within 350 km on a day, 8 or more in all) each had a daily PM2.5 mean of at least 25 µg/m³ and at least 2 times their usual for that time of year. Found in our own measurements, not picked by hand. How we find episodes. Values are each city's daily mean of its own monitors; causes are the usual kinds for a pattern like this, not a confirmed source.