SmogRank / Episodes / United States

Eastern United States, March 2025

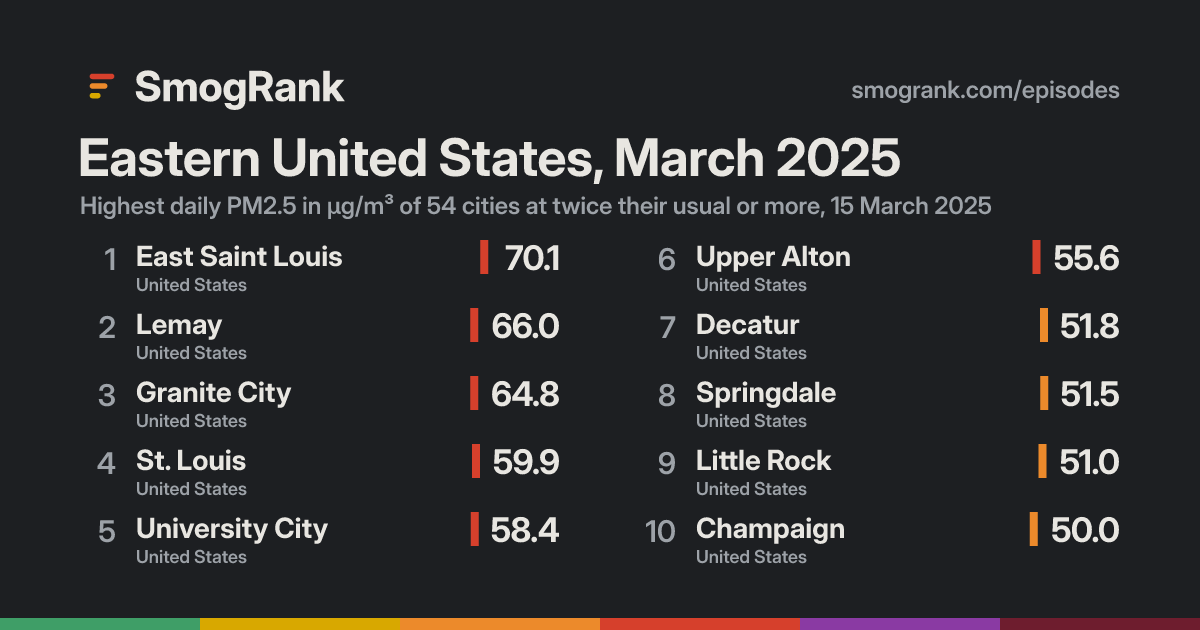
For 1 day, on 15 March 2025, 54 cities in the United States had PM2.5 at least twice their usual for the time of year. The worst reading was East Saint Louis, Illinois, United States: 70.1 µg/m³ on 15 March, about 9.3× its usual 7.5.

No cause namedWe have no fire or smoke records for these days, so we only say what the measurements show.
Cities reached54in 1 country
Days115 March 2025
Worst day15 March54 cities counted
Furthest above usual11×Lemay

Day by day

15 March 54 cities at twice their usual or more
ArnoldColumbiaDyersburgBartlettHernandoPaducahJacksonFort SmithRaymoreLeawoodLibertyKansas CityKansas CityOlatheEvansvilleClarksvilleSaint JosephOwensboroMuscatineColumbiaJacksonTopekaShreveportNashvilleMolineDavenportIowa CityJasperTerre HauteHendersonvilleDecaturCedar RapidsDes MoinesClintonAnkenyHuntsvillePonca CityBloomingtonHueytownDerbyWaterlooBirminghamElizabethtownWichitaValley StationTrussvilleHattiesburgNew AlbanyAuroraLouisvilleJeffersonvilleEdmondRockfordNapervilleSaint MatthewsOklahoma CityMooreCookevilleBellevueColumbusJeffersontownIndianapolisElginGadsdenOmahaLa VistaFranklin ParkBaton RougeCaryFishersDes PlainesChattanoogaLincolnEast RidgeLafayetteKokomoMadisonAndersonZionSulphurMontgomeryGulfportKennerPrichardNew OrleansChalmetteOconomowocMuncieWaukeshaPascagoulaLawtonSouth MilwaukeeMilwaukeeFairhopePort ArthurRochesterFerry PassWest PensacolaFort WayneMankatoMidwayColumbusGrand IslandEau ClaireApple ValleyKalamazooBurnsvilleShakopeeSaint PaulMinneapolisSioux FallsGreen BayBlaineSaint MichaelAustinBrookingsSan MarcosWatertownLive OakBaytownMission BendHoustonMissouri CityPasadenaJenksLa PorteCollege StationJolietConroeOak LawnSaginawElmwood ParkCalumet CityTulsaHammondBrookfieldDoltonChicagoTaylorEast ChicagoSpringfieldWyomingPeoriaMcAlesterBloomingtonGalvestonDentonLafayetteNorthbrookElkhartGaryTexarkanaSouth BendAppletonSpringfieldGrand RapidsSpringdaleBeltonCorsicanaLittle RockFort WorthPortageHollandJenisonMichigan CitySt. LouisDecaturGranite CityChampaignUniversity CityUpper AltonEast Saint LouisLemay
12 Mar131415161718
Every measured city in the area, coloured by its PM2.5 that day; a dark ring marks a city at twice its usual or more. Bars: cities counted each day, coloured by their median level. Choose a day or press play; without JavaScript, the days link to that day's world ranking.

How it spread

East Saint LouisEast Saint Louis, 12 March: 15.0 µg/m³East Saint Louis, 13 March: 21.1 µg/m³East Saint Louis, 14 March: 13.4 µg/m³East Saint Louis, 15 March: 70.1 µg/m³, 9.3× its usual 7.5East Saint Louis, 16 March: 4.2 µg/m³East Saint Louis, 17 March: 6.2 µg/m³East Saint Louis, 18 March: 6.4 µg/m³LemayLemay, 12 March: 12.1 µg/m³Lemay, 13 March: 20.8 µg/m³Lemay, 14 March: 10.0 µg/m³Lemay, 15 March: 66.0 µg/m³, 11× its usual 5.8Lemay, 16 March: 2.2 µg/m³Lemay, 17 March: 5.8 µg/m³Lemay, 18 March: 5.4 µg/m³Granite CityGranite City, 12 March: 15.1 µg/m³Granite City, 13 March: 20.7 µg/m³Granite City, 14 March: 15.4 µg/m³Granite City, 15 March: 64.8 µg/m³, 8.1× its usual 8.0Granite City, 16 March: 4.1 µg/m³Granite City, 17 March: 6.3 µg/m³Granite City, 18 March: 7.3 µg/m³St. LouisSt. Louis, 12 March: 15.2 µg/m³St. Louis, 13 March: 21.4 µg/m³St. Louis, 14 March: 23.8 µg/m³St. Louis, 15 March: 59.9 µg/m³, 7.5× its usual 8.0St. Louis, 16 March: 3.0 µg/m³St. Louis, 17 March: 4.6 µg/m³St. Louis, 18 March: 7.7 µg/m³University CityUniversity City, 12 March: 10.9 µg/m³University City, 13 March: 16.6 µg/m³University City, 14 March: 10.6 µg/m³University City, 15 March: 58.4 µg/m³, 8.8× its usual 6.6University City, 16 March: 2.8 µg/m³University City, 17 March: 4.0 µg/m³University City, 18 March: 5.7 µg/m³Upper AltonUpper Alton, 12 March: 12.6 µg/m³Upper Alton, 13 March: 20.5 µg/m³Upper Alton, 14 March: 13.2 µg/m³Upper Alton, 15 March: 55.6 µg/m³, 9.0× its usual 6.2Upper Alton, 16 March: 3.6 µg/m³Upper Alton, 17 March: 6.0 µg/m³Upper Alton, 18 March: 7.9 µg/m³DecaturDecatur, 12 March: 13.0 µg/m³Decatur, 13 March: 15.4 µg/m³Decatur, 14 March: 13.5 µg/m³Decatur, 15 March: 51.8 µg/m³, 8.1× its usual 6.4Decatur, 16 March: 6.0 µg/m³Decatur, 17 March: 5.4 µg/m³Decatur, 18 March: 7.7 µg/m³SpringdaleSpringdale, 12 March: 11.8 µg/m³Springdale, 13 March: 16.0 µg/m³Springdale, 14 March: 34.1 µg/m³Springdale, 15 March: 51.5 µg/m³, 5.7× its usual 9.0Springdale, 16 March: 7.7 µg/m³Springdale, 17 March: 8.2 µg/m³Springdale, 18 March: 15.6 µg/m³Little RockLittle Rock, 12 March: 13.4 µg/m³Little Rock, 13 March: 14.6 µg/m³Little Rock, 14 March: 21.1 µg/m³Little Rock, 15 March: 51.0 µg/m³, 5.9× its usual 8.7Little Rock, 16 March: 5.4 µg/m³Little Rock, 17 March: 9.3 µg/m³Little Rock, 18 March: 13.4 µg/m³ChampaignChampaign, 12 March: 9.5 µg/m³Champaign, 13 March: 12.6 µg/m³Champaign, 14 March: 16.0 µg/m³Champaign, 15 March: 50.0 µg/m³, 8.6× its usual 5.8Champaign, 16 March: 4.7 µg/m³Champaign, 17 March: 4.1 µg/m³Champaign, 18 March: 4.7 µg/m³Fort WorthFort Worth, 12 March: 9.3 µg/m³Fort Worth, 13 March: 8.8 µg/m³Fort Worth, 14 March: 60.1 µg/m³Fort Worth, 15 March: 47.8 µg/m³, 6.0× its usual 8.0Fort Worth, 16 March: 3.0 µg/m³Fort Worth, 17 March: 4.9 µg/m³Fort Worth, 18 March: 7.3 µg/m³Michigan CityMichigan City, 12 March: 3.7 µg/m³Michigan City, 13 March: 10.7 µg/m³Michigan City, 14 March: 10.0 µg/m³Michigan City, 15 March: 45.8 µg/m³, 7.4× its usual 6.2Michigan City, 16 March: 4.2 µg/m³Michigan City, 17 March: 5.0 µg/m³Michigan City, 18 March: 4.5 µg/m³TexarkanaTexarkana, 12 March: 10.2 µg/m³Texarkana, 13 March: 11.7 µg/m³Texarkana, 14 March: 19.2 µg/m³Texarkana, 15 March: 43.4 µg/m³, 4.9× its usual 8.9Texarkana, 16 March: 2.3 µg/m³Texarkana, 17 March: 5.3 µg/m³Texarkana, 18 March: 5.0 µg/m³CorsicanaCorsicana, 12 March: 5.8 µg/m³Corsicana, 13 March: 6.7 µg/m³Corsicana, 14 March: 22.9 µg/m³Corsicana, 15 March: 43.2 µg/m³, 5.9× its usual 7.3Corsicana, 16 March: 2.9 µg/m³Corsicana, 17 March: 4.6 µg/m³Corsicana, 18 March: 5.3 µg/m³BeltonBelton, 12 March: 10.1 µg/m³Belton, 13 March: 9.1 µg/m³Belton, 14 March: 19.4 µg/m³Belton, 15 March: 39.8 µg/m³, 5.8× its usual 6.9Belton, 16 March: 3.0 µg/m³Belton, 17 March: 6.3 µg/m³Belton, 18 March: 4.9 µg/m³HollandHolland, 12 March: 6.0 µg/m³Holland, 13 March: 11.3 µg/m³Holland, 14 March: no readingHolland, 15 March: 39.6 µg/m³, 6.4× its usual 6.2Holland, 16 March: 4.5 µg/m³Holland, 17 March: 5.2 µg/m³Holland, 18 March: 7.8 µg/m³SpringfieldSpringfield, 12 March: 14.3 µg/m³Springfield, 13 March: 21.2 µg/m³Springfield, 14 March: 20.0 µg/m³Springfield, 15 March: 39.4 µg/m³, 5.6× its usual 7.0Springfield, 16 March: 2.8 µg/m³Springfield, 17 March: 4.4 µg/m³Springfield, 18 March: 6.3 µg/m³JenisonJenison, 12 March: 3.5 µg/m³Jenison, 13 March: 7.8 µg/m³Jenison, 14 March: 9.6 µg/m³Jenison, 15 March: 39.1 µg/m³, 7.0× its usual 5.6Jenison, 16 March: 3.1 µg/m³Jenison, 17 March: 3.8 µg/m³Jenison, 18 March: 5.2 µg/m³PortagePortage, 12 March: 3.3 µg/m³Portage, 13 March: 9.0 µg/m³Portage, 14 March: 10.3 µg/m³Portage, 15 March: 38.8 µg/m³, 6.4× its usual 6.1Portage, 16 March: 5.2 µg/m³Portage, 17 March: 5.2 µg/m³Portage, 18 March: 5.5 µg/m³TulsaTulsa, 12 March: 9.9 µg/m³Tulsa, 13 March: 17.8 µg/m³Tulsa, 14 March: 60.9 µg/m³Tulsa, 15 March: 36.8 µg/m³, 3.8× its usual 9.8Tulsa, 16 March: 15.1 µg/m³Tulsa, 17 March: 10.1 µg/m³Tulsa, 18 March: 12.0 µg/m³WyomingWyoming, 12 March: 8.9 µg/m³Wyoming, 13 March: 10.3 µg/m³Wyoming, 14 March: 11.6 µg/m³Wyoming, 15 March: 35.0 µg/m³, 4.2× its usual 8.3Wyoming, 16 March: 7.2 µg/m³Wyoming, 17 March: 6.0 µg/m³Wyoming, 18 March: 8.4 µg/m³ConroeConroe, 12 March: 7.8 µg/m³Conroe, 13 March: 14.2 µg/m³Conroe, 14 March: 29.9 µg/m³Conroe, 15 March: 34.7 µg/m³, 3.4× its usual 10.2Conroe, 16 March: 8.2 µg/m³Conroe, 17 March: 23.0 µg/m³Conroe, 18 March: 6.7 µg/m³Grand RapidsGrand Rapids, 12 March: 3.3 µg/m³Grand Rapids, 13 March: 7.8 µg/m³Grand Rapids, 14 March: 10.1 µg/m³Grand Rapids, 15 March: 34.2 µg/m³, 5.7× its usual 6.0Grand Rapids, 16 March: 3.5 µg/m³Grand Rapids, 17 March: 4.1 µg/m³Grand Rapids, 18 March: 7.8 µg/m³McAlesterMcAlester, 12 March: 6.1 µg/m³McAlester, 13 March: 8.2 µg/m³McAlester, 14 March: 46.5 µg/m³McAlester, 15 March: 34.2 µg/m³, 4.3× its usual 7.9McAlester, 16 March: 5.3 µg/m³McAlester, 17 March: 6.1 µg/m³McAlester, 18 March: 6.1 µg/m³GaryGary, 12 March: 4.2 µg/m³Gary, 13 March: 9.8 µg/m³Gary, 14 March: 11.0 µg/m³Gary, 15 March: 33.6 µg/m³, 4.9× its usual 6.9Gary, 16 March: 6.3 µg/m³Gary, 17 March: no readingGary, 18 March: no readingDentonDenton, 12 March: 6.6 µg/m³Denton, 13 March: 7.1 µg/m³Denton, 14 March: 63.0 µg/m³Denton, 15 March: 31.1 µg/m³, 4.4× its usual 7.0Denton, 16 March: 2.9 µg/m³Denton, 17 March: no readingDenton, 18 March: 6.2 µg/m³South BendSouth Bend, 12 March: 5.2 µg/m³South Bend, 13 March: 9.0 µg/m³South Bend, 14 March: 9.2 µg/m³South Bend, 15 March: 31.0 µg/m³, 5.0× its usual 6.2South Bend, 16 March: 2.9 µg/m³South Bend, 17 March: 6.4 µg/m³South Bend, 18 March: 4.2 µg/m³HoustonHouston, 12 March: 10.1 µg/m³Houston, 13 March: 19.0 µg/m³Houston, 14 March: 27.9 µg/m³Houston, 15 March: 30.9 µg/m³, 2.7× its usual 11.5Houston, 16 March: 4.8 µg/m³Houston, 17 March: 9.5 µg/m³Houston, 18 March: 7.5 µg/m³DoltonDolton, 12 March: 4.3 µg/m³Dolton, 13 March: 10.8 µg/m³Dolton, 14 March: 13.3 µg/m³Dolton, 15 March: 30.2 µg/m³, 3.9× its usual 7.7Dolton, 16 March: 5.9 µg/m³Dolton, 17 March: 5.7 µg/m³Dolton, 18 March: 7.1 µg/m³LafayetteLafayette, 12 March: 6.5 µg/m³Lafayette, 13 March: 6.6 µg/m³Lafayette, 14 March: 10.6 µg/m³Lafayette, 15 March: 29.6 µg/m³, 4.6× its usual 6.5Lafayette, 16 March: 2.8 µg/m³Lafayette, 17 March: 3.0 µg/m³Lafayette, 18 March: no readingBrookfieldBrookfield, 12 March: 5.9 µg/m³Brookfield, 13 March: 14.4 µg/m³Brookfield, 14 March: 14.5 µg/m³Brookfield, 15 March: 29.4 µg/m³, 3.9× its usual 7.5Brookfield, 16 March: 4.4 µg/m³Brookfield, 17 March: 5.3 µg/m³Brookfield, 18 March: 6.9 µg/m³JenksJenks, 12 March: 10.4 µg/m³Jenks, 13 March: 14.9 µg/m³Jenks, 14 March: 54.2 µg/m³Jenks, 15 March: 28.7 µg/m³, 3.1× its usual 9.4Jenks, 16 March: 4.6 µg/m³Jenks, 17 March: 8.3 µg/m³Jenks, 18 March: 7.7 µg/m³East ChicagoEast Chicago, 12 March: 4.0 µg/m³East Chicago, 13 March: 10.1 µg/m³East Chicago, 14 March: 11.4 µg/m³East Chicago, 15 March: 28.5 µg/m³, 4.1× its usual 7.0East Chicago, 16 March: 5.5 µg/m³East Chicago, 17 March: 4.7 µg/m³East Chicago, 18 March: 5.6 µg/m³PasadenaPasadena, 12 March: 7.8 µg/m³Pasadena, 13 March: 17.2 µg/m³Pasadena, 14 March: 26.9 µg/m³Pasadena, 15 March: 28.5 µg/m³, 2.8× its usual 10.3Pasadena, 16 March: 5.5 µg/m³Pasadena, 17 March: 8.1 µg/m³Pasadena, 18 March: 6.1 µg/m³PeoriaPeoria, 12 March: 8.9 µg/m³Peoria, 13 March: 17.1 µg/m³Peoria, 14 March: 13.8 µg/m³Peoria, 15 March: 28.3 µg/m³, 4.3× its usual 6.6Peoria, 16 March: 4.4 µg/m³Peoria, 17 March: 3.7 µg/m³Peoria, 18 March: 6.8 µg/m³SaginawSaginaw, 12 March: 7.2 µg/m³Saginaw, 13 March: 5.0 µg/m³Saginaw, 14 March: 39.1 µg/m³Saginaw, 15 March: 28.1 µg/m³, 3.7× its usual 7.5Saginaw, 16 March: 4.0 µg/m³Saginaw, 17 March: 5.0 µg/m³Saginaw, 18 March: 5.7 µg/m³Missouri CityMissouri City, 12 March: 6.3 µg/m³Missouri City, 13 March: 16.6 µg/m³Missouri City, 14 March: no readingMissouri City, 15 March: 28.0 µg/m³, 2.8× its usual 10.0Missouri City, 16 March: 2.9 µg/m³Missouri City, 17 March: 4.1 µg/m³Missouri City, 18 March: 5.1 µg/m³ElkhartElkhart, 12 March: 4.3 µg/m³Elkhart, 13 March: 7.7 µg/m³Elkhart, 14 March: 8.9 µg/m³Elkhart, 15 March: 27.9 µg/m³, 4.7× its usual 5.9Elkhart, 16 March: 3.0 µg/m³Elkhart, 17 March: 8.6 µg/m³Elkhart, 18 March: 5.8 µg/m³TaylorTaylor, 12 March: 6.4 µg/m³Taylor, 13 March: 12.3 µg/m³Taylor, 14 March: 19.3 µg/m³Taylor, 15 March: 27.9 µg/m³, 4.1× its usual 6.8Taylor, 16 March: no readingTaylor, 17 March: 2.9 µg/m³Taylor, 18 March: 6.2 µg/m³HammondHammond, 12 March: 4.9 µg/m³Hammond, 13 March: 13.4 µg/m³Hammond, 14 March: 10.9 µg/m³Hammond, 15 March: 27.8 µg/m³, 3.9× its usual 7.1Hammond, 16 March: 5.3 µg/m³Hammond, 17 March: 4.4 µg/m³Hammond, 18 March: 5.2 µg/m³Calumet CityCalumet City, 12 March: 4.7 µg/m³Calumet City, 13 March: 15.1 µg/m³Calumet City, 14 March: 11.2 µg/m³Calumet City, 15 March: 27.6 µg/m³, 3.8× its usual 7.2Calumet City, 16 March: 5.0 µg/m³Calumet City, 17 March: 4.8 µg/m³Calumet City, 18 March: 6.2 µg/m³GalvestonGalveston, 12 March: 5.4 µg/m³Galveston, 13 March: 10.6 µg/m³Galveston, 14 March: 18.1 µg/m³Galveston, 15 March: 27.5 µg/m³, 4.4× its usual 6.3Galveston, 16 March: 4.3 µg/m³Galveston, 17 March: 3.3 µg/m³Galveston, 18 March: 5.8 µg/m³ChicagoChicago, 12 March: 5.0 µg/m³Chicago, 13 March: 11.2 µg/m³Chicago, 14 March: 12.9 µg/m³Chicago, 15 March: 27.5 µg/m³, 4.0× its usual 6.9Chicago, 16 March: 5.1 µg/m³Chicago, 17 March: 5.1 µg/m³Chicago, 18 March: 6.3 µg/m³Elmwood ParkElmwood Park, 12 March: 4.4 µg/m³Elmwood Park, 13 March: 11.1 µg/m³Elmwood Park, 14 March: 16.0 µg/m³Elmwood Park, 15 March: 26.8 µg/m³, 3.8× its usual 7.1Elmwood Park, 16 March: 4.9 µg/m³Elmwood Park, 17 March: 5.5 µg/m³Elmwood Park, 18 March: 7.2 µg/m³BloomingtonBloomington, 12 March: 8.9 µg/m³Bloomington, 13 March: 14.0 µg/m³Bloomington, 14 March: 13.6 µg/m³Bloomington, 15 March: 26.3 µg/m³, 4.4× its usual 6.0Bloomington, 16 March: 4.2 µg/m³Bloomington, 17 March: 3.0 µg/m³Bloomington, 18 March: 6.1 µg/m³JolietJoliet, 12 March: 9.0 µg/m³Joliet, 13 March: 13.9 µg/m³Joliet, 14 March: 12.9 µg/m³Joliet, 15 March: 26.2 µg/m³, 3.4× its usual 7.8Joliet, 16 March: 4.8 µg/m³Joliet, 17 March: 4.6 µg/m³Joliet, 18 March: 5.9 µg/m³NorthbrookNorthbrook, 12 March: 2.5 µg/m³Northbrook, 13 March: 6.9 µg/m³Northbrook, 14 March: 11.0 µg/m³Northbrook, 15 March: 26.1 µg/m³, 4.7× its usual 5.5Northbrook, 16 March: 3.9 µg/m³Northbrook, 17 March: 4.0 µg/m³Northbrook, 18 March: 8.1 µg/m³SpringfieldSpringfield, 12 March: 10.3 µg/m³Springfield, 13 March: 15.1 µg/m³Springfield, 14 March: 11.4 µg/m³Springfield, 15 March: 26.0 µg/m³, 4.2× its usual 6.2Springfield, 16 March: 3.9 µg/m³Springfield, 17 March: 3.5 µg/m³Springfield, 18 March: 5.8 µg/m³College StationCollege Station, 12 March: 6.5 µg/m³College Station, 13 March: 9.1 µg/m³College Station, 14 March: 22.7 µg/m³College Station, 15 March: 26.0 µg/m³, 3.4× its usual 7.7College Station, 16 March: 3.9 µg/m³College Station, 17 March: 5.1 µg/m³College Station, 18 March: 5.4 µg/m³BaytownBaytown, 12 March: 6.0 µg/m³Baytown, 13 March: 17.6 µg/m³Baytown, 14 March: 24.7 µg/m³Baytown, 15 March: 26.0 µg/m³, 2.1× its usual 12.2Baytown, 16 March: 4.5 µg/m³Baytown, 17 March: 6.9 µg/m³Baytown, 18 March: 6.4 µg/m³AppletonAppleton, 12 March: 3.9 µg/m³Appleton, 13 March: 10.5 µg/m³Appleton, 14 March: 11.2 µg/m³Appleton, 15 March: 25.7 µg/m³, 5.1× its usual 4.4Appleton, 16 March: 2.3 µg/m³Appleton, 17 March: 3.2 µg/m³Appleton, 18 March: 5.5 µg/m³Oak LawnOak Lawn, 12 March: 5.3 µg/m³Oak Lawn, 13 March: 12.6 µg/m³Oak Lawn, 14 March: 12.4 µg/m³Oak Lawn, 15 March: 25.6 µg/m³, 3.5× its usual 7.4Oak Lawn, 16 March: 4.6 µg/m³Oak Lawn, 17 March: 4.3 µg/m³Oak Lawn, 18 March: 4.6 µg/m³La PorteLa Porte, 12 March: 5.0 µg/m³La Porte, 13 March: 14.6 µg/m³La Porte, 14 March: 21.8 µg/m³La Porte, 15 March: 25.1 µg/m³, 3.2× its usual 7.8La Porte, 16 March: 3.4 µg/m³La Porte, 17 March: 3.9 µg/m³La Porte, 18 March: 3.7 µg/m³Mission BendMission Bend, 12 March: 5.7 µg/m³Mission Bend, 13 March: 16.9 µg/m³Mission Bend, 14 March: 28.0 µg/m³Mission Bend, 15 March: 25.0 µg/m³, 2.6× its usual 9.5Mission Bend, 16 March: 3.4 µg/m³Mission Bend, 17 March: 4.3 µg/m³Mission Bend, 18 March: 5.4 µg/m³12 Mar131415161718
Every counted city, in the order the episode reached them, 3 days before to 3 after. Each square is a day, coloured by that day's PM2.5; outlined: at twice the city's usual or more.
Good0–50
Moderate51–100
Sensitive groups101–150
Unhealthy151–200
Very unhealthy201–300
Hazardous301+

Every city it reached

CityDaysHighestUsualAbove usual
LemayMissouri, United States1 66.015 March5.811×
East Saint LouisIllinois, United States1 70.115 March7.59.3×
Upper AltonIllinois, United States1 55.615 March6.29.0×
University CityMissouri, United States1 58.415 March6.68.8×
ChampaignIllinois, United States1 50.015 March5.88.6×
Granite CityIllinois, United States1 64.815 March8.08.1×
DecaturIllinois, United States1 51.815 March6.48.1×
St. LouisMissouri, United States1 59.915 March8.07.5×
Michigan CityIndiana, United States1 45.815 March6.27.4×
JenisonMichigan, United States1 39.115 March5.67.0×
HollandMichigan, United States1 39.615 March6.26.4×
PortageIndiana, United States1 38.815 March6.16.4×
Fort WorthTexas, United States1 47.815 March8.06.0×
Little RockArkansas, United States1 51.015 March8.75.9×
CorsicanaTexas, United States1 43.215 March7.35.9×
BeltonTexas, United States1 39.815 March6.95.8×
SpringdaleArkansas, United States1 51.515 March9.05.7×
Grand RapidsMichigan, United States1 34.215 March6.05.7×
SpringfieldMissouri, United States1 39.415 March7.05.6×
AppletonWisconsin, United States1 25.715 March4.45.1×
South BendIndiana, United States1 31.015 March6.25.0×
TexarkanaTexas, United States1 43.415 March8.94.9×
GaryIndiana, United States1 33.615 March6.94.9×
ElkhartIndiana, United States1 27.915 March5.94.7×
NorthbrookIllinois, United States1 26.115 March5.54.7×
LafayetteIndiana, United States1 29.615 March6.54.6×
DentonTexas, United States1 31.115 March7.04.4×
GalvestonTexas, United States1 27.515 March6.34.4×
BloomingtonIllinois, United States1 26.315 March6.04.4×
McAlesterOklahoma, United States1 34.215 March7.94.3×
PeoriaIllinois, United States1 28.315 March6.64.3×
WyomingMichigan, United States1 35.015 March8.34.2×
SpringfieldIllinois, United States1 26.015 March6.24.2×
East ChicagoIndiana, United States1 28.515 March7.04.1×
TaylorTexas, United States1 27.915 March6.84.1×
ChicagoIllinois, United States1 27.515 March6.94.0×
DoltonIllinois, United States1 30.215 March7.73.9×
BrookfieldIllinois, United States1 29.415 March7.53.9×
HammondIndiana, United States1 27.815 March7.13.9×
TulsaOklahoma, United States1 36.815 March9.83.8×
Calumet CityIllinois, United States1 27.615 March7.23.8×
Elmwood ParkIllinois, United States1 26.815 March7.13.8×
SaginawTexas, United States1 28.115 March7.53.7×
Oak LawnIllinois, United States1 25.615 March7.43.5×
ConroeTexas, United States1 34.715 March10.23.4×
JolietIllinois, United States1 26.215 March7.83.4×
College StationTexas, United States1 26.015 March7.73.4×
La PorteTexas, United States1 25.115 March7.83.2×
JenksOklahoma, United States1 28.715 March9.43.1×
PasadenaTexas, United States1 28.515 March10.32.8×
Missouri CityTexas, United States1 28.015 March10.02.8×
HoustonTexas, United States1 30.915 March11.52.7×
Mission BendTexas, United States1 25.015 March9.52.6×
BaytownTexas, United States1 26.015 March12.22.1×

Daily means in µg/m³, over the days each city counted in this episode. Highest: its highest of those days. Usual: the city's median for the time of year of that day (its days within 21 days of the date, every year, leaving out the week around it). Above usual: its highest day against that, with a usual under 5 µg/m³ taken as 5.

Against other episodes in the United States

Number 21 of 130 episodes in the United States since our records began, by cities reached.

Bars: cities reached; colour: the level of the episode's highest daily reading. All 130.

Use this page

SmogRank, Eastern United States, March 2025: 54 cities with PM2.5 at twice their usual or more, 15 March 2025, smogrank.com/episodes/2025-03-eastern-united-states (accessed 4 October 2026).
Download top 10 (PNG)

You're welcome to reuse a single chart, image or figure with this citation and a link. Terms.

An episode is a run of days when many cities close to each other (four or more within 350 km on a day, 8 or more in all) each had a daily PM2.5 mean of at least 25 µg/m³ and at least 2 times their usual for that time of year. Found in our own measurements, not picked by hand. How we find episodes. Values are each city's daily mean of its own monitors; causes are the usual kinds for a pattern like this, not a confirmed source.