SmogRank / Episodes / Italy
Italy, France and Switzerland, June 2025
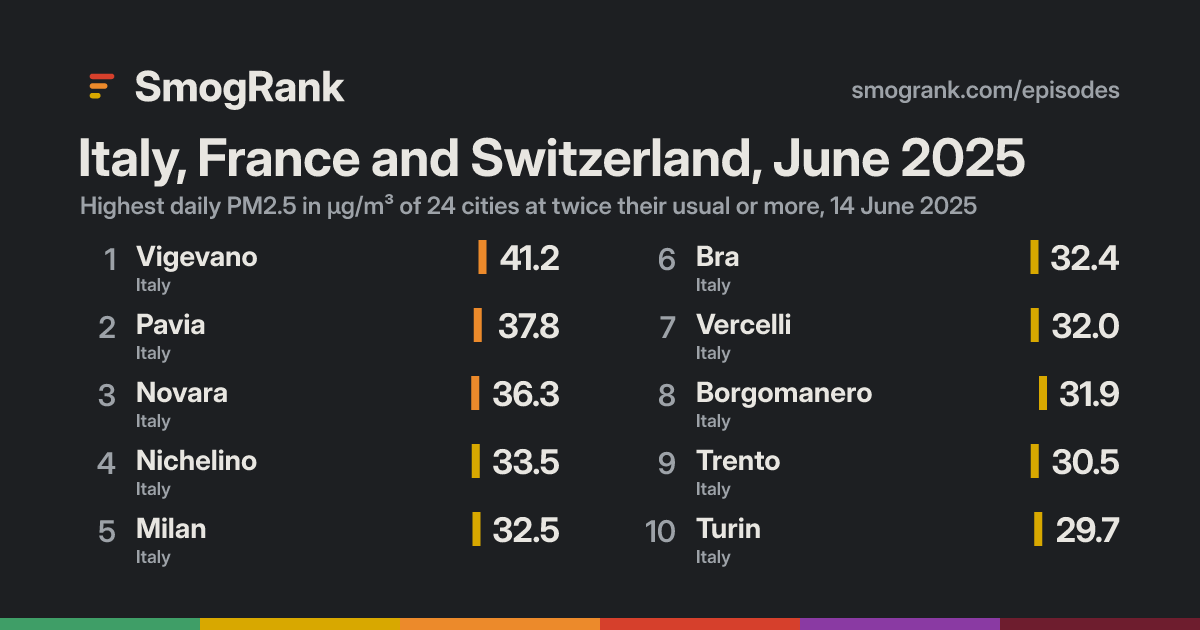
For 1 day, on 14 June 2025, 24 cities in Italy, France, Switzerland and 1 more countries had PM2.5 at least twice their usual for the time of year. The worst reading was Vigevano, Lombardy, Italy: 41.2 µg/m³ on 14 June, about 3.6× its usual 11.6.
No cause named We have no fire or smoke records for these days, so we only say what the measurements show.
Cities reached 24 in 4 countries
Days 1 14 June 2025
Worst day 14 June 24 cities counted
Furthest above usual 3.9× Bellinzona
Day by day
Play 14 June 24 cities at twice their usual or more
Lindau Innsbruck Kempten (Allgäu) Friedrichshafen Konstanz Zürich Winterthur Aosta Biberach an der Riß Starnberg Bern Munich Villingen-Schwenningen Lörrach Basel Saalfelden am Steinernen Meer Gorizia Sallanches Freiburg Müllheim Koper Falconara Marittima Traunreut Albertville Salzburg Burghausen Annemasse Montbéliard Kranj Meylan Klagenfurt am Wörthersee Grenoble Ljubljana Manosque Wels Aix-en-Provence Wolfsberg Villefontaine Bourg-en-Bresse Dole Trbovlje Romans-sur-Isère Novo Mesto Marseille Steyr Valence Celje Marignane Salon-de-Provence Lyon Avignon Amstetten Graz Maribor Arles Saint-Étienne Bihać Ptuj Alessandria Jesi Trento Rovereto Vercelli Mulhouse Nichelino Bolzano Bra Cannes Monaco Biella Capannori Nice Como Borgomanero Novara Pavia Turin Bastia Milan Vigevano Lugano Bellinzona 11 Jun 12 13 14 15 16 17 Every measured city in the area, coloured by its PM2.5 that day; a dark ring marks a city at twice its usual or more. Bars: cities counted each day, coloured by their median level. Choose a day or press play; without JavaScript, the days link to that day's world ranking.
How it spread
Bellinzona Bellinzona, 11 June: 28.6 µg/m³, 3.8× usual Bellinzona, 12 June: 29.6 µg/m³, 3.9× usual Bellinzona, 13 June: no reading Bellinzona, 14 June: 29.4 µg/m³, 3.9× usual Bellinzona, 15 June: no reading Bellinzona, 16 June: no reading Bellinzona, 17 June: no reading Monaco Monaco, 11 June: 28.0 µg/m³, 2.9× usual Monaco, 12 June: no reading Monaco, 13 June: no reading Monaco, 14 June: 27.0 µg/m³, 2.8× usual Monaco, 15 June: no reading Monaco, 16 June: no reading Monaco, 17 June: no reading Cannes Cannes, 11 June: 27.9 µg/m³, 2.7× usual Cannes, 12 June: no reading Cannes, 13 June: no reading Cannes, 14 June: 29.0 µg/m³, 2.8× usual Cannes, 15 June: no reading Cannes, 16 June: no reading Cannes, 17 June: no reading Nice Nice, 11 June: 26.5 µg/m³, 2.7× usual Nice, 12 June: no reading Nice, 13 June: no reading Nice, 14 June: 29.3 µg/m³, 2.9× usual Nice, 15 June: no reading Nice, 16 June: no reading Nice, 17 June: no reading Trento Trento, 11 June: 26.5 µg/m³, 2.2× usual Trento, 12 June: 30.5 µg/m³, 2.6× usual Trento, 13 June: no reading Trento, 14 June: 28.8 µg/m³, 2.4× usual Trento, 15 June: no reading Trento, 16 June: no reading Trento, 17 June: no reading Pavia Pavia, 11 June: 26.3 µg/m³, 2.2× usual Pavia, 12 June: no reading Pavia, 13 June: no reading Pavia, 14 June: 37.8 µg/m³, 3.1× usual Pavia, 15 June: no reading Pavia, 16 June: no reading Pavia, 17 June: no reading Rovereto Rovereto, 11 June: 26.3 µg/m³, 2.3× usual Rovereto, 12 June: 26.7 µg/m³, 2.3× usual Rovereto, 13 June: no reading Rovereto, 14 June: 29.6 µg/m³, 2.6× usual Rovereto, 15 June: no reading Rovereto, 16 June: no reading Rovereto, 17 June: no reading Nichelino Nichelino, 11 June: 26.2 µg/m³, 2.1× usual Nichelino, 12 June: no reading Nichelino, 13 June: no reading Nichelino, 14 June: 33.5 µg/m³, 2.7× usual Nichelino, 15 June: no reading Nichelino, 16 June: no reading Nichelino, 17 June: no reading Bastia Bastia, 11 June: 25.1 µg/m³, 3.0× usual Bastia, 12 June: no reading Bastia, 13 June: no reading Bastia, 14 June: 27.2 µg/m³, 3.2× usual Bastia, 15 June: no reading Bastia, 16 June: no reading Bastia, 17 June: no reading Novara Novara, 11 June: 25.1 µg/m³, 2.1× usual Novara, 12 June: no reading Novara, 13 June: no reading Novara, 14 June: 36.3 µg/m³, 3.1× usual Novara, 15 June: no reading Novara, 16 June: no reading Novara, 17 June: no reading Jesi Jesi, 11 June: 25.0 µg/m³, 2.2× usual Jesi, 12 June: no reading Jesi, 13 June: no reading Jesi, 14 June: 25.1 µg/m³, 2.2× usual Jesi, 15 June: no reading Jesi, 16 June: no reading Jesi, 17 June: no reading Lugano Lugano, 11 June: 23.3 µg/m³, 3.4× usual Lugano, 12 June: 26.2 µg/m³, 3.8× usual Lugano, 13 June: no reading Lugano, 14 June: 26.1 µg/m³, 3.8× usual Lugano, 15 June: no reading Lugano, 16 June: no reading Lugano, 17 June: no reading Bolzano Bolzano, 11 June: 24.4 µg/m³, 2.7× usual Bolzano, 12 June: 25.0 µg/m³, 2.7× usual Bolzano, 13 June: no reading Bolzano, 14 June: 25.9 µg/m³, 2.8× usual Bolzano, 15 June: no reading Bolzano, 16 June: no reading Bolzano, 17 June: no reading Vigevano Vigevano, 11 June: 24.6 µg/m³, 2.1× usual Vigevano, 12 June: no reading Vigevano, 13 June: no reading Vigevano, 14 June: 41.2 µg/m³, 3.6× usual Vigevano, 15 June: no reading Vigevano, 16 June: no reading Vigevano, 17 June: no reading Milan Milan, 11 June: no reading Milan, 12 June: no reading Milan, 13 June: no reading Milan, 14 June: 32.5 µg/m³, 3.3× usual Milan, 15 June: no reading Milan, 16 June: no reading Milan, 17 June: no reading Bra Bra, 11 June: 22.9 µg/m³, 2.0× usual Bra, 12 June: no reading Bra, 13 June: no reading Bra, 14 June: 32.4 µg/m³, 2.8× usual Bra, 15 June: no reading Bra, 16 June: no reading Bra, 17 June: no reading Vercelli Vercelli, 11 June: 23.5 µg/m³, 1.9× usual Vercelli, 12 June: no reading Vercelli, 13 June: no reading Vercelli, 14 June: 32.0 µg/m³, 2.6× usual Vercelli, 15 June: no reading Vercelli, 16 June: no reading Vercelli, 17 June: no reading Borgomanero Borgomanero, 11 June: 24.3 µg/m³, 2.4× usual Borgomanero, 12 June: no reading Borgomanero, 13 June: no reading Borgomanero, 14 June: 31.9 µg/m³, 3.1× usual Borgomanero, 15 June: no reading Borgomanero, 16 June: no reading Borgomanero, 17 June: no reading Turin Turin, 11 June: 23.8 µg/m³, 2.5× usual Turin, 12 June: no reading Turin, 13 June: no reading Turin, 14 June: 29.7 µg/m³, 3.1× usual Turin, 15 June: no reading Turin, 16 June: no reading Turin, 17 June: no reading Como Como, 11 June: no reading Como, 12 June: no reading Como, 13 June: no reading Como, 14 June: 29.5 µg/m³, 3.0× usual Como, 15 June: no reading Como, 16 June: no reading Como, 17 June: no reading Alessandria Alessandria, 11 June: 22.0 µg/m³, 1.7× usual Alessandria, 12 June: no reading Alessandria, 13 June: no reading Alessandria, 14 June: 27.5 µg/m³, 2.1× usual Alessandria, 15 June: no reading Alessandria, 16 June: no reading Alessandria, 17 June: no reading Mulhouse Mulhouse, 11 June: 16.2 µg/m³, 1.6× usual Mulhouse, 12 June: no reading Mulhouse, 13 June: no reading Mulhouse, 14 June: 26.9 µg/m³, 2.6× usual Mulhouse, 15 June: no reading Mulhouse, 16 June: no reading Mulhouse, 17 June: no reading Biella Biella, 11 June: 17.5 µg/m³, 1.9× usual Biella, 12 June: no reading Biella, 13 June: no reading Biella, 14 June: 26.1 µg/m³, 2.9× usual Biella, 15 June: no reading Biella, 16 June: no reading Biella, 17 June: no reading Capannori Capannori, 11 June: no reading Capannori, 12 June: no reading Capannori, 13 June: no reading Capannori, 14 June: 25.3 µg/m³, 2.9× usual Capannori, 15 June: no reading Capannori, 16 June: no reading Capannori, 17 June: no reading 11 Jun 12 13 14 15 16 17 Every counted city, in the order the episode reached them, 3 days before to 3 after. Each square is a day, coloured by that day's PM2.5; outlined: at twice the city's usual or more. Good 0–50
Moderate 51–100
Sensitive groups 101–150
Unhealthy 151–200
Very unhealthy 201–300
Hazardous 301+
Every city it reached
City Days Highest Usual Above usual
Bellinzona Ticino, Switzerland 1 12 June 7.6 3.9× Lugano Ticino, Switzerland 1 12 June 6.9 3.8× Vigevano Lombardy, Italy 1 14 June 11.6 3.6× Milan Lombardy, Italy 1 14 June 10.0 3.3× Bastia Corsica, France 1 14 June 8.5 3.2× Pavia Lombardy, Italy 1 14 June 12.1 3.1× Borgomanero Piedmont, Italy 1 14 June 10.3 3.1× Novara Piedmont, Italy 1 14 June 11.8 3.1× Turin Piedmont, Italy 1 14 June 9.7 3.1× Como Lombardy, Italy 1 14 June 9.9 3.0× Monaco Municipality of Monaco, Monaco 1 11 June 9.5 2.9× Nice Provence-Alpes-Côte d'Azur, France 1 14 June 10.0 2.9× Capannori Tuscany, Italy 1 14 June 8.8 2.9× Biella Piedmont, Italy 1 14 June 9.1 2.9× Bolzano Trentino-Alto Adige, Italy 1 14 June 9.1 2.8× Cannes Provence-Alpes-Côte d'Azur, France 1 14 June 10.2 2.8× Bra Piedmont, Italy 1 14 June 11.6 2.8× Nichelino Piedmont, Italy 1 14 June 12.6 2.7× Vercelli Piedmont, Italy 1 14 June 12.1 2.6× Mulhouse Grand Est, France 1 14 June 10.4 2.6× Rovereto Trentino-Alto Adige, Italy 1 14 June 11.5 2.6× Trento Trentino-Alto Adige, Italy 1 12 June 11.9 2.6× Jesi The Marches, Italy 1 14 June 11.6 2.2× Alessandria Piedmont, Italy 1 14 June 13.2 2.1×
Daily means in µg/m³. Usual: the city's median for this time of year (its days within 21 days of the date, every year, leaving out the week around it). Above usual: its highest day against that.
Against other episodes in Italy and France
Number 11 of 23 episodes in Italy and France since our records began, by cities reached.
Central Europe, February and March 2023 274 Central Europe, December 2025 to January 2026 170 Western Europe, March 2023 119 Southern Europe, December 2023 97 North-eastern Spain and France, February 2023 72 France, The Netherlands and United Kingdom, January 2023 66 Central Europe, June 2025 63 France, Belgium and United Kingdom, November and December 2023 43 France and Belgium, April 2023 36 France, July 2026 26 Italy, France and Switzerland, June 2025 24 Germany, France and Luxembourg, August 2026 16 Bars: cities reached; colour: the level of the episode's highest daily reading. All 23 .
Use this page SmogRank, Italy, France and Switzerland, June 2025: 24 cities with PM2.5 at twice their usual or more, 14 June 2025, smogrank.com/episodes/2025-06-italy-france-and-switzerland (accessed 2 October 2026).
Copy citation Download top 10 (PNG)
You're welcome to reuse a single chart, image or figure with this citation and a link. Terms .
An episode is a run of days when many cities close to each other (four or more within 350 km on a day, 8 or more in all) each had a daily PM2.5 mean of at least 25 µg/m³ and at least 2 times their usual for that time of year. Found in our own measurements, not picked by hand. How we find episodes . Values are each city's daily mean of its own monitors; causes are the usual kinds for a pattern like this, not a confirmed source.