SmogRank / Episodes / United States
North-eastern United States and Canada, July 2025
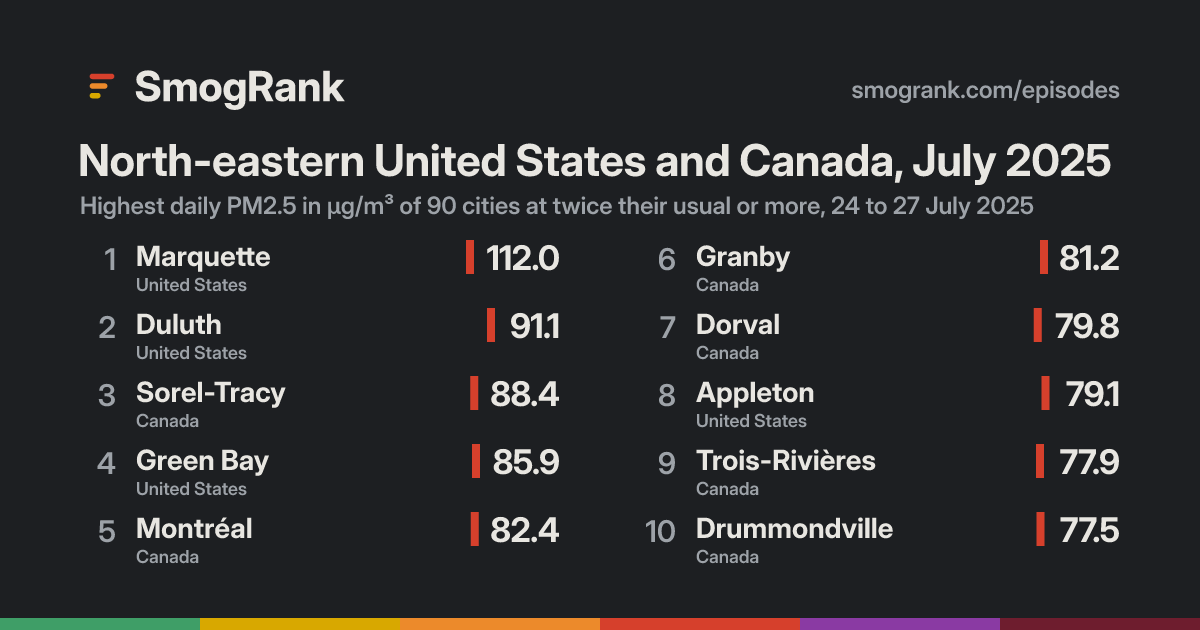
For 4 days, from 24 to 27 July 2025, 90 cities in the United States and Canada had PM2.5 at least twice their usual for the time of year. The worst reading was Sorel-Tracy, Quebec, Canada: 88.4 µg/m³ on 26 July, about 8.8× its usual 10.1.
Day by day
How it spread
Every city it reached
| City | Days | Highest | Above usual |
|---|---|---|---|
| MarquetteMichigan, United States | 2 | 112.030 July | 13× |
| DorvalQuebec, Canada | 3 | 79.826 July | 10.0× |
| SherbrookeQuebec, Canada | 3 | 76.826 July | 10.0× |
| DrummondvilleQuebec, Canada | 3 | 77.526 July | 9.8× |
| MontréalQuebec, Canada | 3 | 82.426 July | 9.8× |
| DuluthMinnesota, United States | 2 | 91.130 July | 9.6× |
| Trois-RivièresQuebec, Canada | 3 | 77.926 July | 9.4× |
| GranbyQuebec, Canada | 3 | 81.226 July | 9.3× |
| Saint-Jean-sur-RichelieuQuebec, Canada | 2 | 63.326 July | 9.3× |
| Rivière-des-Prairies–Pointe-aux-TremblesQuebec, Canada | 3 | 72.926 July | 9.2× |
| Sault Ste. MarieOntario, Canada | 2 | 71.630 July | 9.0× |
| AppletonWisconsin, United States | 1 | 79.130 July | 8.8× |
| Green BayWisconsin, United States | 2 | 85.930 July | 8.8× |
| Sorel-TracyQuebec, Canada | 3 | 88.426 July | 8.8× |
| ShawiniganQuebec, Canada | 3 | 72.326 July | 7.9× |
| BrossardQuebec, Canada | 3 | 70.626 July | 7.8× |
| Greater SudburyOntario, Canada | 2 | 63.130 July | 7.3× |
| Eau ClaireWisconsin, United States | 1 | 59.230 July | 6.7× |
| North BayOntario, Canada | 1 | 53.030 July | 6.6× |
| QuébecQuebec, Canada | 3 | 54.726 July | 6.1× |
| Saint CloudMinnesota, United States | 2 | 53.430 July | 6.1× |
| West FargoNorth Dakota, United States | 1 | 58.330 July | 6.0× |
| White PlainsNew York, United States | 2 | 36.626 July | 6.0× |
| New CityNew York, United States | 2 | 37.526 July | 6.0× |
| North ChicopeeMassachusetts, United States | 2 | 37.826 July | 5.9× |
| BlaineMinnesota, United States | 1 | 49.730 July | 5.8× |
| Rouyn-NorandaQuebec, Canada | 1 | 47.329 July | 5.8× |
| LaconiaNew Hampshire, United States | 1 | 30.926 July | 5.8× |
| NewburghNew York, United States | 1 | 35.326 July | 5.8× |
| L'Ancienne-LoretteQuebec, Canada | 3 | 58.126 July | 5.8× |
| RutlandVermont, United States | 2 | 46.026 July | 5.8× |
| LewistonMaine, United States | 1 | 38.026 July | 5.6× |
| SpringfieldMassachusetts, United States | 2 | 42.626 July | 5.5× |
| KeeneNew Hampshire, United States | 2 | 39.826 July | 5.5× |
| Apple ValleyMinnesota, United States | 1 | 46.030 July | 5.5× |
| PittsfieldMassachusetts, United States | 2 | 41.926 July | 5.4× |
| GreenfieldMassachusetts, United States | 2 | 39.026 July | 5.4× |
| BurnsvilleMinnesota, United States | 1 | 53.830 July | 5.3× |
| MinneapolisMinnesota, United States | 1 | 54.030 July | 5.3× |
| Saint PaulMinnesota, United States | 1 | 53.330 July | 5.3× |
| Saint MichaelMinnesota, United States | 1 | 46.330 July | 5.2× |
| ShakopeeMinnesota, United States | 1 | 49.430 July | 5.0× |
| DanburyConnecticut, United States | 2 | 41.026 July | 4.9× |
| AlbanyNew York, United States | 2 | 47.826 July | 4.9× |
| WaterburyConnecticut, United States | 2 | 38.726 July | 4.8× |
| BayonneNew Jersey, United States | 1 | 27.127 July | 4.8× |
| AugustaMaine, United States | 1 | 36.726 July | 4.6× |
| Fall RiverMassachusetts, United States | 1 | 32.326 July | 4.6× |
| QuincyMassachusetts, United States | 1 | 30.726 July | 4.6× |
| HaverhillMassachusetts, United States | 1 | 28.727 July | 4.4× |
| PortlandMaine, United States | 1 | 39.126 July | 4.4× |
| MilfordMassachusetts, United States | 2 | 27.027 July | 4.4× |
| HartfordConnecticut, United States | 2 | 37.626 July | 4.3× |
| CornwallOntario, Canada | 1 | 34.326 July | 4.3× |
| WorcesterMassachusetts, United States | 2 | 29.926 July | 4.3× |
| HolbrookNew York, United States | 2 | 30.726 July | 4.3× |
| BrookingsSouth Dakota, United States | 1 | 28.824 July | 4.2× |
| DerryNew Hampshire, United States | 1 | 28.927 July | 4.1× |
| BrocktonMassachusetts, United States | 2 | 32.026 July | 4.1× |
| New HavenConnecticut, United States | 2 | 33.226 July | 4.1× |
| LynnMassachusetts, United States | 2 | 28.026 July | 4.1× |
| FraminghamMassachusetts, United States | 1 | 25.127 July | 4.0× |
| LowellMassachusetts, United States | 1 | 27.527 July | 4.0× |
| SewellNew Jersey, United States | 2 | 34.927 July | 4.0× |
| PleasantvilleNew Jersey, United States | 1 | 33.426 July | 3.9× |
| BostonMassachusetts, United States | 2 | 29.626 July | 3.9× |
| Atlantic CityNew Jersey, United States | 1 | 33.026 July | 3.8× |
| LexingtonMassachusetts, United States | 1 | 41.027 July | 3.8× |
| PortsmouthNew Hampshire, United States | 1 | 28.326 July | 3.8× |
| New LondonConnecticut, United States | 2 | 30.326 July | 3.7× |
| New York CityNew York, United States | 2 | 32.627 July | 3.7× |
| Fort LeeNew Jersey, United States | 2 | 28.727 July | 3.7× |
| NorristownPennsylvania, United States | 1 | 27.127 July | 3.7× |
| BridgeportConnecticut, United States | 2 | 31.726 July | 3.6× |
| NepeanOntario, Canada | 1 | 57.630 July | 3.5× |
| SaguenayQuebec, Canada | 1 | 30.530 July | 3.5× |
| RandolphNew Jersey, United States | 1 | 27.927 July | 3.4× |
| PatersonNew Jersey, United States | 1 | 30.427 July | 3.4× |
| PennsaukenNew Jersey, United States | 2 | 30.427 July | 3.3× |
| New BrunswickNew Jersey, United States | 2 | 27.627 July | 3.3× |
| BarrieOntario, Canada | 1 | 30.626 July | 3.1× |
| LebanonPennsylvania, United States | 1 | 26.327 July | 3.0× |
| LindenNew Jersey, United States | 2 | 27.827 July | 3.0× |
| EwingNew Jersey, United States | 1 | 27.727 July | 2.9× |
| BensalemPennsylvania, United States | 1 | 27.527 July | 2.9× |
| Jersey CityNew Jersey, United States | 1 | 26.727 July | 2.8× |
| TrentonNew Jersey, United States | 1 | 26.127 July | 2.8× |
| ElizabethNew Jersey, United States | 1 | 27.427 July | 2.7× |
| NewmarketOntario, Canada | 1 | 25.526 July | 2.6× |
| PhiladelphiaPennsylvania, United States | 1 | 25.927 July | 2.5× |
Daily means in µg/m³. Usual: the city's median for this time of year (its days within 21 days of the date, every year, leaving out the week around it). Above usual: its highest day against that.
Against other episodes in the United States and Canada
Number 13 of 106 episodes in the United States and Canada since our records began, by cities reached.
- North-eastern United States and Canada, June and July 2023279
- North-eastern United States and Canada, July 2026264
- North-eastern United States and Canada, May and June 2023260
- North-eastern United States and Canada, July and August 2025241
- North-eastern United States and Canada, July 2023241
- North-eastern United States and Canada, June 2025196
- North-eastern United States and Canada, June 2023161
- North-eastern United States and Canada, July 2025119
- North-western United States and Canada, August 2023110
- North-eastern United States, June 2025104
- North-western United States and Canada, August 202699
- North-eastern United States and Canada, February 202696
- North-eastern United States and Canada, July 202590
Bars: cities reached; colour: the level of the episode's highest daily reading. All 106.
Use this page
SmogRank, North-eastern United States and Canada, July 2025: 90 cities with PM2.5 at twice their usual or more, 24 to 27 July 2025, smogrank.com/episodes/2025-07-north-eastern-united-states-and-canada-2 (accessed 2 October 2026).
You're welcome to reuse a single chart, image or figure with this citation and a link. Terms.
An episode is a run of days when many cities close to each other (four or more within 350 km on a day, 8 or more in all) each had a daily PM2.5 mean of at least 25 µg/m³ and at least 2 times their usual for that time of year. Found in our own measurements, not picked by hand. How we find episodes. Values are each city's daily mean of its own monitors; causes are the usual kinds for a pattern like this, not a confirmed source.