SmogRank / India / Rajasthan
Air quality in Hanumāngarh
Rajasthan, India. PM2.5 from 1 reference monitor, updated hourly. None of them reported in the last 24 hours.
34.9µg/m³
Moderate Mean for 29 Sept, the most recent day with readings, 2.3× the WHO 24-hour guideline. No hourly readings have reached us since; some networks publish days late.
Rank, worst first 24 hours – not enough data
7 days #55 of 2,302, at 32.0 µg/m³
30 days #78 of 2,311, at 30.8 µg/m³
This year #133 of 2,169, at 30.2 µg/m³
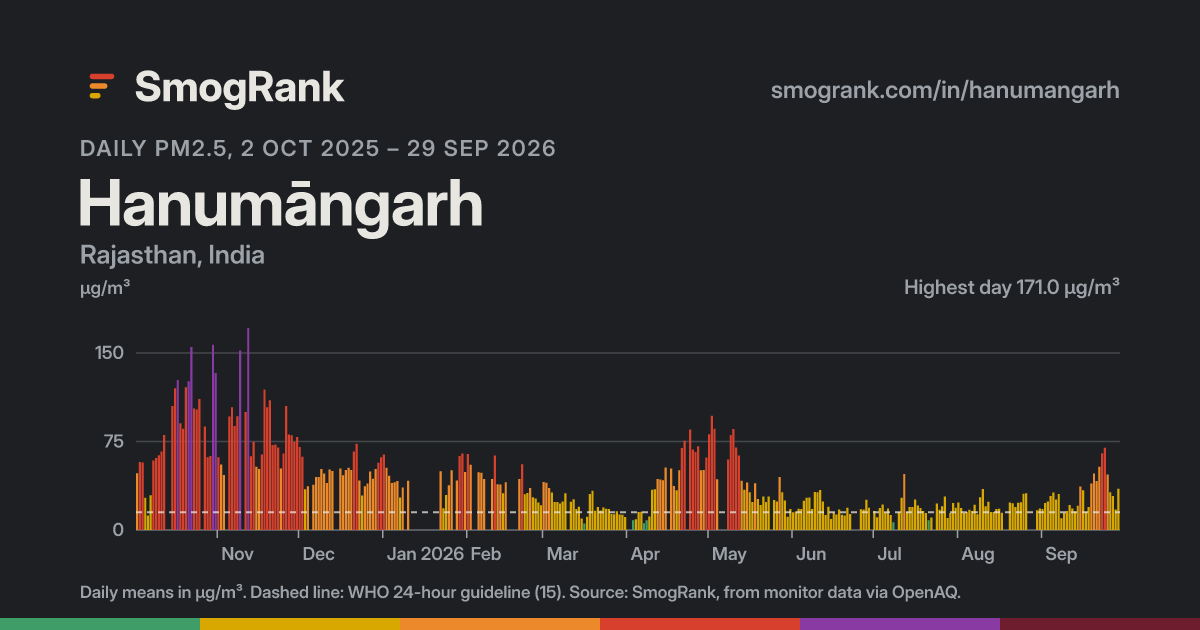
Why it ranks here Chronic pollution. Its typical day over the past year was 33.2 µg/m³, 2.2× the WHO 24-hour guideline, so it ranks high most of the time, not only during events.
Seasonal. Over the past year its worst months were October, November, averaging up to 85.6 µg/m³ against 18.4 in its cleanest month. Seasonal peaks usually come from heating, crop burning, fire or dust seasons.
Based on Hanumāngarh's own measurements; causes are the usual kinds for a pattern like this, not a confirmed source.
The last 12 months, day by day
1 10 20 31 Nov 2025 Dec Jan 2026 Feb Mar Apr May Jun Jul Aug Sep Oct 2025-11-01: 61.7 µg/m³ 2025-11-02: 55.4 µg/m³ 2025-11-03: 46.7 µg/m³ 2025-11-04: no data 2025-11-05: 96.1 µg/m³ 2025-11-06: 104.0 µg/m³ 2025-11-07: 88.2 µg/m³ 2025-11-08: 96.4 µg/m³ 2025-11-09: 152.0 µg/m³ 2025-11-10: no data 2025-11-11: 100.0 µg/m³ 2025-11-12: 171.0 µg/m³ 2025-11-13: 62.5 µg/m³ 2025-11-14: 74.7 µg/m³ 2025-11-15: 53.5 µg/m³ 2025-11-16: 51.8 µg/m³ 2025-11-17: 63.9 µg/m³ 2025-11-18: 119.0 µg/m³ 2025-11-19: 104.0 µg/m³ 2025-11-20: 110.0 µg/m³ 2025-11-21: 71.9 µg/m³ 2025-11-22: 72.5 µg/m³ 2025-11-23: 70.0 µg/m³ 2025-11-24: 52.1 µg/m³ 2025-11-25: 64.7 µg/m³ 2025-11-26: 105.0 µg/m³ 2025-11-27: 81.0 µg/m³ 2025-11-28: 80.2 µg/m³ 2025-11-29: 74.8 µg/m³ 2025-11-30: 78.8 µg/m³ 2025-12-01: 70.3 µg/m³ 2025-12-02: 62.0 µg/m³ 2025-12-03: 34.6 µg/m³ 2025-12-04: 37.0 µg/m³ 2025-12-05: no data 2025-12-06: 38.3 µg/m³ 2025-12-07: 45.0 µg/m³ 2025-12-08: 45.0 µg/m³ 2025-12-09: 51.6 µg/m³ 2025-12-10: 47.9 µg/m³ 2025-12-11: 39.9 µg/m³ 2025-12-12: 51.2 µg/m³ 2025-12-13: 50.1 µg/m³ 2025-12-14: no data 2025-12-15: no data 2025-12-16: 52.2 µg/m³ 2025-12-17: 46.3 µg/m³ 2025-12-18: 50.9 µg/m³ 2025-12-19: 52.7 µg/m³ 2025-12-20: 50.8 µg/m³ 2025-12-21: 66.4 µg/m³ 2025-12-22: 73.0 µg/m³ 2025-12-23: 41.9 µg/m³ 2025-12-24: 29.3 µg/m³ 2025-12-25: 37.1 µg/m³ 2025-12-26: 39.5 µg/m³ 2025-12-27: 49.6 µg/m³ 2025-12-28: 43.5 µg/m³ 2025-12-29: 51.6 µg/m³ 2025-12-30: 57.0 µg/m³ 2025-12-31: 61.6 µg/m³ 2026-01-01: 63.9 µg/m³ 2026-01-02: 52.7 µg/m³ 2026-01-03: 46.0 µg/m³ 2026-01-04: 39.7 µg/m³ 2026-01-05: 40.4 µg/m³ 2026-01-06: 41.5 µg/m³ 2026-01-07: 27.6 µg/m³ 2026-01-08: 36.1 µg/m³ 2026-01-09: no data 2026-01-10: 41.8 µg/m³ 2026-01-11: no data 2026-01-12: no data 2026-01-13: no data 2026-01-14: no data 2026-01-15: no data 2026-01-16: no data 2026-01-17: no data 2026-01-18: no data 2026-01-19: no data 2026-01-20: no data 2026-01-21: no data 2026-01-22: 49.7 µg/m³ 2026-01-23: 18.5 µg/m³ 2026-01-24: 29.6 µg/m³ 2026-01-25: 37.9 µg/m³ 2026-01-26: 50.7 µg/m³ 2026-01-27: no data 2026-01-28: 41.9 µg/m³ 2026-01-29: 62.8 µg/m³ 2026-01-30: 64.7 µg/m³ 2026-01-31: 49.2 µg/m³ 2026-02-01: 64.5 µg/m³ 2026-02-02: 55.2 µg/m³ 2026-02-03: no data 2026-02-04: no data 2026-02-05: 49.0 µg/m³ 2026-02-06: 48.5 µg/m³ 2026-02-07: 43.3 µg/m³ 2026-02-08: no data 2026-02-09: no data 2026-02-10: 43.1 µg/m³ 2026-02-11: 63.1 µg/m³ 2026-02-12: 38.7 µg/m³ 2026-02-13: 38.5 µg/m³ 2026-02-14: 31.2 µg/m³ 2026-02-15: 40.4 µg/m³ 2026-02-16: no data 2026-02-17: no data 2026-02-18: no data 2026-02-19: no data 2026-02-20: 43.1 µg/m³ 2026-02-21: 55.7 µg/m³ 2026-02-22: 30.3 µg/m³ 2026-02-23: 31.4 µg/m³ 2026-02-24: 35.6 µg/m³ 2026-02-25: 27.7 µg/m³ 2026-02-26: 26.6 µg/m³ 2026-02-27: 23.3 µg/m³ 2026-02-28: 20.9 µg/m³ 2026-03-01: 40.6 µg/m³ 2026-03-02: 40.0 µg/m³ 2026-03-03: 35.6 µg/m³ 2026-03-04: 31.8 µg/m³ 2026-03-05: 23.6 µg/m³ 2026-03-06: 23.6 µg/m³ 2026-03-07: 22.5 µg/m³ 2026-03-08: 24.2 µg/m³ 2026-03-09: 31.1 µg/m³ 2026-03-10: no data 2026-03-11: 24.0 µg/m³ 2026-03-12: 26.1 µg/m³ 2026-03-13: 17.9 µg/m³ 2026-03-14: 19.7 µg/m³ 2026-03-15: 9.8 µg/m³ 2026-03-16: 5.6 µg/m³ 2026-03-17: 11.2 µg/m³ 2026-03-18: 30.6 µg/m³ 2026-03-19: 33.2 µg/m³ 2026-03-20: 16.3 µg/m³ 2026-03-21: 19.6 µg/m³ 2026-03-22: 16.4 µg/m³ 2026-03-23: 19.0 µg/m³ 2026-03-24: 18.0 µg/m³ 2026-03-25: 17.9 µg/m³ 2026-03-26: 13.6 µg/m³ 2026-03-27: 13.3 µg/m³ 2026-03-28: 15.9 µg/m³ 2026-03-29: 13.2 µg/m³ 2026-03-30: 13.0 µg/m³ 2026-03-31: 11.1 µg/m³ 2026-04-01: no data 2026-04-02: no data 2026-04-03: 8.3 µg/m³ 2026-04-04: 9.1 µg/m³ 2026-04-05: 15.3 µg/m³ 2026-04-06: 15.4 µg/m³ 2026-04-07: 5.8 µg/m³ 2026-04-08: 8.2 µg/m³ 2026-04-09: 11.5 µg/m³ 2026-04-10: 34.1 µg/m³ 2026-04-11: 34.5 µg/m³ 2026-04-12: 43.3 µg/m³ 2026-04-13: 42.7 µg/m³ 2026-04-14: 42.1 µg/m³ 2026-04-15: 53.0 µg/m³ 2026-04-16: no data 2026-04-17: 52.0 µg/m³ 2026-04-18: 37.2 µg/m³ 2026-04-19: 33.6 µg/m³ 2026-04-20: 50.6 µg/m³ 2026-04-21: 69.5 µg/m³ 2026-04-22: 75.6 µg/m³ 2026-04-23: no data 2026-04-24: 85.1 µg/m³ 2026-04-25: 68.1 µg/m³ 2026-04-26: 66.1 µg/m³ 2026-04-27: 70.9 µg/m³ 2026-04-28: 50.7 µg/m³ 2026-04-29: 50.9 µg/m³ 2026-04-30: 61.4 µg/m³ 2026-05-01: 81.1 µg/m³ 2026-05-02: 96.8 µg/m³ 2026-05-03: 85.7 µg/m³ 2026-05-04: 43.0 µg/m³ 2026-05-05: no data 2026-05-06: no data 2026-05-07: no data 2026-05-08: 59.7 µg/m³ 2026-05-09: 80.4 µg/m³ 2026-05-10: 85.5 µg/m³ 2026-05-11: 69.8 µg/m³ 2026-05-12: 63.2 µg/m³ 2026-05-13: 41.8 µg/m³ 2026-05-14: 34.1 µg/m³ 2026-05-15: 40.2 µg/m³ 2026-05-16: 31.9 µg/m³ 2026-05-17: 23.8 µg/m³ 2026-05-18: 39.6 µg/m³ 2026-05-19: 26.3 µg/m³ 2026-05-20: 21.3 µg/m³ 2026-05-21: 28.5 µg/m³ 2026-05-22: 23.6 µg/m³ 2026-05-23: 28.4 µg/m³ 2026-05-24: no data 2026-05-25: 25.3 µg/m³ 2026-05-26: 24.1 µg/m³ 2026-05-27: 44.9 µg/m³ 2026-05-28: 32.0 µg/m³ 2026-05-29: 24.9 µg/m³ 2026-05-30: 11.2 µg/m³ 2026-05-31: 17.8 µg/m³ 2026-06-01: 15.0 µg/m³ 2026-06-02: 15.7 µg/m³ 2026-06-03: 18.0 µg/m³ 2026-06-04: 17.7 µg/m³ 2026-06-05: 24.8 µg/m³ 2026-06-06: 27.3 µg/m³ 2026-06-07: 27.6 µg/m³ 2026-06-08: 17.9 µg/m³ 2026-06-09: 32.2 µg/m³ 2026-06-10: 31.9 µg/m³ 2026-06-11: 34.0 µg/m³ 2026-06-12: 24.2 µg/m³ 2026-06-13: 12.8 µg/m³ 2026-06-14: 19.7 µg/m³ 2026-06-15: 9.4 µg/m³ 2026-06-16: 14.7 µg/m³ 2026-06-17: 13.2 µg/m³ 2026-06-18: 17.3 µg/m³ 2026-06-19: 12.9 µg/m³ 2026-06-20: 12.3 µg/m³ 2026-06-21: 18.9 µg/m³ 2026-06-22: 13.6 µg/m³ 2026-06-23: no data 2026-06-24: no data 2026-06-25: no data 2026-06-26: 17.5 µg/m³ 2026-06-27: 17.4 µg/m³ 2026-06-28: 25.6 µg/m³ 2026-06-29: 18.8 µg/m³ 2026-06-30: no data 2026-07-01: 16.1 µg/m³ 2026-07-02: 10.8 µg/m³ 2026-07-03: 18.7 µg/m³ 2026-07-04: 21.6 µg/m³ 2026-07-05: 15.0 µg/m³ 2026-07-06: 18.2 µg/m³ 2026-07-07: 12.6 µg/m³ 2026-07-08: 6.5 µg/m³ 2026-07-09: no data 2026-07-10: 15.0 µg/m³ 2026-07-11: 27.3 µg/m³ 2026-07-12: 47.5 µg/m³ 2026-07-13: 15.4 µg/m³ 2026-07-14: 19.5 µg/m³ 2026-07-15: 19.4 µg/m³ 2026-07-16: 25.9 µg/m³ 2026-07-17: 20.7 µg/m³ 2026-07-18: 18.6 µg/m³ 2026-07-19: 16.2 µg/m³ 2026-07-20: 14.4 µg/m³ 2026-07-21: 8.2 µg/m³ 2026-07-22: 10.7 µg/m³ 2026-07-23: no data 2026-07-24: 22.5 µg/m³ 2026-07-25: 17.1 µg/m³ 2026-07-26: 20.2 µg/m³ 2026-07-27: 28.4 µg/m³ 2026-07-28: 10.2 µg/m³ 2026-07-29: 14.4 µg/m³ 2026-07-30: 23.0 µg/m³ 2026-07-31: 18.9 µg/m³ 2026-08-01: 23.3 µg/m³ 2026-08-02: 18.6 µg/m³ 2026-08-03: 14.3 µg/m³ 2026-08-04: 15.3 µg/m³ 2026-08-05: 17.1 µg/m³ 2026-08-06: 16.1 µg/m³ 2026-08-07: 21.4 µg/m³ 2026-08-08: 13.4 µg/m³ 2026-08-09: 27.8 µg/m³ 2026-08-10: 34.8 µg/m³ 2026-08-11: 20.2 µg/m³ 2026-08-12: 24.0 µg/m³ 2026-08-13: 15.3 µg/m³ 2026-08-14: 15.2 µg/m³ 2026-08-15: 17.9 µg/m³ 2026-08-16: 18.0 µg/m³ 2026-08-17: 14.6 µg/m³ 2026-08-18: no data 2026-08-19: no data 2026-08-20: 23.2 µg/m³ 2026-08-21: 22.7 µg/m³ 2026-08-22: 19.6 µg/m³ 2026-08-23: 23.1 µg/m³ 2026-08-24: 23.5 µg/m³ 2026-08-25: 30.7 µg/m³ 2026-08-26: 31.1 µg/m³ 2026-08-27: no data 2026-08-28: no data 2026-08-29: no data 2026-08-30: 16.7 µg/m³ 2026-08-31: 18.1 µg/m³ 2026-09-01: 17.9 µg/m³ 2026-09-02: 23.0 µg/m³ 2026-09-03: 24.2 µg/m³ 2026-09-04: 28.9 µg/m³ 2026-09-05: 31.8 µg/m³ 2026-09-06: 25.9 µg/m³ 2026-09-07: 30.5 µg/m³ 2026-09-08: 9.9 µg/m³ 2026-09-09: 14.3 µg/m³ 2026-09-10: 16.2 µg/m³ 2026-09-11: 21.2 µg/m³ 2026-09-12: 18.3 µg/m³ 2026-09-13: 15.7 µg/m³ 2026-09-14: 20.6 µg/m³ 2026-09-15: 36.9 µg/m³ 2026-09-16: 33.7 µg/m³ 2026-09-17: 15.5 µg/m³ 2026-09-18: 19.4 µg/m³ 2026-09-19: 39.5 µg/m³ 2026-09-20: 47.8 µg/m³ 2026-09-21: 41.6 µg/m³ 2026-09-22: 53.5 µg/m³ 2026-09-23: 65.1 µg/m³ 2026-09-24: 69.7 µg/m³ 2026-09-25: 47.1 µg/m³ 2026-09-26: 31.9 µg/m³ 2026-09-27: 28.8 µg/m³ 2026-09-28: 17.3 µg/m³ 2026-09-29: 34.9 µg/m³ 2026-09-30: no data 2026-10-01: no data 276 of 314 measured days were over the WHO 24-hour guideline (15 µg/m³). One row per month, one square per local day. Good 0–9.0
Moderate 9.1–35.4
Sensitive groups 35.5–55.4
Unhealthy 55.5–125.4
Very unhealthy 125.5–225.4
Hazardous 225.5+
Hour by hour No hourly readings in the last few days. The chart returns when the monitors' data arrives.
Where it stood each day Top 10 Top 100 #1 #10 #100 #1,000 #2,508 Nov Dec Jan Feb Mar Apr May Jun Jul Aug Sep #76 Its rank on each day's world board, #1 being the most polluted city that day. The scale is logarithmic: each step down is ten times as many cities. See it among every city . 2026 against 2025, month by month 15 Jan 2026: 44.2 µg/m³ Jan Feb 2026: 40.5 µg/m³ Feb Mar 2025: 56.6 µg/m³ Mar 2026: 21.3 µg/m³ Mar Apr 2025: 66.4 µg/m³ Apr 2026: 42.1 µg/m³ Apr May 2025: 54.5 µg/m³ May 2026: 43.9 µg/m³ May Jun 2025: 39.3 µg/m³ Jun 2026: 19.6 µg/m³ Jun Jul 2025: 13.5 µg/m³ Jul 2026: 18.4 µg/m³ Jul Aug 2025: 16.8 µg/m³ Aug 2026: 20.6 µg/m³ Aug Sep 2025: 23.6 µg/m³ Sep 2026: 30.4 µg/m³ Sep Oct 2025: 83.8 µg/m³ Oct Nov 2025: 84.4 µg/m³ Nov Dec 2025: 49.2 µg/m³ Dec Faded bars: 2025. A month shows once it has 10 measured days. This week against past years This week This week: 32.0 µg/m³ 32.0 2025 2025: 39.6 µg/m³ 39.6 Mean PM2.5 for 25 Sept to 1 Oct in each year. Dashed line: WHO 24-hour guideline. Monitors
Station Operator Type Housing Board, Hanumangarh - RSPCBGODL-India Rajasthan State Pollution Control Board Reference
The city's value is the median of its reference monitors each hour, when at least a third of them report (three are always enough); low-cost sensors are listed but not counted when reference monitors exist. Data via OpenAQ; licences as listed. How we rank . Embed this on your site .
Use this page SmogRank, PM2.5 daily means, Hanumāngarh, India, 2 Oct 2025 – 1 Oct 2026, smogrank.com/in/hanumangarh (accessed 2 Oct 2026).
Copy citation Download chart (PNG) Embed a live widget
You're welcome to reuse a single chart, image or figure with this citation and a link. Terms .
Other cities in India 30-day averages, µg/m³. All of India .
Updated 2026-10-02 01:07 UTC. Values are PM2.5 in µg/m³ (fine particles), the median of each city's monitors.