SmogRank / World / North America / United States / Oregon
Most polluted cities in Oregon, United States
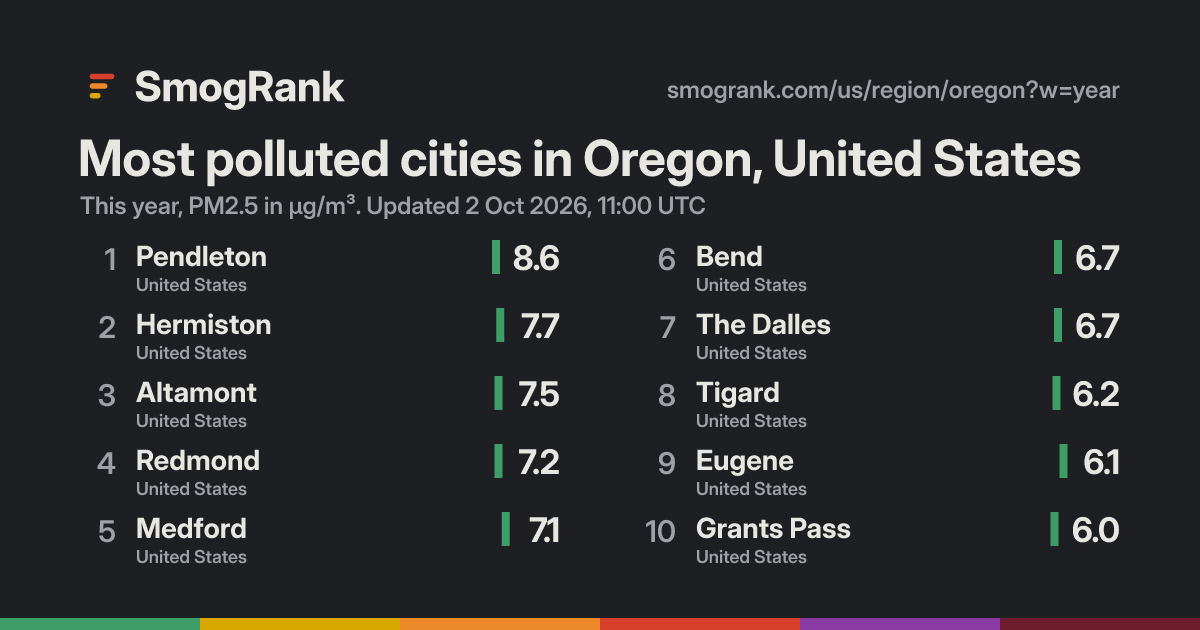
27 measured cities, this year; 17 above the WHO annual guideline. Worst: Pendleton at 8.6 µg/m³, #1,450 in the world.
- 1Pendleton 481.7×▼256
- 2Hermiston 431.5×▼293
- 3Altamont 421.5×▼259
- 4Redmond 401.4×▼285
- 5Medford 391.4×▼261
- 6Bend 371.3×▼265
- 7The Dalles 371.3×▼292
- 8Tigard 341.2×▼273
- 9Eugene 341.2×▼265
- 10Grants Pass 331.2×▼274
- 11Hillsboro 331.2×▼274
- 12Albany 311.1×▼273
- 13Gresham 311.1×▼272
- 14Canby 311.1×▼274
- 15Salem 311.1×▼273
- 16Oregon City 301.1×▼273
- 17Ashland 291.0×▼279
- 18Woodburn 281.0×▼276
- 19Roseburg 271.0×▼274
- 20Beaverton 271.0×▼272
- 21Portland 271.0×▼271
- 22Milwaukie 250.9×▼278
- 23Coos Bay 240.9×▼278
- 24Dallas 230.8×▼278
- 25Corvallis 220.8×▼278
- 26McMinnville 220.8×▼277
- 27Forest Grove 210.7×▼276
The US EPA's Air Quality Index for PM2.5 (2024 breakpoints). Show values as: µg/m³ · US AQI · India AQI · China AQI · European AQI · UK DAQI · Canada AQHI+. About the scales
Estimated: cities without a monitor
Oregon cities we can't measure, with model estimates for the last 7 days. Listed by population, not ranked: estimates aren't precise enough to rank. Model estimates from the Copernicus Atmosphere Monitoring Service (CAMS), adjusted to measured cities nearby where there are any. Adjusted, a single day lands within ×1.5 of what a monitor would read about two times in three; unadjusted, it can be off by half or double. Treat them as a guide, not a measurement.
| City | 7-day estimate |
|---|---|
| Springfield | ≈ 3 µg/m³ |
| Aloha | ≈ 3 µg/m³ |
| Lake Oswego | ≈ 3 µg/m³ |
| Keizer | ≈ 2 µg/m³ |
| Tualatin | ≈ 3 µg/m³ |
| West Linn | ≈ 3 µg/m³ |
| Newberg | ≈ 3 µg/m³ |
| Wilsonville | ≈ 3 µg/m³ |
| Klamath Falls | ≈ 3 µg/m³ |
| Bethany | ≈ 3 µg/m³ |
| Hayesville | ≈ 3 µg/m³ |
| Sherwood | ≈ 3 µg/m³ |
| Happy Valley | ≈ 4 µg/m³ |
| Central Point | ≈ 3 µg/m³ |
| Troutdale | ≈ 4 µg/m³ |
| Oak Grove | ≈ 3 µg/m³ |
| Lebanon | ≈ 3 µg/m³ |
| Four Corners | ≈ 3 µg/m³ |
Bad-air episodes in Oregon
- California, United States, December 202313 to 18 December 2023, 6 days20 cities59Bakersfield
- North-western United States, October and November 202331 October to 2 November 2023, 3 days15 cities38Salem
- Oregon, United States, September 202323 to 24 September 2023, 2 days8 cities73Ashland
- North-western United States and Canada, August 202317 to 31 August 2023, 15 days110 cities597Kamloops
Times when many cities around here had PM2.5 at twice their usual or more on the same days.
Use this board
SmogRank, most polluted cities in Oregon, United States, PM2.5, this year to 2 Oct 2026, 10:00 UTC, smogrank.com/us/region/oregon?w=year.
You're welcome to reuse a single chart, image or figure with this citation and a link. Terms.
Updated 2026-10-02 10:07 UTC. Values are PM2.5 (fine particles), the median of each city's monitors, as the US AQI PM2.5 sub-index.