SmogRank / World / North America / Canada / British Columbia
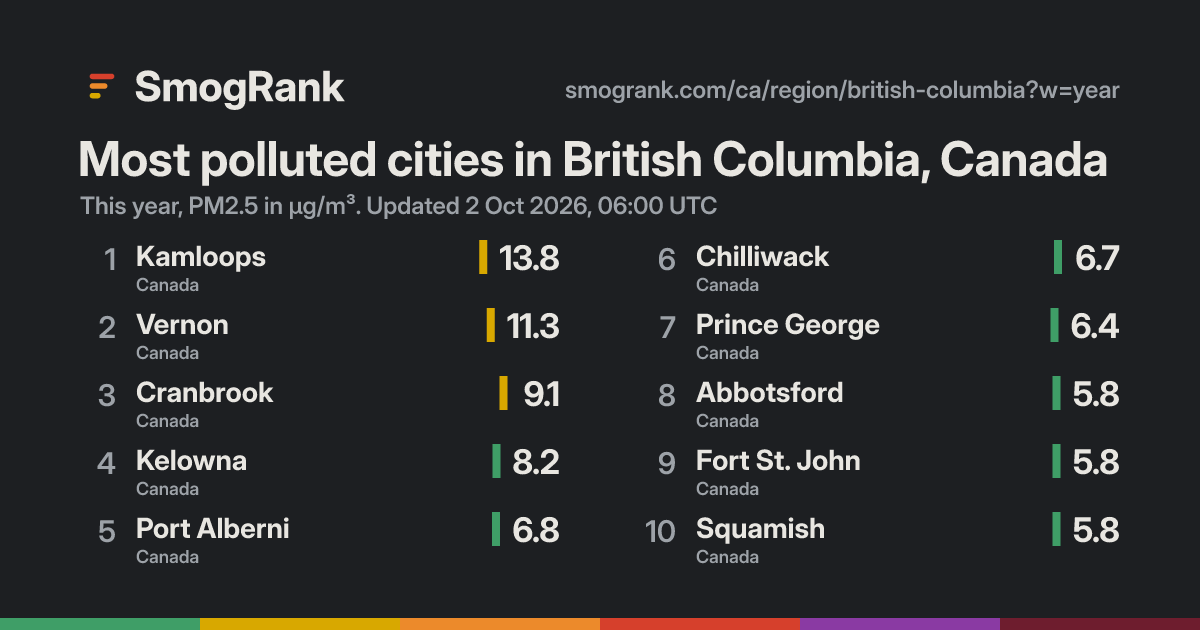
Most polluted cities in British Columbia, Canada
26 measured cities, this year; 16 above the WHO annual guideline. Worst: Kamloops at 13.8 µg/m³, #641 in the world.
- 1Kamloops 22.8×▼280
- 2Vernon 22.3×▼274
- 3Cranbrook 11.8×▼220
- 4Kelowna 11.6×▼261
- 5Port Alberni 11.4×▼272
- 6Chilliwack 11.3×▼278
- 7Prince George 11.3×▼282
- 8Abbotsford 11.2×▼280
- 9Fort St. John 11.2×▼271
- 10Squamish 11.2×▼278
- 11Harewood 11.1×▼270
- 12Victoria 11.1×▼283
- 13Vancouver 11.0×▼289
- 14Burnaby 11.0×▼287
- 15Coquitlam 11.0×▼286
- 16Langley 11.0×▼284
- 17Strawberry Hill 11.0×▼286
- 18Port Coquitlam 11.0×▼283
- 19Richmond 11.0×▼281
- 20Nanaimo 10.9×▼285
- 21Terrace 10.9×▼288
- 22North Vancouver 10.9×▼287
- 23Delta 10.8×▼288
- 24West Vancouver 10.8×▼285
- 25Campbell River 10.7×▼287
- 26North Cowichan 10.7×▼287
Canada's AQHI+ for PM2.5 (1 point per 10 µg/m³), which is defined on hourly values. Show values as: µg/m³ · US AQI · India AQI · China AQI · European AQI · UK DAQI · Canada AQHI+. About the scales
Estimated: cities without a monitor
British Columbia cities we can't measure, with model estimates for the last 7 days. Listed by population, not ranked: estimates aren't precise enough to rank. Model estimates from the Copernicus Atmosphere Monitoring Service (CAMS), adjusted to measured cities nearby where there are any. Adjusted, a single day lands within ×1.5 of what a monitor would read about two times in three; unadjusted, it can be off by half or double. Treat them as a guide, not a measurement.
| City | 7-day estimate |
|---|---|
| Surrey | ≈ 6 µg/m³ |
| Saanich | ≈ 4 µg/m³ |
| Maple Ridge | ≈ 6 µg/m³ |
| New Westminster | ≈ 6 µg/m³ |
| Fleetwood | ≈ 6 µg/m³ |
| Mission | ≈ 4 µg/m³ |
| Penticton | ≈ 2 µg/m³ |
| Victoria-Fraserview | ≈ 5 µg/m³ |
| West Kelowna | ≈ 2 µg/m³ |
| Port Moody | ≈ 6 µg/m³ |
| White Rock | ≈ 6 µg/m³ |
| Riley Park | ≈ 5 µg/m³ |
| Salmon Arm | ≈ 4 µg/m³ |
| Pitt Meadows | ≈ 6 µg/m³ |
| Oak Bay | ≈ 4 µg/m³ |
| Esquimalt | ≈ 5 µg/m³ |
| Central Saanich | ≈ 5 µg/m³ |
| Colwood | ≈ 5 µg/m³ |
| Lake Country | ≈ 3 µg/m³ |
| Sooke | ≈ 5 µg/m³ |
Use this board
SmogRank, most polluted cities in British Columbia, Canada, PM2.5, this year to 2 Oct 2026, 04:00 UTC, smogrank.com/ca/region/british-columbia?w=year.
You're welcome to reuse a single chart, image or figure with this citation and a link. Terms.
Updated 2026-10-02 04:07 UTC. Values are PM2.5 (fine particles), the median of each city's monitors, as the Canada AQHI+ PM2.5 sub-index.