SmogRank / Episodes / United States
Northern United States, January 2023
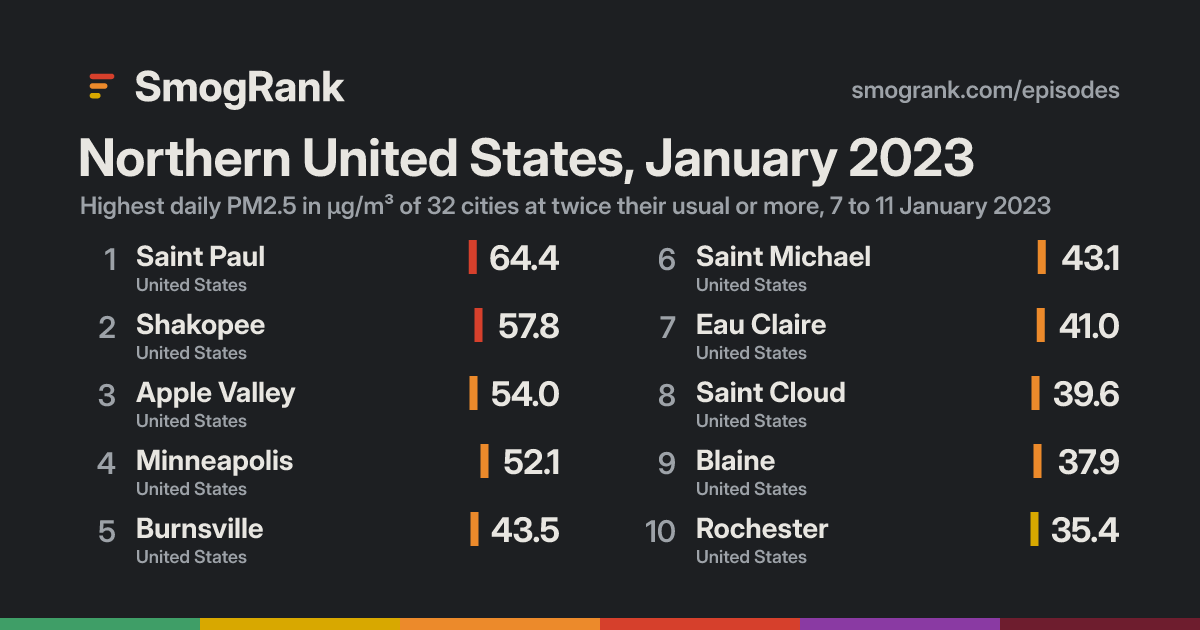
For 5 days, from 7 to 11 January 2023, 36 cities in the United States had PM2.5 at least twice their usual for the time of year. The worst reading was Saint Paul, Minnesota, United States: 64.4 µg/m³ on 10 January, about 11× its usual 6.0. Ended 11 January.
Few fires were detected near these cities on those days. Spreads like this usually come from still weather trapping smoke from heating, traffic and industry, or from dust.
Cities reached 36 in 1 country
Days 5 7 to 11 January 2023
Worst day 11 January 21 cities counted
Furthest above usual 11× Saint Paul
Day by day
Play 11 January 21 cities at twice their usual or more
La Crosse Baraboo Clinton Rockford Davenport Moline Muscatine Duluth Cloquet Greendale Winthrop Harbor Naperville Northbrook Joliet Braidwood Oak Lawn Chicago Calumet City Hammond East Chicago Gary Portage Marshall Holland Hudsonville South Bend Grand Rapids Elkhart Omaha Sioux Falls Blair Brookings Lansing Sault Ste. Marie Bay City Tecumseh Flint Ypsilanti Toledo Taylor Dearborn Lincoln Park Detroit Windsor New Baltimore Port Huron Sarnia Redford Waterloo Franklin Park Des Plaines South Milwaukee Kalamazoo Iowa City Jenison Madison Cary Cedar Rapids Waukesha Zion Milwaukee Green Bay Appleton Vermillion Aberdeen Des Moines Watertown Ankeny Rochester Superior Eau Claire Altoona West Fargo Detroit Lakes Brainerd Blaine Burnsville Saint Cloud Saint Michael Minneapolis Apple Valley Shakopee Saint Paul On the map: 7 fire detections, no smoke traced in this area.
4 Jan 5 6 7 8 9 10 11 12 13 14 Every measured city in the area, coloured by its PM2.5 that day; a dark ring marks a city at twice its usual or more. Bars: cities counted each day, coloured by their median level. Choose a day or press play; without JavaScript, the days link to that day's world ranking. Fires, seen Heat satellites detected that day (via NASA FIRMS); bigger and glowing means more detections in the area. Farm burning and other fires count too, not only wildfires.Smoke, traced Outlined by NOAA analysts from satellite images, light to heavy. Traced for North America only; it can be high above the ground.Under the cities, for each UTC day: fires satellites detected (via NASA FIRMS), smoke NOAA analysts traced and volcanic ash warnings for aircraft. They show what was in the air, not that it caused the readings.
Fires: NASA FIRMS (VIIRS). Traced smoke: NOAA Hazard Mapping System. Volcanic ash: aviation ash warnings (SIGMETs) via NOAA's Aviation Weather Center.
How it spread
Saint Paul Saint Paul, 4 January: 2.3 µg/m³ Saint Paul, 5 January: 4.9 µg/m³ Saint Paul, 6 January: 17.4 µg/m³ Saint Paul, 7 January: 42.4 µg/m³, 6.7× its usual 6.3 Saint Paul, 8 January: 38.6 µg/m³, 6.3× its usual 6.1 Saint Paul, 9 January: 31.1 µg/m³, 5.2× its usual 6.0 Saint Paul, 10 January: 64.4 µg/m³, 11× its usual 6.0 Saint Paul, 11 January: 42.7 µg/m³, 7.0× its usual 6.1 Saint Paul, 12 January: 14.4 µg/m³ Saint Paul, 13 January: 9.9 µg/m³ Saint Paul, 14 January: 10.1 µg/m³ Minneapolis Minneapolis, 4 January: 3.4 µg/m³ Minneapolis, 5 January: 7.2 µg/m³ Minneapolis, 6 January: 17.8 µg/m³ Minneapolis, 7 January: 36.7 µg/m³, 5.6× its usual 6.5 Minneapolis, 8 January: 34.1 µg/m³, 5.3× its usual 6.4 Minneapolis, 9 January: 31.3 µg/m³, 4.9× its usual 6.4 Minneapolis, 10 January: 52.1 µg/m³, 8.0× its usual 6.5 Minneapolis, 11 January: 40.3 µg/m³, 6.0× its usual 6.7 Minneapolis, 12 January: 13.5 µg/m³ Minneapolis, 13 January: 9.5 µg/m³ Minneapolis, 14 January: 10.0 µg/m³ Rochester Rochester, 4 January: 5.2 µg/m³ Rochester, 5 January: 6.4 µg/m³ Rochester, 6 January: 15.3 µg/m³ Rochester, 7 January: 34.8 µg/m³, 5.2× its usual 6.7 Rochester, 8 January: 29.7 µg/m³, 4.5× its usual 6.6 Rochester, 9 January: 22.4 µg/m³ Rochester, 10 January: 35.4 µg/m³, 5.4× its usual 6.5 Rochester, 11 January: no reading Rochester, 12 January: no reading Rochester, 13 January: no reading Rochester, 14 January: no reading Shakopee Shakopee, 4 January: 2.8 µg/m³ Shakopee, 5 January: 6.0 µg/m³ Shakopee, 6 January: 22.2 µg/m³ Shakopee, 7 January: 33.8 µg/m³, 5.3× its usual 6.4 Shakopee, 8 January: 34.6 µg/m³, 5.9× its usual 5.9 Shakopee, 9 January: 33.5 µg/m³, 5.7× its usual 5.9 Shakopee, 10 January: 57.8 µg/m³, 9.8× its usual 5.9 Shakopee, 11 January: no reading Shakopee, 12 January: no reading Shakopee, 13 January: no reading Shakopee, 14 January: no reading Saint Michael Saint Michael, 4 January: no reading Saint Michael, 5 January: no reading Saint Michael, 6 January: 21.9 µg/m³ Saint Michael, 7 January: 33.5 µg/m³, 6.0× its usual 5.6 Saint Michael, 8 January: no reading Saint Michael, 9 January: no reading Saint Michael, 10 January: no reading Saint Michael, 11 January: 43.1 µg/m³, 7.7× its usual 5.6 Saint Michael, 12 January: 9.6 µg/m³ Saint Michael, 13 January: 7.7 µg/m³ Saint Michael, 14 January: 10.1 µg/m³ Apple Valley Apple Valley, 4 January: 4.5 µg/m³ Apple Valley, 5 January: 6.6 µg/m³ Apple Valley, 6 January: 19.4 µg/m³ Apple Valley, 7 January: 31.4 µg/m³, 5.5× its usual 5.7 Apple Valley, 8 January: 29.7 µg/m³, 5.4× its usual 5.5 Apple Valley, 9 January: 28.7 µg/m³, 5.2× its usual 5.5 Apple Valley, 10 January: 54.0 µg/m³, 9.8× its usual 5.5 Apple Valley, 11 January: 43.5 µg/m³, 7.9× its usual 5.5 Apple Valley, 12 January: 13.6 µg/m³ Apple Valley, 13 January: 10.1 µg/m³ Apple Valley, 14 January: 10.2 µg/m³ Altoona Altoona, 4 January: 2.7 µg/m³ Altoona, 5 January: 3.1 µg/m³ Altoona, 6 January: 13.0 µg/m³ Altoona, 7 January: 31.4 µg/m³, 4.8× its usual 6.6 Altoona, 8 January: 23.8 µg/m³ Altoona, 9 January: 28.6 µg/m³, 4.5× its usual 6.3 Altoona, 10 January: 41.0 µg/m³, 6.3× its usual 6.5 Altoona, 11 January: no reading Altoona, 12 January: no reading Altoona, 13 January: no reading Altoona, 14 January: no reading Eau Claire Eau Claire, 4 January: 2.7 µg/m³ Eau Claire, 5 January: 3.1 µg/m³ Eau Claire, 6 January: 13.0 µg/m³ Eau Claire, 7 January: 31.4 µg/m³, 4.7× its usual 6.7 Eau Claire, 8 January: 23.8 µg/m³ Eau Claire, 9 January: 28.6 µg/m³, 4.5× its usual 6.4 Eau Claire, 10 January: 41.0 µg/m³, 6.3× its usual 6.5 Eau Claire, 11 January: 36.9 µg/m³, 5.5× its usual 6.7 Eau Claire, 12 January: 12.2 µg/m³ Eau Claire, 13 January: 4.6 µg/m³ Eau Claire, 14 January: 6.9 µg/m³ Saint Cloud Saint Cloud, 4 January: 3.5 µg/m³ Saint Cloud, 5 January: 6.2 µg/m³ Saint Cloud, 6 January: 18.5 µg/m³ Saint Cloud, 7 January: 29.3 µg/m³, 5.4× its usual 5.4 Saint Cloud, 8 January: 25.4 µg/m³, 4.7× its usual 5.4 Saint Cloud, 9 January: 39.6 µg/m³, 7.3× its usual 5.4 Saint Cloud, 10 January: 35.0 µg/m³, 6.5× its usual 5.4 Saint Cloud, 11 January: 30.0 µg/m³, 5.6× its usual 5.4 Saint Cloud, 12 January: 7.1 µg/m³ Saint Cloud, 13 January: 7.4 µg/m³ Saint Cloud, 14 January: 10.0 µg/m³ Des Moines Des Moines, 4 January: 8.9 µg/m³ Des Moines, 5 January: 5.9 µg/m³ Des Moines, 6 January: 14.3 µg/m³ Des Moines, 7 January: 27.8 µg/m³, 5.2× its usual 5.3 Des Moines, 8 January: no reading Des Moines, 9 January: 12.2 µg/m³ Des Moines, 10 January: 11.5 µg/m³ Des Moines, 11 January: 18.1 µg/m³ Des Moines, 12 January: 9.2 µg/m³ Des Moines, 13 January: 5.6 µg/m³ Des Moines, 14 January: 7.1 µg/m³ Ankeny Ankeny, 4 January: 9.2 µg/m³ Ankeny, 5 January: 5.5 µg/m³ Ankeny, 6 January: 15.0 µg/m³ Ankeny, 7 January: 27.1 µg/m³, 5.4× its usual 4.8 Ankeny, 8 January: 23.7 µg/m³ Ankeny, 9 January: 14.2 µg/m³ Ankeny, 10 January: 12.7 µg/m³ Ankeny, 11 January: 19.8 µg/m³ Ankeny, 12 January: 10.0 µg/m³ Ankeny, 13 January: 5.3 µg/m³ Ankeny, 14 January: 8.8 µg/m³ Waterloo Waterloo, 4 January: 7.6 µg/m³ Waterloo, 5 January: 7.0 µg/m³ Waterloo, 6 January: 15.4 µg/m³ Waterloo, 7 January: 26.0 µg/m³, 2.8× its usual 9.3 Waterloo, 8 January: 21.6 µg/m³ Waterloo, 9 January: 19.6 µg/m³ Waterloo, 10 January: 18.1 µg/m³ Waterloo, 11 January: no reading Waterloo, 12 January: no reading Waterloo, 13 January: no reading Waterloo, 14 January: no reading West Fargo West Fargo, 4 January: 19.5 µg/m³ West Fargo, 5 January: 17.8 µg/m³ West Fargo, 6 January: 23.5 µg/m³ West Fargo, 7 January: 23.4 µg/m³ West Fargo, 8 January: 33.0 µg/m³, 6.6× its usual 4.4 West Fargo, 9 January: no reading West Fargo, 10 January: no reading West Fargo, 11 January: 27.4 µg/m³, 5.5× its usual 4.6 West Fargo, 12 January: 6.6 µg/m³ West Fargo, 13 January: 10.1 µg/m³ West Fargo, 14 January: 16.9 µg/m³ Watertown Watertown, 4 January: 5.0 µg/m³ Watertown, 5 January: 9.0 µg/m³ Watertown, 6 January: 19.8 µg/m³ Watertown, 7 January: 19.1 µg/m³ Watertown, 8 January: 29.5 µg/m³, 5.3× its usual 5.6 Watertown, 9 January: 16.9 µg/m³ Watertown, 10 January: 10.4 µg/m³ Watertown, 11 January: 12.6 µg/m³ Watertown, 12 January: 7.3 µg/m³ Watertown, 13 January: 5.4 µg/m³ Watertown, 14 January: 10.9 µg/m³ Superior Superior, 4 January: 3.4 µg/m³ Superior, 5 January: 3.0 µg/m³ Superior, 6 January: 5.1 µg/m³ Superior, 7 January: 6.8 µg/m³ Superior, 8 January: 26.8 µg/m³, 5.4× its usual 4.9 Superior, 9 January: 28.8 µg/m³, 5.8× its usual 4.9 Superior, 10 January: 17.7 µg/m³ Superior, 11 January: 17.6 µg/m³ Superior, 12 January: 5.6 µg/m³ Superior, 13 January: 3.7 µg/m³ Superior, 14 January: 7.3 µg/m³ Aberdeen Aberdeen, 4 January: no reading Aberdeen, 5 January: no reading Aberdeen, 6 January: 10.6 µg/m³ Aberdeen, 7 January: 12.7 µg/m³ Aberdeen, 8 January: 25.9 µg/m³, 5.2× its usual 4.6 Aberdeen, 9 January: 13.6 µg/m³ Aberdeen, 10 January: 8.1 µg/m³ Aberdeen, 11 January: 9.3 µg/m³ Aberdeen, 12 January: 6.2 µg/m³ Aberdeen, 13 January: 5.4 µg/m³ Aberdeen, 14 January: 9.0 µg/m³ Vermillion Vermillion, 4 January: 6.9 µg/m³ Vermillion, 5 January: 7.8 µg/m³ Vermillion, 6 January: 15.5 µg/m³ Vermillion, 7 January: 24.4 µg/m³ Vermillion, 8 January: 25.6 µg/m³, 5.1× its usual 4.8 Vermillion, 9 January: 10.9 µg/m³ Vermillion, 10 January: 6.1 µg/m³ Vermillion, 11 January: no reading Vermillion, 12 January: no reading Vermillion, 13 January: no reading Vermillion, 14 January: no reading Brainerd Brainerd, 4 January: 3.5 µg/m³ Brainerd, 5 January: 5.3 µg/m³ Brainerd, 6 January: 17.8 µg/m³ Brainerd, 7 January: 24.2 µg/m³ Brainerd, 8 January: 21.4 µg/m³ Brainerd, 9 January: 33.5 µg/m³, 6.7× its usual 4.8 Brainerd, 10 January: 25.2 µg/m³, 5.0× its usual 4.8 Brainerd, 11 January: no reading Brainerd, 12 January: no reading Brainerd, 13 January: no reading Brainerd, 14 January: no reading Blaine Blaine, 4 January: no reading Blaine, 5 January: 2.4 µg/m³ Blaine, 6 January: 1.6 µg/m³ Blaine, 7 January: 1.3 µg/m³ Blaine, 8 January: 1.2 µg/m³ Blaine, 9 January: 12.4 µg/m³ Blaine, 10 January: 37.9 µg/m³, 6.8× its usual 5.6 Blaine, 11 January: no reading Blaine, 12 January: no reading Blaine, 13 January: no reading Blaine, 14 January: no reading Detroit Lakes Detroit Lakes, 4 January: 5.3 µg/m³ Detroit Lakes, 5 January: 7.5 µg/m³ Detroit Lakes, 6 January: 12.4 µg/m³ Detroit Lakes, 7 January: 15.2 µg/m³ Detroit Lakes, 8 January: 18.2 µg/m³ Detroit Lakes, 9 January: 22.2 µg/m³ Detroit Lakes, 10 January: 33.2 µg/m³, 6.6× its usual 4.7 Detroit Lakes, 11 January: no reading Detroit Lakes, 12 January: no reading Detroit Lakes, 13 January: no reading Detroit Lakes, 14 January: no reading Appleton Appleton, 4 January: 7.8 µg/m³ Appleton, 5 January: 6.3 µg/m³ Appleton, 6 January: 4.3 µg/m³ Appleton, 7 January: 7.1 µg/m³ Appleton, 8 January: 14.6 µg/m³ Appleton, 9 January: 24.4 µg/m³ Appleton, 10 January: 28.3 µg/m³, 5.0× its usual 5.7 Appleton, 11 January: 24.7 µg/m³ Appleton, 12 January: 6.0 µg/m³ Appleton, 13 January: 1.9 µg/m³ Appleton, 14 January: 8.2 µg/m³ Green Bay Green Bay, 4 January: 7.6 µg/m³ Green Bay, 5 January: 5.4 µg/m³ Green Bay, 6 January: 4.1 µg/m³ Green Bay, 7 January: 7.5 µg/m³ Green Bay, 8 January: 14.4 µg/m³ Green Bay, 9 January: 23.5 µg/m³ Green Bay, 10 January: 27.7 µg/m³, 4.9× its usual 5.6 Green Bay, 11 January: no reading Green Bay, 12 January: no reading Green Bay, 13 January: no reading Green Bay, 14 January: no reading Burnsville Burnsville, 4 January: no reading Burnsville, 5 January: no reading Burnsville, 6 January: no reading Burnsville, 7 January: no reading Burnsville, 8 January: no reading Burnsville, 9 January: no reading Burnsville, 10 January: no reading Burnsville, 11 January: 43.5 µg/m³, 7.0× its usual 6.2 Burnsville, 12 January: 14.2 µg/m³ Burnsville, 13 January: 10.1 µg/m³ Burnsville, 14 January: 9.8 µg/m³ Waukesha Waukesha, 4 January: 9.3 µg/m³ Waukesha, 5 January: 14.9 µg/m³ Waukesha, 6 January: 7.5 µg/m³ Waukesha, 7 January: 9.6 µg/m³ Waukesha, 8 January: 13.3 µg/m³ Waukesha, 9 January: 20.7 µg/m³ Waukesha, 10 January: 24.9 µg/m³ Waukesha, 11 January: 30.2 µg/m³, 4.5× its usual 6.7 Waukesha, 12 January: 9.4 µg/m³ Waukesha, 13 January: 3.2 µg/m³ Waukesha, 14 January: 9.1 µg/m³ Milwaukee Milwaukee, 4 January: no reading Milwaukee, 5 January: no reading Milwaukee, 6 January: no reading Milwaukee, 7 January: no reading Milwaukee, 8 January: no reading Milwaukee, 9 January: no reading Milwaukee, 10 January: no reading Milwaukee, 11 January: 30.0 µg/m³, 4.6× its usual 6.5 Milwaukee, 12 January: 10.0 µg/m³ Milwaukee, 13 January: 3.6 µg/m³ Milwaukee, 14 January: 9.3 µg/m³ South Milwaukee South Milwaukee, 4 January: 9.9 µg/m³ South Milwaukee, 5 January: 15.2 µg/m³ South Milwaukee, 6 January: 7.6 µg/m³ South Milwaukee, 7 January: 9.8 µg/m³ South Milwaukee, 8 January: 12.6 µg/m³ South Milwaukee, 9 January: 19.1 µg/m³ South Milwaukee, 10 January: 21.2 µg/m³ South Milwaukee, 11 January: 28.5 µg/m³, 3.6× its usual 7.9 South Milwaukee, 12 January: 10.4 µg/m³ South Milwaukee, 13 January: 4.1 µg/m³ South Milwaukee, 14 January: 9.3 µg/m³ Kalamazoo Kalamazoo, 4 January: 10.4 µg/m³ Kalamazoo, 5 January: 12.1 µg/m³ Kalamazoo, 6 January: 12.5 µg/m³ Kalamazoo, 7 January: 11.3 µg/m³ Kalamazoo, 8 January: 12.7 µg/m³ Kalamazoo, 9 January: 18.6 µg/m³ Kalamazoo, 10 January: 21.4 µg/m³ Kalamazoo, 11 January: 28.4 µg/m³, 3.7× its usual 7.6 Kalamazoo, 12 January: 23.9 µg/m³ Kalamazoo, 13 January: 4.3 µg/m³ Kalamazoo, 14 January: 6.4 µg/m³ Redford Redford, 4 January: 13.6 µg/m³ Redford, 5 January: 11.4 µg/m³ Redford, 6 January: 16.0 µg/m³ Redford, 7 January: 8.8 µg/m³ Redford, 8 January: 12.5 µg/m³ Redford, 9 January: 17.5 µg/m³ Redford, 10 January: 26.6 µg/m³ Redford, 11 January: 28.1 µg/m³, 2.1× its usual 13.4 Redford, 12 January: 19.5 µg/m³ Redford, 13 January: 6.2 µg/m³ Redford, 14 January: 7.1 µg/m³ Madison Madison, 4 January: 9.1 µg/m³ Madison, 5 January: 10.2 µg/m³ Madison, 6 January: 10.4 µg/m³ Madison, 7 January: 11.2 µg/m³ Madison, 8 January: 12.8 µg/m³ Madison, 9 January: 21.2 µg/m³ Madison, 10 January: 22.2 µg/m³ Madison, 11 January: 26.8 µg/m³, 4.2× its usual 6.4 Madison, 12 January: 11.8 µg/m³ Madison, 13 January: 4.1 µg/m³ Madison, 14 January: 7.8 µg/m³ Iowa City Iowa City, 4 January: no reading Iowa City, 5 January: no reading Iowa City, 6 January: no reading Iowa City, 7 January: no reading Iowa City, 8 January: no reading Iowa City, 9 January: no reading Iowa City, 10 January: no reading Iowa City, 11 January: 26.7 µg/m³, 3.9× its usual 6.9 Iowa City, 12 January: 22.9 µg/m³ Iowa City, 13 January: 7.6 µg/m³ Iowa City, 14 January: 9.6 µg/m³ Jenison Jenison, 4 January: 8.8 µg/m³ Jenison, 5 January: 11.3 µg/m³ Jenison, 6 January: 7.3 µg/m³ Jenison, 7 January: 5.1 µg/m³ Jenison, 8 January: 11.5 µg/m³ Jenison, 9 January: 17.9 µg/m³ Jenison, 10 January: 20.5 µg/m³ Jenison, 11 January: 26.3 µg/m³, 4.2× its usual 6.3 Jenison, 12 January: 14.4 µg/m³ Jenison, 13 January: 2.2 µg/m³ Jenison, 14 January: 5.4 µg/m³ Zion Zion, 4 January: 7.8 µg/m³ Zion, 5 January: 13.4 µg/m³ Zion, 6 January: 7.1 µg/m³ Zion, 7 January: 9.8 µg/m³ Zion, 8 January: 12.0 µg/m³ Zion, 9 January: 18.7 µg/m³ Zion, 10 January: 18.1 µg/m³ Zion, 11 January: 25.9 µg/m³, 4.6× its usual 5.6 Zion, 12 January: 10.5 µg/m³ Zion, 13 January: 3.5 µg/m³ Zion, 14 January: 8.3 µg/m³ Franklin Park Franklin Park, 4 January: 8.3 µg/m³ Franklin Park, 5 January: 13.1 µg/m³ Franklin Park, 6 January: 9.2 µg/m³ Franklin Park, 7 January: 10.7 µg/m³ Franklin Park, 8 January: 14.4 µg/m³ Franklin Park, 9 January: 19.7 µg/m³ Franklin Park, 10 January: 19.2 µg/m³ Franklin Park, 11 January: 25.8 µg/m³, 3.0× its usual 8.7 Franklin Park, 12 January: 13.7 µg/m³ Franklin Park, 13 January: 4.8 µg/m³ Franklin Park, 14 January: 8.8 µg/m³ Cedar Rapids Cedar Rapids, 4 January: no reading Cedar Rapids, 5 January: no reading Cedar Rapids, 6 January: no reading Cedar Rapids, 7 January: no reading Cedar Rapids, 8 January: no reading Cedar Rapids, 9 January: no reading Cedar Rapids, 10 January: no reading Cedar Rapids, 11 January: 25.5 µg/m³, 4.3× its usual 5.9 Cedar Rapids, 12 January: 19.4 µg/m³ Cedar Rapids, 13 January: 6.6 µg/m³ Cedar Rapids, 14 January: 10.2 µg/m³ Cary Cary, 4 January: 8.5 µg/m³ Cary, 5 January: 13.3 µg/m³ Cary, 6 January: 7.5 µg/m³ Cary, 7 January: 11.6 µg/m³ Cary, 8 January: 11.6 µg/m³ Cary, 9 January: 19.3 µg/m³ Cary, 10 January: 18.7 µg/m³ Cary, 11 January: 25.3 µg/m³, 4.3× its usual 5.9 Cary, 12 January: 12.7 µg/m³ Cary, 13 January: 3.0 µg/m³ Cary, 14 January: 8.4 µg/m³ Des Plaines Des Plaines, 4 January: 8.2 µg/m³ Des Plaines, 5 January: 13.1 µg/m³ Des Plaines, 6 January: 8.3 µg/m³ Des Plaines, 7 January: 11.0 µg/m³ Des Plaines, 8 January: 14.9 µg/m³ Des Plaines, 9 January: 20.1 µg/m³ Des Plaines, 10 January: 18.3 µg/m³ Des Plaines, 11 January: 25.3 µg/m³, 3.6× its usual 7.0 Des Plaines, 12 January: 12.7 µg/m³ Des Plaines, 13 January: 3.9 µg/m³ Des Plaines, 14 January: 9.1 µg/m³ 4 Jan 6 8 10 12 14 Every counted city, in the order the episode reached them, 3 days before to 3 after. Each square is a day, coloured by that day's PM2.5; outlined: at twice the city's usual or more. Good 0–50
Moderate 51–100
Unhealthy for sensitive groups 101–150
Unhealthy 151–200
Very unhealthy 201–300
Hazardous 301+
Every city it reached
City Days Highest Usual Above usual
Saint Paul Minnesota, United States 5 10 January 6.0 11× Shakopee Minnesota, United States 4 10 January 5.9 9.8× Apple Valley Minnesota, United States 5 10 January 5.5 9.8× Minneapolis Minnesota, United States 5 10 January 6.5 8.0× Saint Michael Minnesota, United States 2 11 January 5.6 7.7× Saint Cloud Minnesota, United States 5 9 January 5.4 7.3× Burnsville Minnesota, United States 1 11 January 6.2 7.0× Blaine Minnesota, United States 1 10 January 5.6 6.8× Brainerd Minnesota, United States 2 9 January 4.8 6.7× Detroit Lakes Minnesota, United States 1 10 January 4.7 6.6× West Fargo North Dakota, United States 2 8 January 4.4 6.6× Altoona Wisconsin, United States 3 10 January 6.5 6.3× Eau Claire Wisconsin, United States 4 10 January 6.5 6.3× Superior Wisconsin, United States 2 9 January 4.9 5.8× Rochester Minnesota, United States 3 10 January 6.5 5.4× Ankeny Iowa, United States 1 7 January 4.8 5.4× Watertown South Dakota, United States 1 8 January 5.6 5.3× Des Moines Iowa, United States 1 7 January 5.3 5.2× Aberdeen South Dakota, United States 1 8 January 4.6 5.2× Vermillion South Dakota, United States 1 8 January 4.8 5.1× Appleton Wisconsin, United States 1 10 January 5.7 5.0× Green Bay Wisconsin, United States 1 10 January 5.6 4.9× Milwaukee Wisconsin, United States 1 11 January 6.5 4.6× Zion Illinois, United States 1 11 January 5.6 4.6× Waukesha Wisconsin, United States 1 11 January 6.7 4.5× Cedar Rapids Iowa, United States 1 11 January 5.9 4.3× Cary Illinois, United States 1 11 January 5.9 4.3× Madison Wisconsin, United States 1 11 January 6.4 4.2× Jenison Michigan, United States 1 11 January 6.3 4.2× Iowa City Iowa, United States 1 11 January 6.9 3.9× Kalamazoo Michigan, United States 1 11 January 7.6 3.7× South Milwaukee Wisconsin, United States 1 11 January 7.9 3.6× Des Plaines Illinois, United States 1 11 January 7.0 3.6× Franklin Park Illinois, United States 1 11 January 8.7 3.0× Waterloo Iowa, United States 1 7 January 9.3 2.8× Redford Michigan, United States 1 11 January 13.4 2.1×
Daily means in µg/m³, over the days each city counted in this episode. Highest: its highest of those days. Usual: the city's median for the time of year of that day (its days within 21 days of the date, every year, leaving out the week either side of it). Above usual: its highest day against that, with a usual under 5 µg/m³ taken as 5.
Compared with other episodes in the United States
Number 38 of 151 episodes in the United States since our records began, by cities reached.
Eastern United States and Canada, June and July 2023 343 Northern United States and Canada, July 2026 328 United States and Canada, July 2023 322 Eastern United States and Canada, May and June 2023 317 North-eastern United States and Canada, 29 July to 9 August 2025 292 Northern United States and Canada, May and June 2025 247 United States and Canada, June 2023 195 North-western United States and Canada, August 2023 176 North-western United States and Canada, 4 to 22 August 2026 149 Northern United States and Canada, July 2025 140 Northern United States and Canada, June 2025 134 North-western United States and Canada, July and August 2026 117 Northern United States, January 2023 36 Bars: cities reached; colour: the level of the episode's highest daily reading. All 151 .
Use this page SmogRank, Northern United States, January 2023: 36 cities with PM2.5 at twice their usual or more, 7 to 11 January 2023, smogrank.com/episodes/2023-01-northern-united-states (accessed 17 November 2026).
Share Copy citation Download top 10 (PNG)
You're welcome to reuse a single chart, image or figure with this citation and a link. Terms .
An episode is a run of days when many cities close to each other (four or more within 350 km on a day, 8 or more in all) each had a daily PM2.5 mean of at least 25 µg/m³ and at least 2 times their usual for that time of year. Found in our own measurements, not picked by hand. How we find episodes . Values are each city's daily mean of its own monitors; causes are the usual kinds for a pattern like this, not a confirmed source. Fire detections from NASA FIRMS; smoke maps from NOAA HMS.