SmogRank / Episodes / United States
Northern United States and Canada, May 2023
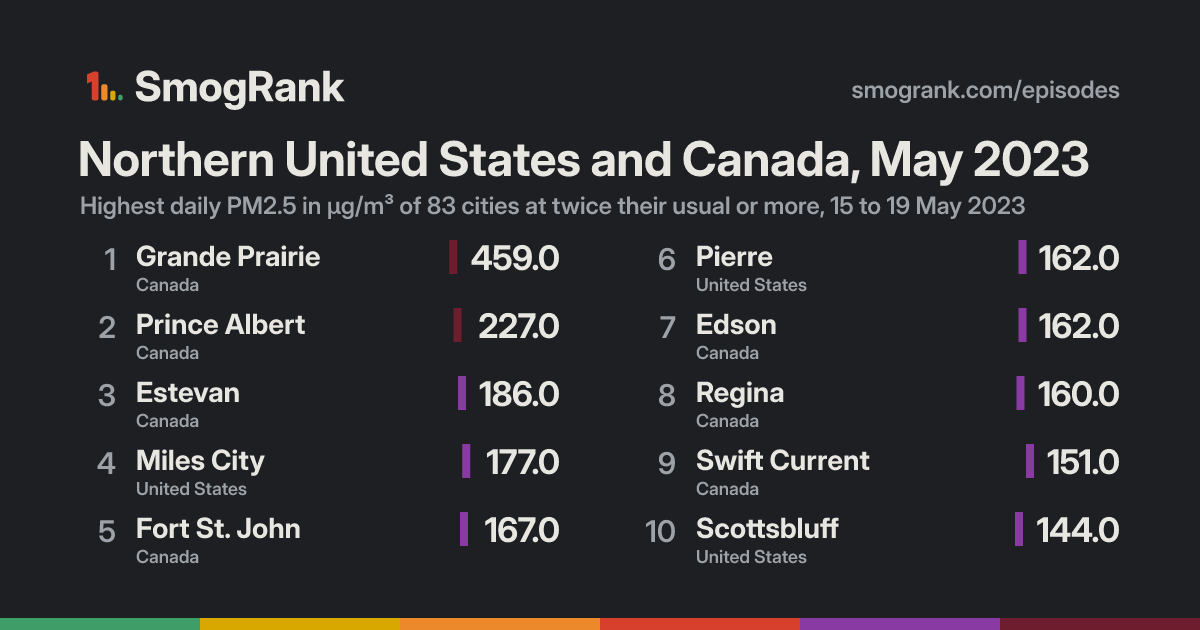
For 5 days, from 15 to 19 May 2023, 83 cities in the United States and Canada had PM2.5 at least twice their usual for the time of year. The worst reading was Grande Prairie, Alberta, Canada: 459.0 µg/m³ on 18 May, about 92× its usual 4.1. Ended 19 May.
Day by day
How it spread
Every city it reached
| City | Days | Highest | Above usual |
|---|---|---|---|
| Grande PrairieAlberta, Canada | 4 | 459.018 May | 92× |
| Miles CityMontana, United States | 2 | 177.017 May | 34× |
| Prince AlbertSaskatchewan, Canada | 2 | 227.016 May | 33× |
| PierreSouth Dakota, United States | 2 | 162.018 May | 32× |
| Fort St. JohnBritish Columbia, Canada | 4 | 167.018 May | 32× |
| EdsonAlberta, Canada | 4 | 162.016 May | 32× |
| ReginaSaskatchewan, Canada | 1 | 160.017 May | 30× |
| Swift CurrentSaskatchewan, Canada | 1 | 151.017 May | 30× |
| EstevanSaskatchewan, Canada | 1 | 186.017 May | 29× |
| ScottsbluffNebraska, United States | 1 | 144.018 May | 29× |
| AirdrieAlberta, Canada | 3 | 130.017 May | 26× |
| Red DeerAlberta, Canada | 2 | 134.516 May | 24× |
| SaskatoonSaskatchewan, Canada | 2 | 138.017 May | 22× |
| CalgaryAlberta, Canada | 3 | 130.517 May | 21× |
| KamloopsBritish Columbia, Canada | 2 | 99.517 May | 20× |
| Prince GeorgeBritish Columbia, Canada | 4 | 95.416 May | 19× |
| Williams LakeBritish Columbia, Canada | 3 | 92.517 May | 19× |
| Detroit LakesMinnesota, United States | 1 | 89.218 May | 18× |
| MarshallMinnesota, United States | 1 | 87.218 May | 17× |
| Rapid CitySouth Dakota, United States | 2 | 90.218 May | 17× |
| VermillionSouth Dakota, United States | 1 | 85.718 May | 17× |
| QuesnelBritish Columbia, Canada | 3 | 96.217 May | 17× |
| AberdeenSouth Dakota, United States | 2 | 82.818 May | 17× |
| West FargoNorth Dakota, United States | 2 | 99.018 May | 17× |
| CranbrookBritish Columbia, Canada | 2 | 75.618 May | 15× |
| St. AlbertAlberta, Canada | 2 | 77.617 May | 15× |
| Columbia FallsMontana, United States | 2 | 73.817 May | 15× |
| LethbridgeAlberta, Canada | 2 | 71.817 May | 14× |
| Fort SaskatchewanAlberta, Canada | 2 | 82.317 May | 14× |
| EdmontonAlberta, Canada | 2 | 91.017 May | 13× |
| WatertownSouth Dakota, United States | 1 | 82.818 May | 13× |
| VernonBritish Columbia, Canada | 2 | 60.718 May | 12× |
| GilletteWyoming, United States | 1 | 55.118 May | 11× |
| Fort McMurrayAlberta, Canada | 1 | 52.816 May | 11× |
| HelenaMontana, United States | 2 | 72.518 May | 10× |
| Helena Valley West CentralMontana, United States | 2 | 72.518 May | 10× |
| KelownaBritish Columbia, Canada | 2 | 52.118 May | 10× |
| Sherwood ParkAlberta, Canada | 2 | 50.817 May | 10× |
| ShakopeeMinnesota, United States | 1 | 59.018 May | 9.8× |
| Grand IslandNebraska, United States | 1 | 49.218 May | 9.8× |
| Saint CloudMinnesota, United States | 1 | 48.418 May | 9.7× |
| SmithersBritish Columbia, Canada | 1 | 48.318 May | 9.7× |
| HavreMontana, United States | 1 | 47.517 May | 9.5× |
| Apple ValleyMinnesota, United States | 1 | 49.918 May | 9.4× |
| Medicine HatAlberta, Canada | 1 | 46.817 May | 9.4× |
| BrookingsSouth Dakota, United States | 1 | 63.818 May | 9.1× |
| BurnsvilleMinnesota, United States | 1 | 50.118 May | 8.9× |
| ButteMontana, United States | 1 | 42.118 May | 8.4× |
| Saint MichaelMinnesota, United States | 1 | 40.718 May | 8.1× |
| BlairNebraska, United States | 1 | 40.218 May | 8.0× |
| SheridanWyoming, United States | 1 | 38.818 May | 7.8× |
| BrainerdMinnesota, United States | 1 | 37.918 May | 7.6× |
| RivertonWyoming, United States | 1 | 37.318 May | 7.5× |
| MinneapolisMinnesota, United States | 1 | 38.518 May | 6.9× |
| BozemanMontana, United States | 2 | 34.518 May | 6.9× |
| LewistownMontana, United States | 2 | 34.518 May | 6.9× |
| CodyWyoming, United States | 1 | 34.218 May | 6.8× |
| BillingsMontana, United States | 2 | 33.618 May | 6.7× |
| LockwoodMontana, United States | 2 | 33.618 May | 6.7× |
| CasperWyoming, United States | 1 | 32.718 May | 6.5× |
| PentictonBritish Columbia, Canada | 2 | 29.517 May | 5.9× |
| LincolnNebraska, United States | 1 | 29.318 May | 5.9× |
| MissoulaMontana, United States | 1 | 29.218 May | 5.8× |
| VirginiaMinnesota, United States | 1 | 29.018 May | 5.8× |
| CheyenneWyoming, United States | 1 | 29.018 May | 5.8× |
| RanchettesWyoming, United States | 1 | 29.018 May | 5.8× |
| Saint PaulMinnesota, United States | 1 | 32.818 May | 5.6× |
| OmahaNebraska, United States | 1 | 31.218 May | 5.5× |
| Grand CentreAlberta, Canada | 1 | 27.216 May | 5.4× |
| Great FallsMontana, United States | 2 | 41.216 May | 5.2× |
| MadisonWisconsin, United States | 1 | 25.519 May | 5.1× |
| CloquetMinnesota, United States | 1 | 25.318 May | 5.1× |
| BlaineMinnesota, United States | 1 | 25.218 May | 5.0× |
| JerseyvilleIllinois, United States | 1 | 25.119 May | 5.0× |
| BarabooWisconsin, United States | 1 | 25.119 May | 5.0× |
| NorthbrookIllinois, United States | 1 | 27.619 May | 4.9× |
| RochesterMinnesota, United States | 1 | 28.018 May | 4.6× |
| Iowa CityIowa, United States | 1 | 26.719 May | 4.6× |
| Des PlainesIllinois, United States | 1 | 26.219 May | 4.5× |
| CaryIllinois, United States | 1 | 25.719 May | 4.4× |
| WaukeshaWisconsin, United States | 1 | 25.019 May | 4.2× |
| RexburgIdaho, United States | 1 | 25.818 May | 4.1× |
| MilwaukeeWisconsin, United States | 1 | 25.319 May | 3.9× |
Daily means in µg/m³, over the days each city counted in this episode. Highest: its highest of those days. Usual: the city's median for the time of year of that day (its days within 21 days of the date, every year, leaving out the week around it). Above usual: its highest day against that, with a usual under 5 µg/m³ taken as 5.
Against other episodes in the United States and Canada
Number 18 of 173 episodes in the United States and Canada since our records began, by cities reached.
- Eastern United States and Canada, June and July 2023343
- Northern United States and Canada, July 2026327
- United States and Canada, July 2023322
- Eastern United States and Canada, May and June 2023317
- North-eastern United States and Canada, 29 July to 9 August 2025292
- Northern United States and Canada, May and June 2025247
- United States and Canada, June 2023195
- North-western United States and Canada, August 2023176
- North-western United States and Canada, 4 to 22 August 2026151
- Northern United States and Canada, July 2025139
- Northern United States and Canada, June 2025134
- North-western United States and Canada, July and August 2026118
- Northern United States and Canada, May 202383
Bars: cities reached; colour: the level of the episode's highest daily reading. All 173.
Use this page
SmogRank, Northern United States and Canada, May 2023: 83 cities with PM2.5 at twice their usual or more, 15 to 19 May 2023, smogrank.com/episodes/2023-05-northern-united-states-and-canada (accessed 5 October 2026).
You're welcome to reuse a single chart, image or figure with this citation and a link. Terms.
An episode is a run of days when many cities close to each other (four or more within 350 km on a day, 8 or more in all) each had a daily PM2.5 mean of at least 25 µg/m³ and at least 2 times their usual for that time of year. Found in our own measurements, not picked by hand. How we find episodes. Values are each city's daily mean of its own monitors; causes are the usual kinds for a pattern like this, not a confirmed source. Fire detections from NASA FIRMS; smoke maps from NOAA HMS.