SmogRank / Episodes / United States
North-eastern United States, 19 July 2023
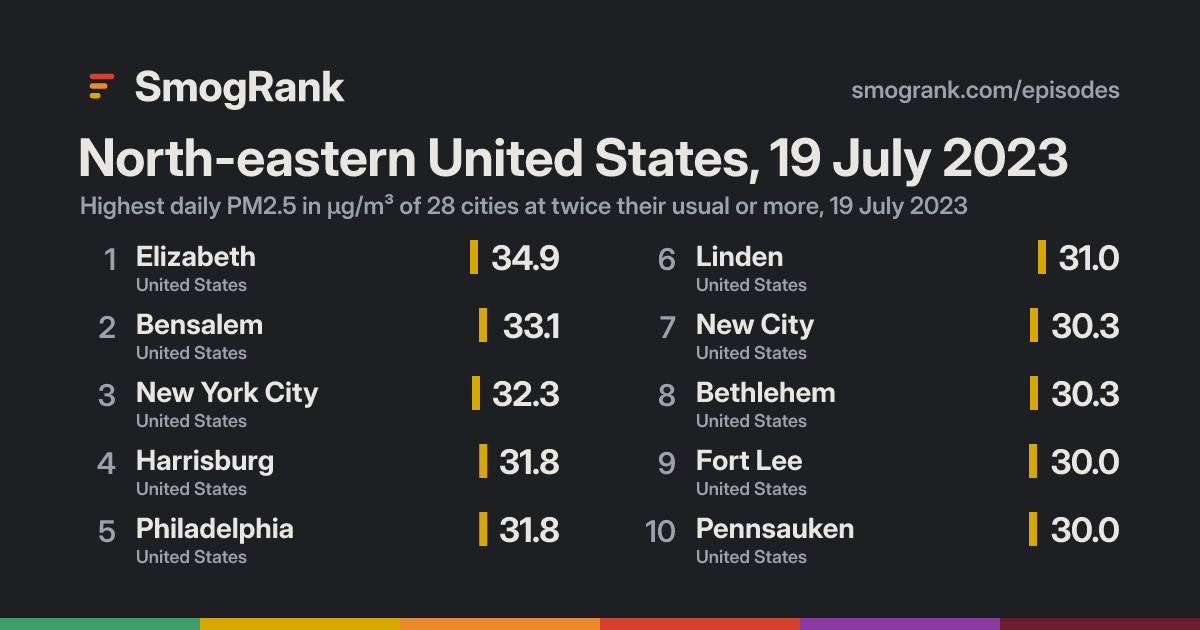
For 1 day, on 19 July 2023, 28 cities in the United States had PM2.5 at least twice their usual for the time of year. The worst reading was Elizabeth, New Jersey, United States: 34.9 µg/m³ on 19 July, about 3.4× its usual 10.2.
No cause named We have no fire or smoke records for these days, so we only say what the measurements show.
Cities reached 28 in 1 country
Days 1 19 July 2023
Worst day 19 July 28 cities counted
Furthest above usual 5.1× New City
Day by day
Play 19 July 28 cities at twice their usual or more
Chester Bayonne Wilmington Newark Bear South Vineland Elkton Pleasantville Dover Edgewood York Danbury Hunt Valley Baltimore Waterbury New Haven Albany Scaggsville Utica South Laurel Syracuse Pittsfield Rockville Washington Hartford State College Rose Hill Hagerstown Springfield Springfield North Chicopee New London Greenfield Altoona Rochester Coventry Keene Worcester Johnstown Providence Pawtucket Fall River Cheektowaga Lowell Lexington Buffalo Brockton Kenmore Derry Boston Quincy Lynn Haverhill McKeesport West Mifflin Wilkinsburg St. Catharines Pittsburgh Portsmouth Erie Hermitage Brantford Scranton Ewing Lancaster Pennsauken Bridgeport Jersey City Philadelphia Lebanon Trenton Linden New Brunswick Toms River Harrisburg New York City Elizabeth Paterson Holbrook Carlisle Reading Bensalem Hempstead Fort Lee Norristown Allentown White Plains Bethlehem Newburgh New City 16 Jul 17 18 19 20 21 22 Every measured city in the area, coloured by its PM2.5 that day; a dark ring marks a city at twice its usual or more. Bars: cities counted each day, coloured by their median level. Choose a day or press play; without JavaScript, the days link to that day's world ranking.
How it spread
Elizabeth Elizabeth, 16 July: 9.3 µg/m³ Elizabeth, 17 July: 22.5 µg/m³ Elizabeth, 18 July: 24.0 µg/m³ Elizabeth, 19 July: 34.9 µg/m³, 3.4× its usual 10.2 Elizabeth, 20 July: 25.8 µg/m³ Elizabeth, 21 July: 14.5 µg/m³ Elizabeth, 22 July: 7.0 µg/m³ Bensalem Bensalem, 16 July: 7.2 µg/m³ Bensalem, 17 July: 26.4 µg/m³ Bensalem, 18 July: 26.1 µg/m³ Bensalem, 19 July: 33.1 µg/m³, 3.7× its usual 9.0 Bensalem, 20 July: 26.7 µg/m³ Bensalem, 21 July: 11.4 µg/m³ Bensalem, 22 July: 9.9 µg/m³ New York City New York City, 16 July: 6.2 µg/m³ New York City, 17 July: 16.3 µg/m³ New York City, 18 July: 18.0 µg/m³ New York City, 19 July: 32.3 µg/m³, 3.4× its usual 9.4 New York City, 20 July: 20.1 µg/m³ New York City, 21 July: 11.2 µg/m³ New York City, 22 July: 5.7 µg/m³ Harrisburg Harrisburg, 16 July: 7.4 µg/m³ Harrisburg, 17 July: 31.4 µg/m³ Harrisburg, 18 July: 29.4 µg/m³ Harrisburg, 19 July: 31.8 µg/m³, 3.4× its usual 9.4 Harrisburg, 20 July: 20.6 µg/m³ Harrisburg, 21 July: 6.2 µg/m³ Harrisburg, 22 July: 8.7 µg/m³ Philadelphia Philadelphia, 16 July: 4.5 µg/m³ Philadelphia, 17 July: 24.5 µg/m³ Philadelphia, 18 July: 26.8 µg/m³ Philadelphia, 19 July: 31.8 µg/m³, 3.1× its usual 10.3 Philadelphia, 20 July: 23.1 µg/m³ Philadelphia, 21 July: 10.1 µg/m³ Philadelphia, 22 July: 9.1 µg/m³ Linden Linden, 16 July: 5.7 µg/m³ Linden, 17 July: 22.2 µg/m³ Linden, 18 July: 20.8 µg/m³ Linden, 19 July: 31.0 µg/m³, 3.2× its usual 9.6 Linden, 20 July: 20.8 µg/m³ Linden, 21 July: 10.2 µg/m³ Linden, 22 July: 6.5 µg/m³ New City New City, 16 July: 2.4 µg/m³ New City, 17 July: 31.4 µg/m³ New City, 18 July: 25.8 µg/m³ New City, 19 July: 30.3 µg/m³, 5.1× its usual 5.9 New City, 20 July: 11.3 µg/m³ New City, 21 July: 8.1 µg/m³ New City, 22 July: 2.4 µg/m³ Bethlehem Bethlehem, 16 July: 4.5 µg/m³ Bethlehem, 17 July: 33.5 µg/m³ Bethlehem, 18 July: 26.0 µg/m³ Bethlehem, 19 July: 30.3 µg/m³, 4.3× its usual 7.0 Bethlehem, 20 July: 22.6 µg/m³ Bethlehem, 21 July: 7.1 µg/m³ Bethlehem, 22 July: 7.2 µg/m³ Fort Lee Fort Lee, 16 July: 3.1 µg/m³ Fort Lee, 17 July: 17.7 µg/m³ Fort Lee, 18 July: 17.0 µg/m³ Fort Lee, 19 July: 30.0 µg/m³, 3.8× its usual 8.0 Fort Lee, 20 July: 15.4 µg/m³ Fort Lee, 21 July: 8.7 µg/m³ Fort Lee, 22 July: 3.2 µg/m³ Pennsauken Pennsauken, 16 July: 4.9 µg/m³ Pennsauken, 17 July: 23.9 µg/m³ Pennsauken, 18 July: 24.5 µg/m³ Pennsauken, 19 July: 30.0 µg/m³, 3.0× its usual 10.0 Pennsauken, 20 July: 22.6 µg/m³ Pennsauken, 21 July: 9.1 µg/m³ Pennsauken, 22 July: 7.8 µg/m³ Allentown Allentown, 16 July: 4.2 µg/m³ Allentown, 17 July: 31.7 µg/m³ Allentown, 18 July: 24.1 µg/m³ Allentown, 19 July: 29.7 µg/m³, 3.9× its usual 7.6 Allentown, 20 July: 22.0 µg/m³ Allentown, 21 July: 6.7 µg/m³ Allentown, 22 July: 6.3 µg/m³ Norristown Norristown, 16 July: 4.0 µg/m³ Norristown, 17 July: 26.0 µg/m³ Norristown, 18 July: 28.7 µg/m³ Norristown, 19 July: 29.6 µg/m³, 3.9× its usual 7.5 Norristown, 20 July: 21.1 µg/m³ Norristown, 21 July: 7.4 µg/m³ Norristown, 22 July: 6.9 µg/m³ Paterson Paterson, 16 July: 6.8 µg/m³ Paterson, 17 July: 23.3 µg/m³ Paterson, 18 July: 26.9 µg/m³ Paterson, 19 July: 29.6 µg/m³, 3.5× its usual 8.5 Paterson, 20 July: 17.9 µg/m³ Paterson, 21 July: 9.6 µg/m³ Paterson, 22 July: 4.9 µg/m³ Jersey City Jersey City, 16 July: 6.9 µg/m³ Jersey City, 17 July: 16.4 µg/m³ Jersey City, 18 July: 19.5 µg/m³ Jersey City, 19 July: 29.5 µg/m³, 3.1× its usual 9.5 Jersey City, 20 July: 21.2 µg/m³ Jersey City, 21 July: 10.6 µg/m³ Jersey City, 22 July: 5.1 µg/m³ Trenton Trenton, 16 July: 5.4 µg/m³ Trenton, 17 July: 22.1 µg/m³ Trenton, 18 July: 24.3 µg/m³ Trenton, 19 July: 29.1 µg/m³, 3.2× its usual 9.2 Trenton, 20 July: 25.1 µg/m³ Trenton, 21 July: 11.6 µg/m³ Trenton, 22 July: 7.8 µg/m³ Lebanon Lebanon, 16 July: 5.4 µg/m³ Lebanon, 17 July: 29.8 µg/m³ Lebanon, 18 July: 26.2 µg/m³ Lebanon, 19 July: 29.0 µg/m³, 3.2× its usual 9.0 Lebanon, 20 July: 19.7 µg/m³ Lebanon, 21 July: 5.8 µg/m³ Lebanon, 22 July: 7.5 µg/m³ Toms River Toms River, 16 July: 5.9 µg/m³ Toms River, 17 July: 13.4 µg/m³ Toms River, 18 July: 14.3 µg/m³ Toms River, 19 July: 28.6 µg/m³, 3.4× its usual 8.5 Toms River, 20 July: 23.0 µg/m³ Toms River, 21 July: 10.8 µg/m³ Toms River, 22 July: 5.8 µg/m³ Reading Reading, 16 July: 4.0 µg/m³ Reading, 17 July: 28.5 µg/m³ Reading, 18 July: 23.4 µg/m³ Reading, 19 July: 28.4 µg/m³, 3.7× its usual 7.6 Reading, 20 July: 20.6 µg/m³ Reading, 21 July: 5.6 µg/m³ Reading, 22 July: 6.8 µg/m³ Hempstead Hempstead, 16 July: 3.1 µg/m³ Hempstead, 17 July: 10.1 µg/m³ Hempstead, 18 July: 12.0 µg/m³ Hempstead, 19 July: 28.2 µg/m³, 3.8× its usual 7.5 Hempstead, 20 July: 15.0 µg/m³ Hempstead, 21 July: 10.5 µg/m³ Hempstead, 22 July: 4.7 µg/m³ New Brunswick New Brunswick, 16 July: no reading New Brunswick, 17 July: no reading New Brunswick, 18 July: 24.3 µg/m³ New Brunswick, 19 July: 27.9 µg/m³, 3.3× its usual 8.5 New Brunswick, 20 July: 20.9 µg/m³ New Brunswick, 21 July: 11.1 µg/m³ New Brunswick, 22 July: 6.9 µg/m³ Bridgeport Bridgeport, 16 July: 9.4 µg/m³ Bridgeport, 17 July: 11.9 µg/m³ Bridgeport, 18 July: 19.2 µg/m³ Bridgeport, 19 July: 27.7 µg/m³, 3.1× its usual 8.9 Bridgeport, 20 July: 16.7 µg/m³ Bridgeport, 21 July: 19.0 µg/m³ Bridgeport, 22 July: 8.3 µg/m³ Carlisle Carlisle, 16 July: 6.6 µg/m³ Carlisle, 17 July: 28.1 µg/m³ Carlisle, 18 July: 27.0 µg/m³ Carlisle, 19 July: 27.6 µg/m³, 3.6× its usual 7.7 Carlisle, 20 July: 19.0 µg/m³ Carlisle, 21 July: 5.2 µg/m³ Carlisle, 22 July: 7.9 µg/m³ Newburgh Newburgh, 16 July: 2.7 µg/m³ Newburgh, 17 July: 29.3 µg/m³ Newburgh, 18 July: 26.1 µg/m³ Newburgh, 19 July: 26.7 µg/m³, 4.5× its usual 5.9 Newburgh, 20 July: 9.6 µg/m³ Newburgh, 21 July: 6.8 µg/m³ Newburgh, 22 July: 4.1 µg/m³ Ewing Ewing, 16 July: 3.4 µg/m³ Ewing, 17 July: 23.7 µg/m³ Ewing, 18 July: 23.4 µg/m³ Ewing, 19 July: 26.5 µg/m³, 2.8× its usual 9.4 Ewing, 20 July: 21.6 µg/m³ Ewing, 21 July: 11.1 µg/m³ Ewing, 22 July: 6.4 µg/m³ Holbrook Holbrook, 16 July: 3.5 µg/m³ Holbrook, 17 July: 9.2 µg/m³ Holbrook, 18 July: 13.0 µg/m³ Holbrook, 19 July: 25.9 µg/m³, 3.6× its usual 7.2 Holbrook, 20 July: 14.1 µg/m³ Holbrook, 21 July: 11.2 µg/m³ Holbrook, 22 July: 3.9 µg/m³ White Plains White Plains, 16 July: 8.3 µg/m³ White Plains, 17 July: 19.0 µg/m³ White Plains, 18 July: 14.9 µg/m³ White Plains, 19 July: 25.3 µg/m³, 4.3× its usual 5.9 White Plains, 20 July: 12.1 µg/m³ White Plains, 21 July: 10.7 µg/m³ White Plains, 22 July: 2.9 µg/m³ Scranton Scranton, 16 July: 6.1 µg/m³ Scranton, 17 July: 28.4 µg/m³ Scranton, 18 July: 27.4 µg/m³ Scranton, 19 July: 25.3 µg/m³, 2.8× its usual 9.0 Scranton, 20 July: 17.4 µg/m³ Scranton, 21 July: 6.5 µg/m³ Scranton, 22 July: 7.9 µg/m³ Lancaster Lancaster, 16 July: 6.0 µg/m³ Lancaster, 17 July: 36.9 µg/m³ Lancaster, 18 July: 26.4 µg/m³ Lancaster, 19 July: 25.2 µg/m³, 2.9× its usual 8.8 Lancaster, 20 July: 21.1 µg/m³ Lancaster, 21 July: 7.9 µg/m³ Lancaster, 22 July: 11.0 µg/m³ 16 Jul 17 18 19 20 21 22 Every counted city, in the order the episode reached them, 3 days before to 3 after. Each square is a day, coloured by that day's PM2.5; outlined: at twice the city's usual or more. Good 0–50
Moderate 51–100
Sensitive groups 101–150
Unhealthy 151–200
Very unhealthy 201–300
Hazardous 301+
Every city it reached
City Days Highest Usual Above usual
New City New York, United States 1 19 July 5.9 5.1× Newburgh New York, United States 1 19 July 5.9 4.5× Bethlehem Pennsylvania, United States 1 19 July 7.0 4.3× White Plains New York, United States 1 19 July 5.9 4.3× Allentown Pennsylvania, United States 1 19 July 7.6 3.9× Norristown Pennsylvania, United States 1 19 July 7.5 3.9× Fort Lee New Jersey, United States 1 19 July 8.0 3.8× Hempstead New York, United States 1 19 July 7.5 3.8× Bensalem Pennsylvania, United States 1 19 July 9.0 3.7× Reading Pennsylvania, United States 1 19 July 7.6 3.7× Carlisle Pennsylvania, United States 1 19 July 7.7 3.6× Holbrook New York, United States 1 19 July 7.2 3.6× Paterson New Jersey, United States 1 19 July 8.5 3.5× Elizabeth New Jersey, United States 1 19 July 10.2 3.4× New York City New York, United States 1 19 July 9.4 3.4× Harrisburg Pennsylvania, United States 1 19 July 9.4 3.4× Toms River New Jersey, United States 1 19 July 8.5 3.4× New Brunswick New Jersey, United States 1 19 July 8.5 3.3× Linden New Jersey, United States 1 19 July 9.6 3.2× Trenton New Jersey, United States 1 19 July 9.2 3.2× Lebanon Pennsylvania, United States 1 19 July 9.0 3.2× Philadelphia Pennsylvania, United States 1 19 July 10.3 3.1× Jersey City New Jersey, United States 1 19 July 9.5 3.1× Bridgeport Connecticut, United States 1 19 July 8.9 3.1× Pennsauken New Jersey, United States 1 19 July 10.0 3.0× Lancaster Pennsylvania, United States 1 19 July 8.8 2.9× Ewing New Jersey, United States 1 19 July 9.4 2.8× Scranton Pennsylvania, United States 1 19 July 9.0 2.8×
Daily means in µg/m³, over the days each city counted in this episode. Highest: its highest of those days. Usual: the city's median for the time of year of that day (its days within 21 days of the date, every year, leaving out the week around it). Above usual: its highest day against that, with a usual under 5 µg/m³ taken as 5.
Against other episodes in the United States
Number 37 of 130 episodes in the United States since our records began, by cities reached.
Eastern United States and Canada, 25 June to 2 July 2023 280 North-eastern United States and Canada, July 2026 264 Eastern United States and Canada, May and June 2023 261 North-eastern United States and Canada, 30 July to 9 August 2025 241 Eastern United States and Canada, July 2023 240 North-eastern United States and Canada, 3 to 9 June 2025 196 Eastern United States and Canada, 14 to 19 June 2023 161 North-eastern United States and Canada, 12 to 16 July 2025 119 North-western United States and Canada, August 2023 110 North-eastern United States and Canada, 10 to 14 June 2025 104 North-western United States and Canada, 4 to 11 August 2026 99 North-eastern United States and Canada, 14 to 19 February 2026 96 North-eastern United States, 19 July 2023 28 Bars: cities reached; colour: the level of the episode's highest daily reading. All 130 .
Use this page SmogRank, North-eastern United States, 19 July 2023: 28 cities with PM2.5 at twice their usual or more, 19 July 2023, smogrank.com/episodes/2023-07-19-north-eastern-united-states (accessed 4 October 2026).
Copy citation Download top 10 (PNG)
You're welcome to reuse a single chart, image or figure with this citation and a link. Terms .
An episode is a run of days when many cities close to each other (four or more within 350 km on a day, 8 or more in all) each had a daily PM2.5 mean of at least 25 µg/m³ and at least 2 times their usual for that time of year. Found in our own measurements, not picked by hand. How we find episodes . Values are each city's daily mean of its own monitors; causes are the usual kinds for a pattern like this, not a confirmed source.