SmogRank / Episodes / United States
South-eastern United States, October 2023
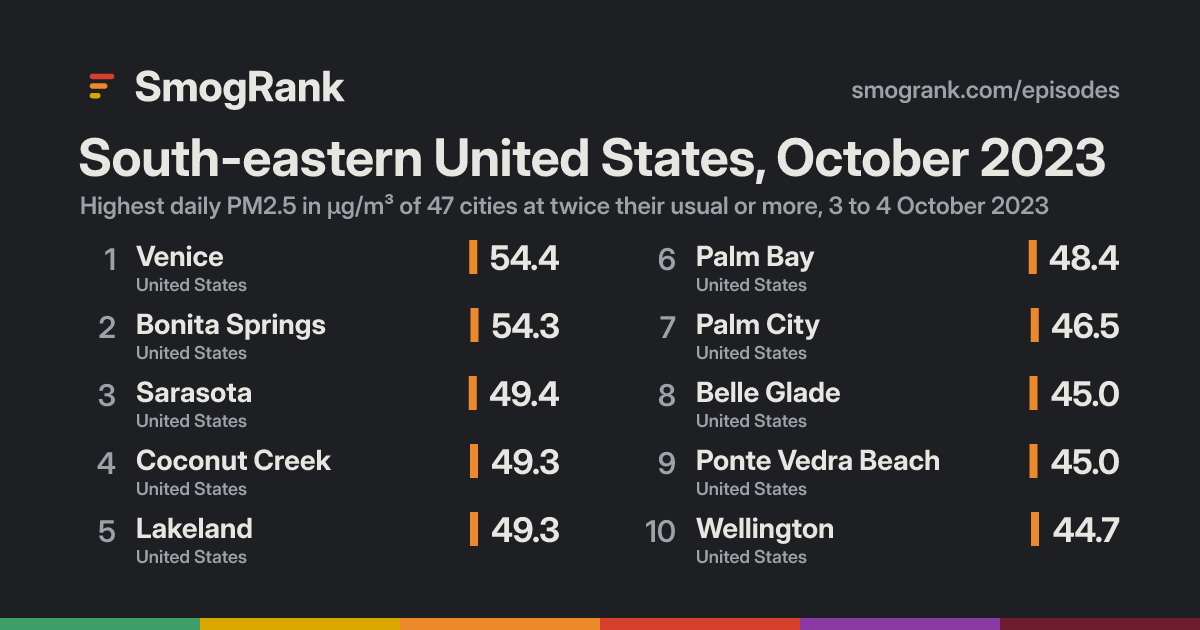
For 2 days, from 3 to 4 October 2023, 47 cities in the United States had PM2.5 at least twice their usual for the time of year. The worst reading was Venice, Florida, United States: 54.4 µg/m³ on 3 October, about 8.1× its usual 6.7.
Day by day
How it spread
Every city it reached
| City | Days | Highest | Above usual |
|---|---|---|---|
| SarasotaFlorida, United States | 1 | 49.43 October | 9.9× |
| Coconut CreekFlorida, United States | 1 | 49.33 October | 9.9× |
| Palm BayFlorida, United States | 1 | 48.43 October | 9.7× |
| Palm CityFlorida, United States | 1 | 46.53 October | 9.3× |
| Belle GladeFlorida, United States | 1 | 45.03 October | 9.0× |
| WellingtonFlorida, United States | 1 | 44.73 October | 8.9× |
| Bonita SpringsFlorida, United States | 1 | 54.33 October | 8.9× |
| LakelandFlorida, United States | 1 | 49.33 October | 8.4× |
| Delray BeachFlorida, United States | 1 | 41.33 October | 8.3× |
| VeniceFlorida, United States | 1 | 54.43 October | 8.1× |
| Deerfield BeachFlorida, United States | 1 | 39.93 October | 8.0× |
| Daytona BeachFlorida, United States | 1 | 43.03 October | 7.8× |
| Lake MaryFlorida, United States | 1 | 38.83 October | 7.8× |
| WestonFlorida, United States | 1 | 38.43 October | 7.7× |
| Fort LauderdaleFlorida, United States | 1 | 39.33 October | 7.6× |
| DavieFlorida, United States | 1 | 37.53 October | 7.5× |
| Safety HarborFlorida, United States | 1 | 35.83 October | 7.2× |
| Winter ParkFlorida, United States | 1 | 35.33 October | 7.1× |
| East LakeFlorida, United States | 1 | 34.93 October | 6.7× |
| TampaFlorida, United States | 1 | 39.23 October | 6.6× |
| ValricoFlorida, United States | 1 | 36.03 October | 6.2× |
| Ponte Vedra BeachFlorida, United States | 1 | 45.03 October | 6.1× |
| Fruit CoveFlorida, United States | 1 | 35.03 October | 5.8× |
| GainesvilleFlorida, United States | 1 | 29.93 October | 5.4× |
| JacksonvilleFlorida, United States | 1 | 33.63 October | 5.3× |
| TallahasseeFlorida, United States | 1 | 43.53 October | 5.1× |
| OcalaFlorida, United States | 1 | 35.13 October | 4.8× |
| ValdostaGeorgia, United States | 1 | 39.43 October | 4.6× |
| AlbanyGeorgia, United States | 1 | 32.43 October | 4.3× |
| Ferry PassFlorida, United States | 2 | 32.84 October | 4.2× |
| PascagoulaMississippi, United States | 1 | 32.04 October | 4.1× |
| HernandoMississippi, United States | 1 | 39.75 October | 4.0× |
| MidwayFlorida, United States | 2 | 32.64 October | 4.0× |
| FairhopeAlabama, United States | 1 | 28.24 October | 3.9× |
| GulfportMississippi, United States | 1 | 31.34 October | 3.7× |
| New OrleansLouisiana, United States | 1 | 29.44 October | 3.7× |
| SavannahGeorgia, United States | 1 | 26.33 October | 3.4× |
| Baton RougeLouisiana, United States | 1 | 31.44 October | 3.2× |
| BartlettTennessee, United States | 1 | 32.64 October | 3.2× |
| SulphurLouisiana, United States | 1 | 25.74 October | 3.1× |
| HattiesburgMississippi, United States | 1 | 31.84 October | 3.1× |
| JacksonMississippi, United States | 1 | 26.84 October | 3.0× |
| LafayetteLouisiana, United States | 1 | 26.54 October | 2.7× |
| MaconGeorgia, United States | 1 | 25.23 October | 2.7× |
| West MemphisArkansas, United States | 1 | 26.54 October | 2.5× |
| Little RockArkansas, United States | 1 | 27.44 October | 2.4× |
| BirminghamAlabama, United States | 1 | 27.64 October | 2.3× |
Daily means in µg/m³. Usual: the city's median for this time of year (its days within 21 days of the date, every year, leaving out the week around it). Above usual: its highest day against that.
Against other episodes in the United States
Number 8 of 41 episodes in the United States since our records began, by cities reached.
- North-eastern United States and Canada, June and July 2023279
- North-eastern United States and Canada, May and June 2023260
- North-eastern United States and Canada, July 2023241
- North-eastern United States and Canada, June 2023161
- North-western United States and Canada, August 2023110
- North-eastern United States and Canada, July 202375
- Western United States, September 202361
- South-eastern United States, October 202347
- North-eastern United States, July 202346
- North-western United States and Canada, May 202342
- Western United States, December 202332
- Northern United States, January 202332
Bars: cities reached; colour: the level of the episode's highest daily reading. All 41.
Use this page
SmogRank, South-eastern United States, October 2023: 47 cities with PM2.5 at twice their usual or more, 3 to 4 October 2023, smogrank.com/episodes/2023-10-south-eastern-united-states (accessed 2 October 2026).
You're welcome to reuse a single chart, image or figure with this citation and a link. Terms.
An episode is a run of days when many cities close to each other (four or more within 350 km on a day, 8 or more in all) each had a daily PM2.5 mean of at least 25 µg/m³ and at least 2 times their usual for that time of year. Found in our own measurements, not picked by hand. How we find episodes. Values are each city's daily mean of its own monitors; causes are the usual kinds for a pattern like this, not a confirmed source.