Europe, January 2024
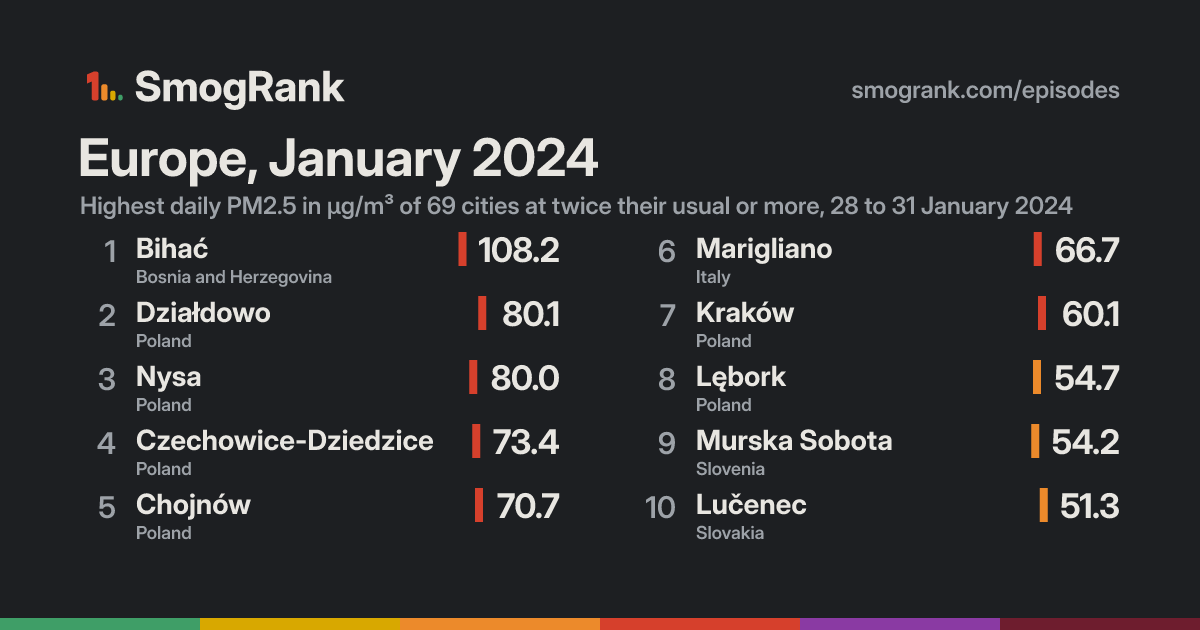
For 4 days, from 28 to 31 January 2024, 69 cities in Poland, France, Germany and 8 more countries had PM2.5 at least twice their usual for the time of year. The worst reading was Bihać, Federation of B&H, Bosnia and Herzegovina: 108.2 µg/m³ on 30 January, about 3.6× its usual 30.4. Ended 31 January.
Day by day
On the map: 216 fire detections.
- Fires, seenHeat satellites detected that day (via NASA FIRMS); bigger and glowing means more detections in the area. Farm burning and other fires count too, not only wildfires.
Under the cities, for each UTC day: fires satellites detected (via NASA FIRMS), smoke NOAA analysts traced and volcanic ash warnings for aircraft. They show what was in the air, not that it caused the readings.
Fires: NASA FIRMS (VIIRS). Traced smoke: NOAA Hazard Mapping System. Volcanic ash: aviation ash warnings (SIGMETs) via NOAA's Aviation Weather Center.
How it spread
Every city it reached
| City | Days | Highest | Above usual |
|---|---|---|---|
| BihaćFederation of B&H, Bosnia and Herzegovina | 2 | 108.230 January | 3.6× |
| NysaOpole Voivodeship, Poland | 2 | 80.029 January | 3.6× |
| ChojnówLower Silesia, Poland | 2 | 70.729 January | 3.4× |
| OlivetCentre-Val de Loire, France | 1 | 26.428 January | 3.1× |
| Czechowice-DziedziceSilesia, Poland | 2 | 73.429 January | 2.9× |
| KościerzynaPomerania, Poland | 1 | 47.330 January | 2.9× |
| DoleBourgogne-Franche-Comté, France | 1 | 29.130 January | 2.9× |
| LęborkPomerania, Poland | 1 | 54.730 January | 2.8× |
| KladnoCentral Bohemia, Czechia | 2 | 38.329 January | 2.8× |
| LivnoFederation of B&H, Bosnia and Herzegovina | 1 | 38.230 January | 2.8× |
| VilniusVilnius, Lithuania | 1 | 32.131 January | 2.8× |
| ThionvilleGrand Est, France | 1 | 29.329 January | 2.8× |
| Liptovský Mikulᚎilina Region, Slovakia | 1 | 41.330 January | 2.7× |
| MainzRheinland-Pfalz, Germany | 2 | 35.430 January | 2.7× |
| AvignonProvence-Alpes-Côte d'Azur, France | 1 | 34.030 January | 2.6× |
| PassauBavaria, Germany | 1 | 33.630 January | 2.6× |
| BeauvaisHauts-de-France, France | 2 | 30.629 January | 2.6× |
| WürzburgBavaria, Germany | 1 | 27.430 January | 2.6× |
| ToursCentre-Val de Loire, France | 1 | 25.029 January | 2.6× |
| LiepājaLiepaja, Latvia | 1 | 38.730 January | 2.5× |
| SopotPomerania, Poland | 1 | 35.330 January | 2.5× |
| Bad KreuznachRheinland-Pfalz, Germany | 1 | 34.630 January | 2.5× |
| FréjusProvence-Alpes-Côte d'Azur, France | 1 | 28.430 January | 2.5× |
| Naujoji AkmeneSiauliai, Lithuania | 1 | 26.230 January | 2.5× |
| BytówPomerania, Poland | 1 | 25.630 January | 2.5× |
| Gorzów WielkopolskiLubusz, Poland | 1 | 48.430 January | 2.4× |
| GdyniaPomerania, Poland | 1 | 40.530 January | 2.4× |
| IngolstadtBavaria, Germany | 1 | 32.730 January | 2.4× |
| AnnecyAuvergne-Rhône-Alpes, France | 1 | 30.730 January | 2.4× |
| KlaipėdaKlaipėda County, Lithuania | 1 | 28.630 January | 2.4× |
| MelunÎle-de-France, France | 1 | 28.428 January | 2.4× |
| RigaRiga, Latvia | 1 | 26.930 January | 2.4× |
| VentspilsVentspils, Latvia | 1 | 26.430 January | 2.4× |
| DziałdowoWarmia-Masuria, Poland | 1 | 80.130 January | 2.3× |
| MariglianoCampania, Italy | 1 | 66.730 January | 2.3× |
| KrakówLesser Poland, Poland | 1 | 60.130 January | 2.3× |
| LjubljanaLjubljana, Slovenia | 2 | 48.330 January | 2.3× |
| BraPiedmont, Italy | 2 | 44.930 January | 2.3× |
| PesaroThe Marches, Italy | 1 | 40.230 January | 2.3× |
| AugustówPodlasie, Poland | 2 | 44.931 January | 2.2× |
| ElblągWarmia-Masuria, Poland | 1 | 34.930 January | 2.2× |
| PraguePrague, Czechia | 1 | 34.229 January | 2.2× |
| RokycanyPlzeň Region, Czechia | 1 | 33.530 January | 2.2× |
| Attnang-PuchheimUpper Austria, Austria | 1 | 32.330 January | 2.2× |
| KaunasKaunas, Lithuania | 2 | 31.431 January | 2.2× |
| GrenobleAuvergne-Rhône-Alpes, France | 1 | 30.230 January | 2.2× |
| HaguenauGrand Est, France | 1 | 28.829 January | 2.2× |
| Rüsselsheim am MainHesse, Germany | 1 | 25.730 January | 2.2× |
| Murska SobotaUrban Municipality of Murska Sobota, Slovenia | 1 | 54.230 January | 2.1× |
| RužomberokŽilina Region, Slovakia | 1 | 45.830 January | 2.1× |
| BresciaLombardy, Italy | 2 | 44.030 January | 2.1× |
| MartinŽilina Region, Slovakia | 1 | 38.330 January | 2.1× |
| WormsRheinland-Pfalz, Germany | 1 | 33.329 January | 2.1× |
| GdańskPomerania, Poland | 1 | 33.330 January | 2.1× |
| AnconaThe Marches, Italy | 1 | 28.530 January | 2.1× |
| LunévilleGrand Est, France | 2 | 27.028 January | 2.1× |
| BurghausenBavaria, Germany | 1 | 26.330 January | 2.1× |
| AnnemasseAuvergne-Rhône-Alpes, France | 2 | 26.030 January | 2.1× |
| LučenecBanská Bystrica Region, Slovakia | 1 | 51.329 January | 2.0× |
| Nakło nad NoteciąKujawsko-Pomorskie, Poland | 1 | 51.229 January | 2.0× |
| CeljeUrban Municipality of Celje, Slovenia | 1 | 50.530 January | 2.0× |
| KošiceKošice Region, Slovakia | 1 | 46.830 January | 2.0× |
| ComoLombardy, Italy | 1 | 35.530 January | 2.0× |
| LinzUpper Austria, Austria | 1 | 33.730 January | 2.0× |
| Sainte-Geneviève-des-BoisÎle-de-France, France | 1 | 32.229 January | 2.0× |
| GrajewoPodlasie, Poland | 1 | 28.830 January | 2.0× |
| SuwałkiPodlasie, Poland | 1 | 27.731 January | 2.0× |
| WetzlarHesse, Germany | 1 | 27.030 January | 2.0× |
| RēzekneRēzekne, Latvia | 2 | 26.830 January | 2.0× |
Daily means in µg/m³, over the days each city counted in this episode. Highest: its highest of those days. Usual: the city's median for the time of year of that day (its days within 21 days of the date, every year, leaving out the week either side of it). Above usual: its highest day against that, with a usual under 5 µg/m³ taken as 5.
Compared with other episodes in Poland and France
Number 19 of 66 episodes in Poland and France since our records began, by cities reached.
- Europe, February and March 2023354
- Poland, Czechia and 15 more countries, October 2024234
- Europe, December 2025 to January 2026231
- Europe, January 2023162
- Western and southern Europe, January 2024160
- Southern Europe, June 2025151
- Eastern Europe, November and December 2025129
- Eastern Europe, November and December 2023116
- Europe, 5 to 10 November 2025115
- Europe, December 2024108
- Eastern Europe, November and December 2024101
- Germany, Poland and 2 more countries, February 202689
- Europe, January 202469
Bars: cities reached; colour: the level of the episode's highest daily reading. All 66.
Use this page
SmogRank, Europe, January 2024: 69 cities with PM2.5 at twice their usual or more, 28 to 31 January 2024, smogrank.com/episodes/2024-01-europe (accessed 17 November 2026).
You're welcome to reuse a single chart, image or figure with this citation and a link. Terms.
An episode is a run of days when many cities close to each other (four or more within 350 km on a day, 8 or more in all) each had a daily PM2.5 mean of at least 25 µg/m³ and at least 2 times their usual for that time of year. Found in our own measurements, not picked by hand. How we find episodes. Values are each city's daily mean of its own monitors; causes are the usual kinds for a pattern like this, not a confirmed source. Fire detections from NASA FIRMS; smoke maps from NOAA HMS. Dust: contains modified Copernicus Atmosphere Monitoring Service information 2024. Neither the European Commission nor ECMWF is responsible for any use that may be made of the Copernicus information or data it contains.