SmogRank / Episodes / United States

Georgia, Alabama and South Carolina, United States, March 2024

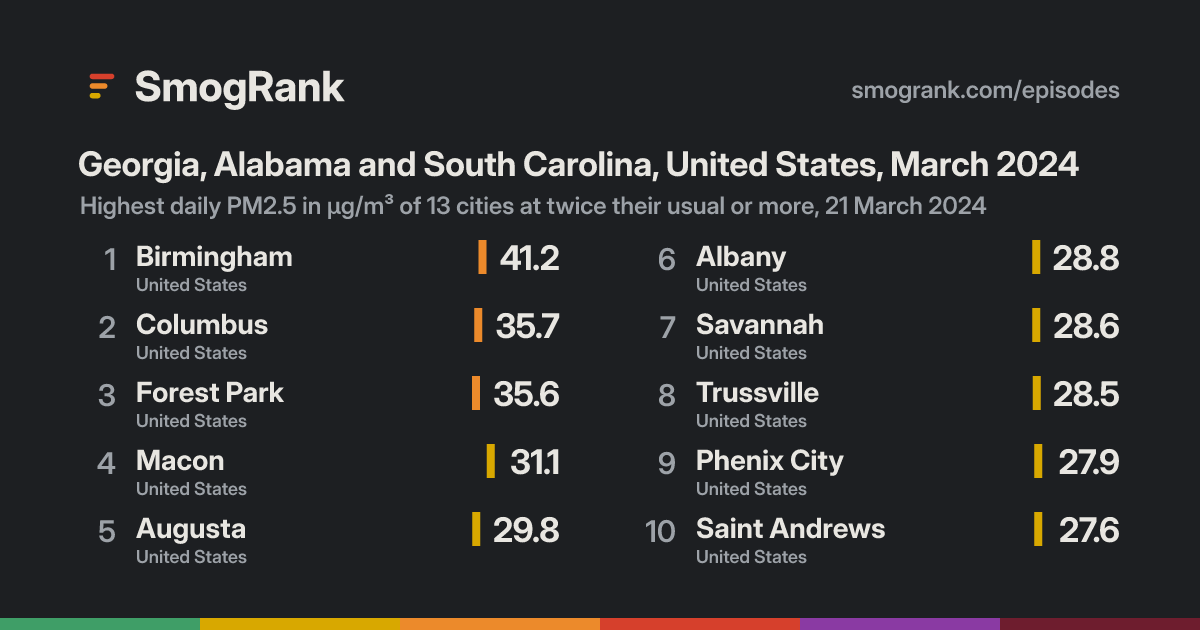
For 1 day, on 21 March 2024, 13 cities in the United States had PM2.5 at least twice their usual for the time of year. The worst reading was Birmingham, Alabama, United States: 41.2 µg/m³ on 21 March, about 3.9× its usual 10.5.

No cause namedWe have no fire or smoke records for these days, so we only say what the measurements show.
Cities reached13in 1 country
Days121 March 2024
Worst day21 March13 cities counted
Furthest above usual5.5×Forest Park

Day by day

21 March 13 cities at twice their usual or more
Warner RobinsMcDonoughCandler-McAfeeAtlantaAthensGainesvilleValdostaMontgomeryGadsdenTallahasseeEast RidgeChattanoogaGreenvilleSpartanburgBrunswickHuntsvilleDecaturMidwayFerry PassCharlotteNorth CharlestonFairhopeFlorencePrichardPascagoulaAlbanyLawrencevillePhenix CityMaconHueytownKennesawAugustaTrussvilleSavannahSaint AndrewsColumbusBirminghamForest Park
18 Mar192021222324
Every measured city in the area, coloured by its PM2.5 that day; a dark ring marks a city at twice its usual or more. Bars: cities counted each day, coloured by their median level. Choose a day or press play; without JavaScript, the days link to that day's world ranking.

How it spread

BirminghamBirmingham, 18 March: 5.1 µg/m³Birmingham, 19 March: 12.3 µg/m³Birmingham, 20 March: no readingBirmingham, 21 March: 41.2 µg/m³, 3.9× its usual 10.5Birmingham, 22 March: 29.6 µg/m³Birmingham, 23 March: 10.8 µg/m³Birmingham, 24 March: 10.4 µg/m³ColumbusColumbus, 18 March: 5.3 µg/m³Columbus, 19 March: 6.1 µg/m³Columbus, 20 March: no readingColumbus, 21 March: 35.7 µg/m³, 3.8× its usual 9.5Columbus, 22 March: 18.3 µg/m³Columbus, 23 March: 8.3 µg/m³Columbus, 24 March: 6.3 µg/m³Forest ParkForest Park, 18 March: 4.5 µg/m³Forest Park, 19 March: 5.9 µg/m³Forest Park, 20 March: no readingForest Park, 21 March: 35.6 µg/m³, 5.5× its usual 6.5Forest Park, 22 March: 21.2 µg/m³Forest Park, 23 March: 9.0 µg/m³Forest Park, 24 March: 6.0 µg/m³MaconMacon, 18 March: 5.2 µg/m³Macon, 19 March: 4.8 µg/m³Macon, 20 March: no readingMacon, 21 March: 31.1 µg/m³, 3.2× its usual 9.6Macon, 22 March: 17.4 µg/m³Macon, 23 March: 5.9 µg/m³Macon, 24 March: 7.1 µg/m³AugustaAugusta, 18 March: 5.3 µg/m³Augusta, 19 March: 4.5 µg/m³Augusta, 20 March: no readingAugusta, 21 March: 29.8 µg/m³, 3.4× its usual 8.8Augusta, 22 March: 13.1 µg/m³Augusta, 23 March: 5.6 µg/m³Augusta, 24 March: 4.7 µg/m³AlbanyAlbany, 18 March: 5.4 µg/m³Albany, 19 March: 6.5 µg/m³Albany, 20 March: no readingAlbany, 21 March: 28.8 µg/m³, 2.7× its usual 10.6Albany, 22 March: 11.5 µg/m³Albany, 23 March: 6.2 µg/m³Albany, 24 March: 9.2 µg/m³SavannahSavannah, 18 March: 6.2 µg/m³Savannah, 19 March: 6.8 µg/m³Savannah, 20 March: no readingSavannah, 21 March: 28.6 µg/m³, 3.6× its usual 7.9Savannah, 22 March: 8.7 µg/m³Savannah, 23 March: 4.6 µg/m³Savannah, 24 March: 5.9 µg/m³TrussvilleTrussville, 18 March: 4.9 µg/m³Trussville, 19 March: 9.1 µg/m³Trussville, 20 March: no readingTrussville, 21 March: 28.5 µg/m³, 3.5× its usual 8.1Trussville, 22 March: 21.9 µg/m³Trussville, 23 March: 9.3 µg/m³Trussville, 24 March: 7.9 µg/m³Phenix CityPhenix City, 18 March: 5.6 µg/m³Phenix City, 19 March: 5.2 µg/m³Phenix City, 20 March: no readingPhenix City, 21 March: 27.9 µg/m³, 3.1× its usual 9.1Phenix City, 22 March: 16.3 µg/m³Phenix City, 23 March: 8.9 µg/m³Phenix City, 24 March: 6.2 µg/m³Saint AndrewsSaint Andrews, 18 March: 7.1 µg/m³Saint Andrews, 19 March: 7.1 µg/m³Saint Andrews, 20 March: no readingSaint Andrews, 21 March: 27.6 µg/m³, 3.8× its usual 7.2Saint Andrews, 22 March: 14.9 µg/m³Saint Andrews, 23 March: 5.7 µg/m³Saint Andrews, 24 March: 5.6 µg/m³KennesawKennesaw, 18 March: 5.2 µg/m³Kennesaw, 19 March: 13.4 µg/m³Kennesaw, 20 March: no readingKennesaw, 21 March: 26.8 µg/m³, 3.4× its usual 7.8Kennesaw, 22 March: 19.7 µg/m³Kennesaw, 23 March: 9.4 µg/m³Kennesaw, 24 March: 6.6 µg/m³LawrencevilleLawrenceville, 18 March: 3.9 µg/m³Lawrenceville, 19 March: 5.8 µg/m³Lawrenceville, 20 March: no readingLawrenceville, 21 March: 25.6 µg/m³, 3.1× its usual 8.2Lawrenceville, 22 March: 23.1 µg/m³Lawrenceville, 23 March: 6.8 µg/m³Lawrenceville, 24 March: 7.6 µg/m³HueytownHueytown, 18 March: 5.3 µg/m³Hueytown, 19 March: 8.9 µg/m³Hueytown, 20 March: no readingHueytown, 21 March: 25.3 µg/m³, 3.4× its usual 7.4Hueytown, 22 March: 23.5 µg/m³Hueytown, 23 March: 7.2 µg/m³Hueytown, 24 March: 8.8 µg/m³18 Mar192021222324
Every counted city, in the order the episode reached them, 3 days before to 3 after. Each square is a day, coloured by that day's PM2.5; outlined: at twice the city's usual or more.
Good0–50
Moderate51–100
Sensitive groups101–150
Unhealthy151–200
Very unhealthy201–300
Hazardous301+

Every city it reached

CityDaysHighestUsualAbove usual
Forest ParkGeorgia, United States1 35.621 March6.55.5×
BirminghamAlabama, United States1 41.221 March10.53.9×
ColumbusGeorgia, United States1 35.721 March9.53.8×
Saint AndrewsSouth Carolina, United States1 27.621 March7.23.8×
SavannahGeorgia, United States1 28.621 March7.93.6×
TrussvilleAlabama, United States1 28.521 March8.13.5×
AugustaGeorgia, United States1 29.821 March8.83.4×
KennesawGeorgia, United States1 26.821 March7.83.4×
HueytownAlabama, United States1 25.321 March7.43.4×
MaconGeorgia, United States1 31.121 March9.63.2×
Phenix CityAlabama, United States1 27.921 March9.13.1×
LawrencevilleGeorgia, United States1 25.621 March8.23.1×
AlbanyGeorgia, United States1 28.821 March10.62.7×

Daily means in µg/m³, over the days each city counted in this episode. Highest: its highest of those days. Usual: the city's median for the time of year of that day (its days within 21 days of the date, every year, leaving out the week around it). Above usual: its highest day against that, with a usual under 5 µg/m³ taken as 5.

Against other episodes in the United States

Number 79 of 130 episodes in the United States since our records began, by cities reached.

Bars: cities reached; colour: the level of the episode's highest daily reading. All 130.

Use this page

SmogRank, Georgia, Alabama and South Carolina, United States, March 2024: 13 cities with PM2.5 at twice their usual or more, 21 March 2024, smogrank.com/episodes/2024-03-georgia-alabama-and-south-carolina-united-states (accessed 4 October 2026).

Download top 10 (PNG)

You're welcome to reuse a single chart, image or figure with this citation and a link. Terms.

An episode is a run of days when many cities close to each other (four or more within 350 km on a day, 8 or more in all) each had a daily PM2.5 mean of at least 25 µg/m³ and at least 2 times their usual for that time of year. Found in our own measurements, not picked by hand. How we find episodes. Values are each city's daily mean of its own monitors; causes are the usual kinds for a pattern like this, not a confirmed source.