SmogRank / Episodes / United States
California and Nevada, United States, July 2024
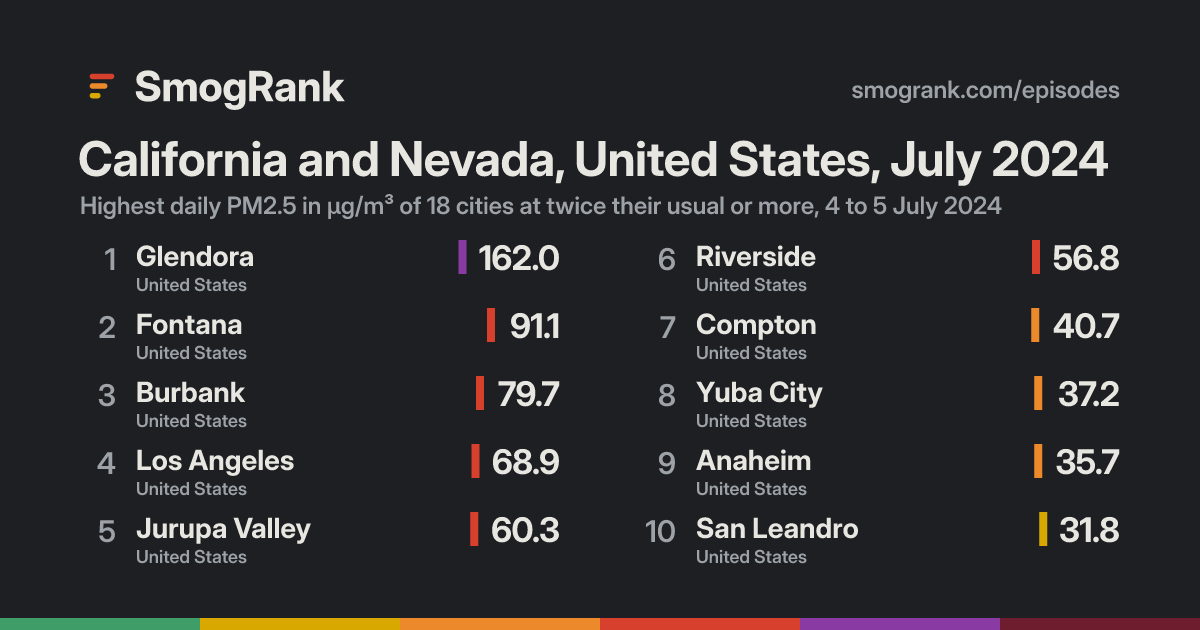
For 2 days, from 4 to 5 July 2024, 18 cities in the United States had PM2.5 at least twice their usual for the time of year. The worst reading was Glendora, California, United States: 162.0 µg/m³ on 5 July, about 13× its usual 12.6.
Likely Independence Day fireworks It came on 4 and 5 July, when fireworks smoke fills the air over many US cities at once.
Cities reached 18 in 1 country
Days 2 4 to 5 July 2024
Worst day 4 July 12 cities counted
Furthest above usual 13× Glendora
Day by day
Play 4 July 12 cities at twice their usual or more
Porterville Hanford Clovis Fresno Madera Lancaster Merced Fillmore Simi Valley Atascadero Santa Barbara Thousand Oaks Nipomo San Luis Obispo Agoura Victorville Arroyo Grande Orcutt Turlock Santa Monica Inglewood Lompoc Hawthorne Modesto Torrance Carson Lomita Long Beach Hollister South Lake Tahoe Manteca Carson City Gilroy Salinas Stockton Prunedale Tracy Lake Elsinore Banning Watsonville Galt Seaside Truckee Reno Elk Grove Summerlin South Folsom San Jose Live Oak Florin Santa Cruz Spring Valley Pleasanton Enterprise Sunnyvale Sacramento Lincoln Indio Henderson Davis Redwood City Woodland Vacaville Boulder City Oakland Berkeley Richmond San Francisco San Rafael Santa Rosa Mesquite Ukiah La Crescenta-Montrose Santa Clarita Visalia Bakersfield Corcoran Anaheim Compton Roseville Riverside Jurupa Valley Yuba City Los Angeles Arden-Arcade Las Vegas San Leandro Fontana Burbank Glendora 1 Jul 2 3 4 5 6 7 8 Every measured city in the area, coloured by its PM2.5 that day; a dark ring marks a city at twice its usual or more. Bars: cities counted each day, coloured by their median level. Choose a day or press play; without JavaScript, the days link to that day's world ranking.
How it spread
Compton Compton, 1 July: 8.4 µg/m³ Compton, 2 July: 10.9 µg/m³ Compton, 3 July: 11.3 µg/m³ Compton, 4 July: 40.7 µg/m³, 3.8× its usual 10.7 Compton, 5 July: 34.0 µg/m³, 3.2× its usual 10.7 Compton, 6 July: 8.5 µg/m³ Compton, 7 July: 8.0 µg/m³ Compton, 8 July: 7.4 µg/m³ Los Angeles Los Angeles, 1 July: 14.4 µg/m³ Los Angeles, 2 July: 16.7 µg/m³ Los Angeles, 3 July: 12.9 µg/m³ Los Angeles, 4 July: 37.6 µg/m³, 2.8× its usual 13.4 Los Angeles, 5 July: 68.9 µg/m³, 5.1× its usual 13.4 Los Angeles, 6 July: 15.2 µg/m³ Los Angeles, 7 July: 12.4 µg/m³ Los Angeles, 8 July: 12.4 µg/m³ Yuba City Yuba City, 1 July: 7.2 µg/m³ Yuba City, 2 July: 8.2 µg/m³ Yuba City, 3 July: 10.2 µg/m³ Yuba City, 4 July: 37.2 µg/m³, 5.0× its usual 7.5 Yuba City, 5 July: 41.9 µg/m³ Yuba City, 6 July: 19.7 µg/m³ Yuba City, 7 July: 16.6 µg/m³ Yuba City, 8 July: 12.8 µg/m³ Anaheim Anaheim, 1 July: 8.4 µg/m³ Anaheim, 2 July: 9.5 µg/m³ Anaheim, 3 July: 16.2 µg/m³ Anaheim, 4 July: 35.7 µg/m³, 3.5× its usual 10.1 Anaheim, 5 July: 25.7 µg/m³, 2.5× its usual 10.1 Anaheim, 6 July: 10.4 µg/m³ Anaheim, 7 July: 8.3 µg/m³ Anaheim, 8 July: 9.6 µg/m³ Glendora Glendora, 1 July: 13.4 µg/m³ Glendora, 2 July: 14.9 µg/m³ Glendora, 3 July: 15.1 µg/m³ Glendora, 4 July: 32.1 µg/m³, 2.5× its usual 12.6 Glendora, 5 July: 162.0 µg/m³, 13× its usual 12.6 Glendora, 6 July: 16.2 µg/m³ Glendora, 7 July: 12.2 µg/m³ Glendora, 8 July: 16.3 µg/m³ San Leandro San Leandro, 1 July: 7.2 µg/m³ San Leandro, 2 July: 11.4 µg/m³ San Leandro, 3 July: 10.2 µg/m³ San Leandro, 4 July: 31.8 µg/m³, 5.5× its usual 5.8 San Leandro, 5 July: 17.1 µg/m³ San Leandro, 6 July: 8.9 µg/m³ San Leandro, 7 July: 7.4 µg/m³ San Leandro, 8 July: 4.5 µg/m³ Las Vegas Las Vegas, 1 July: 4.3 µg/m³ Las Vegas, 2 July: 6.2 µg/m³ Las Vegas, 3 July: 6.4 µg/m³ Las Vegas, 4 July: 31.4 µg/m³, 5.5× its usual 5.7 Las Vegas, 5 July: 9.3 µg/m³ Las Vegas, 6 July: 5.0 µg/m³ Las Vegas, 7 July: 4.8 µg/m³ Las Vegas, 8 July: 7.0 µg/m³ Bakersfield Bakersfield, 1 July: 12.2 µg/m³ Bakersfield, 2 July: 13.8 µg/m³ Bakersfield, 3 July: 15.5 µg/m³ Bakersfield, 4 July: 31.1 µg/m³, 3.1× its usual 10.0 Bakersfield, 5 July: 17.3 µg/m³ Bakersfield, 6 July: 16.3 µg/m³ Bakersfield, 7 July: 17.2 µg/m³ Bakersfield, 8 July: 14.3 µg/m³ Visalia Visalia, 1 July: 10.5 µg/m³ Visalia, 2 July: 14.8 µg/m³ Visalia, 3 July: 20.5 µg/m³ Visalia, 4 July: 28.8 µg/m³, 3.0× its usual 9.6 Visalia, 5 July: 25.6 µg/m³, 2.7× its usual 9.6 Visalia, 6 July: 21.8 µg/m³ Visalia, 7 July: 22.0 µg/m³ Visalia, 8 July: 17.3 µg/m³ Arden-Arcade Arden-Arcade, 1 July: 4.5 µg/m³ Arden-Arcade, 2 July: 4.1 µg/m³ Arden-Arcade, 3 July: 9.4 µg/m³ Arden-Arcade, 4 July: 28.6 µg/m³, 5.4× its usual 5.3 Arden-Arcade, 5 July: 10.4 µg/m³ Arden-Arcade, 6 July: 10.5 µg/m³ Arden-Arcade, 7 July: 9.5 µg/m³ Arden-Arcade, 8 July: no reading Corcoran Corcoran, 1 July: 7.3 µg/m³ Corcoran, 2 July: 8.1 µg/m³ Corcoran, 3 July: 13.0 µg/m³ Corcoran, 4 July: 28.5 µg/m³, 3.2× its usual 8.8 Corcoran, 5 July: 15.9 µg/m³ Corcoran, 6 July: 14.3 µg/m³ Corcoran, 7 July: 16.4 µg/m³ Corcoran, 8 July: 11.7 µg/m³ Roseville Roseville, 1 July: 5.6 µg/m³ Roseville, 2 July: 6.7 µg/m³ Roseville, 3 July: 13.6 µg/m³ Roseville, 4 July: 25.2 µg/m³, 3.9× its usual 6.5 Roseville, 5 July: 13.7 µg/m³ Roseville, 6 July: 13.3 µg/m³ Roseville, 7 July: 13.3 µg/m³ Roseville, 8 July: 10.2 µg/m³ Fontana Fontana, 1 July: 14.7 µg/m³ Fontana, 2 July: 16.8 µg/m³ Fontana, 3 July: 17.8 µg/m³ Fontana, 4 July: 27.0 µg/m³ Fontana, 5 July: 91.1 µg/m³, 6.4× its usual 14.2 Fontana, 6 July: 20.9 µg/m³ Fontana, 7 July: 14.1 µg/m³ Fontana, 8 July: 19.8 µg/m³ Burbank Burbank, 1 July: 14.6 µg/m³ Burbank, 2 July: 14.0 µg/m³ Burbank, 3 July: 11.8 µg/m³ Burbank, 4 July: 19.2 µg/m³ Burbank, 5 July: 79.7 µg/m³, 7.0× its usual 11.4 Burbank, 6 July: 17.9 µg/m³ Burbank, 7 July: 13.8 µg/m³ Burbank, 8 July: 12.6 µg/m³ Jurupa Valley Jurupa Valley, 1 July: 12.4 µg/m³ Jurupa Valley, 2 July: 14.9 µg/m³ Jurupa Valley, 3 July: 17.9 µg/m³ Jurupa Valley, 4 July: 22.3 µg/m³ Jurupa Valley, 5 July: 60.3 µg/m³, 4.4× its usual 13.8 Jurupa Valley, 6 July: 16.5 µg/m³ Jurupa Valley, 7 July: 13.1 µg/m³ Jurupa Valley, 8 July: 12.8 µg/m³ Riverside Riverside, 1 July: 12.2 µg/m³ Riverside, 2 July: 12.0 µg/m³ Riverside, 3 July: 16.5 µg/m³ Riverside, 4 July: 18.8 µg/m³ Riverside, 5 July: 56.8 µg/m³, 4.3× its usual 13.1 Riverside, 6 July: 18.6 µg/m³ Riverside, 7 July: 12.9 µg/m³ Riverside, 8 July: 12.6 µg/m³ Santa Clarita Santa Clarita, 1 July: 11.6 µg/m³ Santa Clarita, 2 July: 12.3 µg/m³ Santa Clarita, 3 July: 12.7 µg/m³ Santa Clarita, 4 July: 20.8 µg/m³ Santa Clarita, 5 July: 29.3 µg/m³, 2.6× its usual 11.2 Santa Clarita, 6 July: 16.8 µg/m³ Santa Clarita, 7 July: 15.2 µg/m³ Santa Clarita, 8 July: 15.1 µg/m³ La Crescenta-Montro… La Crescenta-Montrose, 1 July: no reading La Crescenta-Montrose, 2 July: 10.6 µg/m³ La Crescenta-Montrose, 3 July: 9.0 µg/m³ La Crescenta-Montrose, 4 July: 13.1 µg/m³ La Crescenta-Montrose, 5 July: 25.3 µg/m³, 2.6× its usual 9.6 La Crescenta-Montrose, 6 July: 16.8 µg/m³ La Crescenta-Montrose, 7 July: 11.5 µg/m³ La Crescenta-Montrose, 8 July: 13.4 µg/m³ 1 Jul 2 3 4 5 6 7 8 Every counted city, in the order the episode reached them, 3 days before to 3 after. Each square is a day, coloured by that day's PM2.5; outlined: at twice the city's usual or more. Good 0–50
Moderate 51–100
Sensitive groups 101–150
Unhealthy 151–200
Very unhealthy 201–300
Hazardous 301+
Every city it reached
City Days Highest Usual Above usual
Glendora California, United States 2 5 July 12.6 13× Burbank California, United States 1 5 July 11.4 7.0× Fontana California, United States 1 5 July 14.2 6.4× San Leandro California, United States 1 4 July 5.8 5.5× Las Vegas Nevada, United States 1 4 July 5.7 5.5× Arden-Arcade California, United States 1 4 July 5.3 5.4× Los Angeles California, United States 2 5 July 13.4 5.1× Yuba City California, United States 1 4 July 7.5 5.0× Jurupa Valley California, United States 1 5 July 13.8 4.4× Riverside California, United States 1 5 July 13.1 4.3× Roseville California, United States 1 4 July 6.5 3.9× Compton California, United States 2 4 July 10.7 3.8× Anaheim California, United States 2 4 July 10.1 3.5× Corcoran California, United States 1 4 July 8.8 3.2× Bakersfield California, United States 1 4 July 10.0 3.1× Visalia California, United States 2 4 July 9.6 3.0× Santa Clarita California, United States 1 5 July 11.2 2.6× La Crescenta-Montrose California, United States 1 5 July 9.6 2.6×
Daily means in µg/m³, over the days each city counted in this episode. Highest: its highest of those days. Usual: the city's median for the time of year of that day (its days within 21 days of the date, every year, leaving out the week around it). Above usual: its highest day against that, with a usual under 5 µg/m³ taken as 5.
Against other episodes in the United States
Number 60 of 130 episodes in the United States since our records began, by cities reached.
Eastern United States and Canada, 25 June to 2 July 2023 280 North-eastern United States and Canada, July 2026 264 Eastern United States and Canada, May and June 2023 261 North-eastern United States and Canada, 30 July to 9 August 2025 241 Eastern United States and Canada, July 2023 240 North-eastern United States and Canada, 3 to 9 June 2025 196 Eastern United States and Canada, 14 to 19 June 2023 161 North-eastern United States and Canada, 12 to 16 July 2025 119 North-western United States and Canada, August 2023 110 North-eastern United States and Canada, 10 to 14 June 2025 104 North-western United States and Canada, 4 to 11 August 2026 99 North-eastern United States and Canada, 14 to 19 February 2026 96 California and Nevada, United States, July 2024 18 Bars: cities reached; colour: the level of the episode's highest daily reading. All 130 .
Use this page SmogRank, California and Nevada, United States, July 2024: 18 cities with PM2.5 at twice their usual or more, 4 to 5 July 2024, smogrank.com/episodes/2024-07-california-and-nevada-united-states (accessed 4 October 2026).
Copy citation Download top 10 (PNG)
You're welcome to reuse a single chart, image or figure with this citation and a link. Terms .
An episode is a run of days when many cities close to each other (four or more within 350 km on a day, 8 or more in all) each had a daily PM2.5 mean of at least 25 µg/m³ and at least 2 times their usual for that time of year. Found in our own measurements, not picked by hand. How we find episodes . Values are each city's daily mean of its own monitors; causes are the usual kinds for a pattern like this, not a confirmed source.