SmogRank / Episodes / United States
United States and Mexico, March 2025
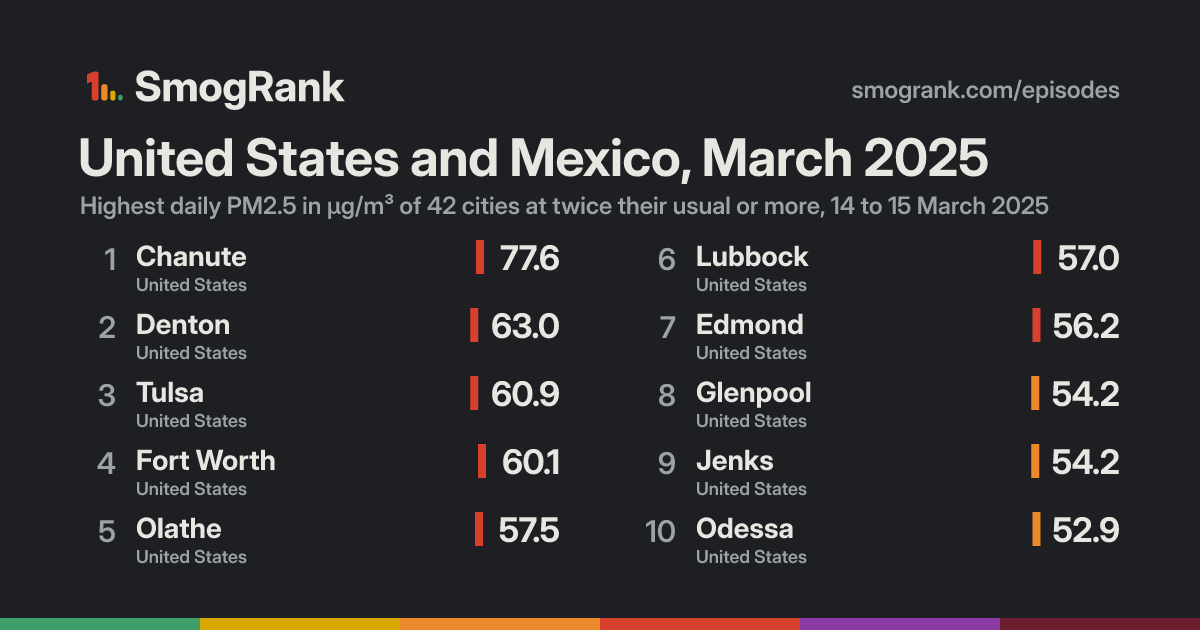
For 2 days, from 14 to 15 March 2025, 42 cities in the United States and Mexico had PM2.5 at least twice their usual for the time of year. The worst reading was Chanute, Kansas, United States: 77.6 µg/m³ on 14 March, about 9.2× its usual 8.4. Ended 15 March.
Day by day
How it spread
Every city it reached
| City | Days | Highest | Above usual |
|---|---|---|---|
| LubbockTexas, United States | 1 | 57.014 March | 11× |
| ChanuteKansas, United States | 1 | 77.614 March | 9.2× |
| DentonTexas, United States | 1 | 63.014 March | 9.0× |
| LeawoodKansas, United States | 1 | 44.214 March | 8.3× |
| OdessaTexas, United States | 1 | 52.914 March | 7.8× |
| OlatheKansas, United States | 1 | 57.514 March | 7.7× |
| Fort WorthTexas, United States | 1 | 60.114 March | 7.5× |
| KearneyMissouri, United States | 1 | 38.814 March | 7.5× |
| LibertyMissouri, United States | 1 | 38.814 March | 7.5× |
| EdmondOklahoma, United States | 1 | 56.214 March | 7.4× |
| Kansas CityKansas, United States | 1 | 52.914 March | 6.5× |
| LawtonOklahoma, United States | 1 | 44.414 March | 6.5× |
| Kansas CityMissouri, United States | 1 | 42.614 March | 6.4× |
| TulsaOklahoma, United States | 1 | 60.914 March | 6.2× |
| Ponca CityOklahoma, United States | 1 | 51.314 March | 6.0× |
| GlenpoolOklahoma, United States | 1 | 54.214 March | 5.9× |
| JenksOklahoma, United States | 1 | 54.214 March | 5.9× |
| McAlesterOklahoma, United States | 1 | 46.514 March | 5.9× |
| Fort SmithArkansas, United States | 1 | 45.314 March | 5.6× |
| MooreOklahoma, United States | 1 | 45.914 March | 5.5× |
| River OaksTexas, United States | 1 | 39.114 March | 5.2× |
| SaginawTexas, United States | 1 | 39.114 March | 5.2× |
| KaufmanTexas, United States | 1 | 36.614 March | 5.2× |
| MiamiOklahoma, United States | 1 | 46.114 March | 5.1× |
| TopekaKansas, United States | 1 | 40.614 March | 5.1× |
| DerbyKansas, United States | 1 | 39.114 March | 5.1× |
| HaysvilleKansas, United States | 1 | 39.114 March | 5.1× |
| Oklahoma CityOklahoma, United States | 1 | 43.014 March | 5.0× |
| Saint JosephMissouri, United States | 1 | 32.114 March | 4.4× |
| Heroica MatamorosTamaulipas, Mexico | 2 | 41.614 March | 4.1× |
| SpringdaleArkansas, United States | 1 | 34.114 March | 3.8× |
| WichitaKansas, United States | 1 | 33.514 March | 3.7× |
| Port IsabelTexas, United States | 2 | 48.715 March | 3.4× |
| Mission BendTexas, United States | 1 | 28.014 March | 3.0× |
| Lacy-LakeviewTexas, United States | 1 | 27.714 March | 3.0× |
| ConroeTexas, United States | 1 | 29.914 March | 2.9× |
| Corpus ChristiTexas, United States | 1 | 30.114 March | 2.7× |
| PasadenaTexas, United States | 1 | 26.914 March | 2.7× |
| MissionTexas, United States | 1 | 29.315 March | 2.6× |
| HoustonTexas, United States | 1 | 27.914 March | 2.4× |
| Cadereyta JiménezNuevo León, Mexico | 2 | 35.614 March | 2.3× |
| Ciudad Benito JuárezNuevo León, Mexico | 1 | 38.815 March | 2.1× |
Daily means in µg/m³, over the days each city counted in this episode. Highest: its highest of those days. Usual: the city's median for the time of year of that day (its days within 21 days of the date, every year, leaving out the week around it). Above usual: its highest day against that, with a usual under 5 µg/m³ taken as 5.
Against other episodes in the United States and Mexico
Number 33 of 163 episodes in the United States and Mexico since our records began, by cities reached.
- Eastern United States and Canada, June and July 2023343
- Northern United States and Canada, July 2026327
- United States and Canada, July 2023322
- Eastern United States and Canada, May and June 2023317
- North-eastern United States and Canada, 29 July to 9 August 2025292
- Northern United States and Canada, May and June 2025247
- United States and Canada, June 2023195
- North-western United States and Canada, August 2023176
- North-western United States and Canada, 4 to 22 August 2026151
- Northern United States and Canada, July 2025139
- Northern United States and Canada, June 2025134
- North-western United States and Canada, July and August 2026118
- United States and Mexico, March 202542
Bars: cities reached; colour: the level of the episode's highest daily reading. All 163.
Use this page
SmogRank, United States and Mexico, March 2025: 42 cities with PM2.5 at twice their usual or more, 14 to 15 March 2025, smogrank.com/episodes/2025-03-united-states-and-mexico (accessed 5 October 2026).
You're welcome to reuse a single chart, image or figure with this citation and a link. Terms.
An episode is a run of days when many cities close to each other (four or more within 350 km on a day, 8 or more in all) each had a daily PM2.5 mean of at least 25 µg/m³ and at least 2 times their usual for that time of year. Found in our own measurements, not picked by hand. How we find episodes. Values are each city's daily mean of its own monitors; causes are the usual kinds for a pattern like this, not a confirmed source.