SmogRank / Episodes / Italy
Italy, France and 2 more countries, June 2025
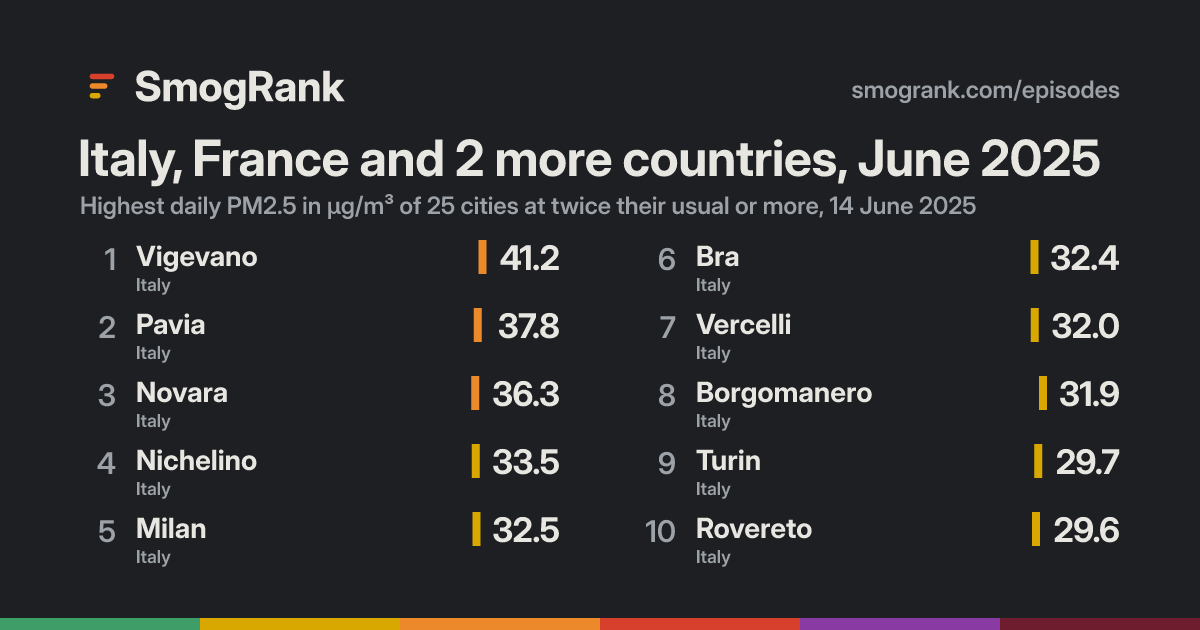
For 4 days, from 13 to 16 June 2025, 47 cities in Italy, France, Switzerland and 1 more countries had PM2.5 at least twice their usual for the time of year. The worst reading was Mortara, Lombardy, Italy: 41.2 µg/m³ on 14 June, about 3.7× its usual 11.1. Ended 16 June.
Few fires were detected near these cities on those days. Spreads like this usually come from still weather trapping smoke from heating, traffic and industry, or from dust.
Cities reached 47 in 4 countries
Days 4 13 to 16 June 2025
Worst day 14 June 42 cities counted
Furthest above usual 3.9× Bellinzona
Day by day
Play 14 June 42 cities at twice their usual or more
La Spezia Corte Borgo Valsugana Ancona Cairo Montenotte Laives San Giorgio di Nogaro Koper Gorizia Nova Gorica Lienz Rijeka Fréjus Aosta Kranj Ljubljana Kostel Klagenfurt am Wörthersee Biograd na Moru Benevento Avellino Novo Mesto Solofra Zagorje ob Savi Passy Bern Salerno San Severo Trbovlje Sallanches La Garde Gap Albertville Celje Wolfsberg Bihać Payerne Manosque Auriol Crolles Annecy Annemasse Chambéry Meylan Grenoble Gardanne Aix-en-Provence Polla Zagreb Marseille Maribor Leibnitz Rognac Marignane Ptuj Salon-de-Provence Prijedor Fos-sur-Mer L'Isle-d'Abeau Murska Sobota Livno Villefontaine Avignon Kutina Bourg-en-Bresse Jonage Arles Meyzieu Roussillon Banja Luka Lyon Koprivnica Bari Nîmes Villefranche-sur-Saône Mâcon Saint-Chamond Sorbiers Srbac Saint-Étienne Lunel Travnik Chalon-sur-Saône Monopoli Paolo VI Montceau-les-Mines Alessandria Chiaravalle Trento Savona Porto Potenza Picena Rovereto Vercelli Jesi Vinovo Capannori Biella Andria Bra Nichelino Bolzano Menton Monaco Falconara Marittima Crescentino Foggia Cava Dè Tirreni Como Borgomanero Nocera Inferiore Acerra Marigliano Novara Turin Caserta Milan Naples Pavia Romans-sur-Isère Contes Nice Bellegarde-sur-Valserine Genoa Cannes Santa Maria A Vico Casamassima Bastia Valence Vigevano Lugano Mortara Giubiasco Bellinzona On the map: 39 fire detections.
10 Jun 11 12 13 14 15 16 17 18 19 Every measured city in the area, coloured by its PM2.5 that day; a dark ring marks a city at twice its usual or more. Bars: cities counted each day, coloured by their median level. Choose a day or press play; without JavaScript, the days link to that day's world ranking. Fires, seen Heat satellites detected that day (via NASA FIRMS); bigger and glowing means more detections in the area. Farm burning and other fires count too, not only wildfires.Under the cities, for each UTC day: fires satellites detected (via NASA FIRMS), smoke NOAA analysts traced and volcanic ash warnings for aircraft. They show what was in the air, not that it caused the readings.
Fires: NASA FIRMS (VIIRS). Traced smoke: NOAA Hazard Mapping System. Volcanic ash: aviation ash warnings (SIGMETs) via NOAA's Aviation Weather Center.
How it spread
Casamassima Casamassima, 10 June: 16.5 µg/m³ Casamassima, 11 June: 22.9 µg/m³ Casamassima, 12 June: 25.3 µg/m³ Casamassima, 13 June: 35.7 µg/m³, 3.5× its usual 10.1 Casamassima, 14 June: 21.2 µg/m³ Casamassima, 15 June: 16.4 µg/m³ Casamassima, 16 June: 17.0 µg/m³ Casamassima, 17 June: 16.6 µg/m³ Casamassima, 18 June: 13.2 µg/m³ Casamassima, 19 June: no reading Falconara Marittima Falconara Marittima, 10 June: 21.7 µg/m³ Falconara Marittima, 11 June: 24.0 µg/m³ Falconara Marittima, 12 June: 26.0 µg/m³ Falconara Marittima, 13 June: 35.6 µg/m³, 2.8× its usual 12.5 Falconara Marittima, 14 June: 24.7 µg/m³ Falconara Marittima, 15 June: 20.7 µg/m³ Falconara Marittima, 16 June: 23.6 µg/m³ Falconara Marittima, 17 June: 11.8 µg/m³ Falconara Marittima, 18 June: 17.1 µg/m³ Falconara Marittima, 19 June: 20.7 µg/m³ Santa Maria A Vico Santa Maria A Vico, 10 June: 28.8 µg/m³ Santa Maria A Vico, 11 June: 28.1 µg/m³ Santa Maria A Vico, 12 June: 31.6 µg/m³ Santa Maria A Vico, 13 June: 35.1 µg/m³, 3.4× its usual 10.4 Santa Maria A Vico, 14 June: 30.9 µg/m³, 2.9× its usual 10.6 Santa Maria A Vico, 15 June: 31.0 µg/m³, 2.9× its usual 10.6 Santa Maria A Vico, 16 June: 29.4 µg/m³, 2.8× its usual 10.6 Santa Maria A Vico, 17 June: 19.6 µg/m³ Santa Maria A Vico, 18 June: 11.2 µg/m³ Santa Maria A Vico, 19 June: 16.1 µg/m³ Marigliano Marigliano, 10 June: 28.9 µg/m³ Marigliano, 11 June: 29.3 µg/m³ Marigliano, 12 June: 30.9 µg/m³ Marigliano, 13 June: 34.7 µg/m³, 3.0× its usual 11.6 Marigliano, 14 June: 30.3 µg/m³, 2.6× its usual 11.7 Marigliano, 15 June: 31.7 µg/m³, 2.7× its usual 11.8 Marigliano, 16 June: 29.9 µg/m³, 2.5× its usual 11.9 Marigliano, 17 June: 21.7 µg/m³ Marigliano, 18 June: 12.7 µg/m³ Marigliano, 19 June: 15.9 µg/m³ Naples Naples, 10 June: 24.3 µg/m³ Naples, 11 June: 25.7 µg/m³ Naples, 12 June: 27.9 µg/m³ Naples, 13 June: 33.0 µg/m³, 3.1× its usual 10.5 Naples, 14 June: 30.6 µg/m³, 2.9× its usual 10.6 Naples, 15 June: 26.9 µg/m³, 2.6× its usual 10.5 Naples, 16 June: 23.9 µg/m³ Naples, 17 June: 20.1 µg/m³ Naples, 18 June: 11.9 µg/m³ Naples, 19 June: 15.8 µg/m³ Acerra Acerra, 10 June: 23.0 µg/m³ Acerra, 11 June: 25.0 µg/m³ Acerra, 12 June: 26.7 µg/m³ Acerra, 13 June: 31.6 µg/m³, 3.0× its usual 10.5 Acerra, 14 June: 28.8 µg/m³, 2.7× its usual 10.5 Acerra, 15 June: 28.5 µg/m³, 2.7× its usual 10.5 Acerra, 16 June: 25.5 µg/m³, 2.4× its usual 10.5 Acerra, 17 June: 20.1 µg/m³ Acerra, 18 June: 14.1 µg/m³ Acerra, 19 June: 16.9 µg/m³ Chiaravalle Chiaravalle, 10 June: 23.3 µg/m³ Chiaravalle, 11 June: 28.7 µg/m³ Chiaravalle, 12 June: no reading Chiaravalle, 13 June: 31.2 µg/m³, 2.3× its usual 13.6 Chiaravalle, 14 June: 27.8 µg/m³, 2.0× its usual 13.6 Chiaravalle, 15 June: 24.4 µg/m³ Chiaravalle, 16 June: 24.1 µg/m³ Chiaravalle, 17 June: 12.0 µg/m³ Chiaravalle, 18 June: 18.1 µg/m³ Chiaravalle, 19 June: 19.8 µg/m³ Nocera Inferiore Nocera Inferiore, 10 June: 24.6 µg/m³ Nocera Inferiore, 11 June: 24.8 µg/m³ Nocera Inferiore, 12 June: 28.6 µg/m³ Nocera Inferiore, 13 June: 31.0 µg/m³, 3.0× its usual 10.2 Nocera Inferiore, 14 June: 28.4 µg/m³, 2.8× its usual 10.2 Nocera Inferiore, 15 June: 28.3 µg/m³, 2.8× its usual 10.2 Nocera Inferiore, 16 June: 26.7 µg/m³, 2.6× its usual 10.2 Nocera Inferiore, 17 June: 19.4 µg/m³ Nocera Inferiore, 18 June: 11.5 µg/m³ Nocera Inferiore, 19 June: 14.6 µg/m³ Caserta Caserta, 10 June: 25.4 µg/m³ Caserta, 11 June: 24.6 µg/m³ Caserta, 12 June: 31.4 µg/m³ Caserta, 13 June: 30.9 µg/m³, 3.1× its usual 9.9 Caserta, 14 June: 28.3 µg/m³, 2.9× its usual 9.9 Caserta, 15 June: 29.5 µg/m³, 3.0× its usual 9.9 Caserta, 16 June: 27.0 µg/m³, 2.7× its usual 10.1 Caserta, 17 June: 18.1 µg/m³ Caserta, 18 June: 10.7 µg/m³ Caserta, 19 June: 15.4 µg/m³ Jesi Jesi, 10 June: 21.9 µg/m³ Jesi, 11 June: 26.0 µg/m³ Jesi, 12 June: 30.8 µg/m³ Jesi, 13 June: 30.5 µg/m³, 2.6× its usual 11.6 Jesi, 14 June: 25.1 µg/m³, 2.1× its usual 11.8 Jesi, 15 June: 26.8 µg/m³, 2.3× its usual 11.7 Jesi, 16 June: 22.1 µg/m³ Jesi, 17 June: 15.3 µg/m³ Jesi, 18 June: 19.5 µg/m³ Jesi, 19 June: no reading Andria Andria, 10 June: 20.2 µg/m³ Andria, 11 June: 23.9 µg/m³ Andria, 12 June: 28.5 µg/m³ Andria, 13 June: 30.0 µg/m³, 2.7× its usual 11.0 Andria, 14 June: 21.7 µg/m³ Andria, 15 June: 17.8 µg/m³ Andria, 16 June: 27.8 µg/m³, 2.5× its usual 11.2 Andria, 17 June: 15.6 µg/m³ Andria, 18 June: 12.8 µg/m³ Andria, 19 June: 14.3 µg/m³ Porto Potenza Picena Porto Potenza Picena, 10 June: 20.2 µg/m³ Porto Potenza Picena, 11 June: 27.8 µg/m³ Porto Potenza Picena, 12 June: no reading Porto Potenza Picena, 13 June: 27.7 µg/m³, 2.6× its usual 10.6 Porto Potenza Picena, 14 June: 21.6 µg/m³ Porto Potenza Picena, 15 June: 22.7 µg/m³ Porto Potenza Picena, 16 June: 21.9 µg/m³ Porto Potenza Picena, 17 June: 10.6 µg/m³ Porto Potenza Picena, 18 June: 16.2 µg/m³ Porto Potenza Picena, 19 June: 15.1 µg/m³ Foggia Foggia, 10 June: 14.2 µg/m³ Foggia, 11 June: 20.7 µg/m³ Foggia, 12 June: 26.7 µg/m³ Foggia, 13 June: 26.8 µg/m³, 2.9× its usual 9.4 Foggia, 14 June: 17.6 µg/m³ Foggia, 15 June: 17.6 µg/m³ Foggia, 16 June: 20.5 µg/m³ Foggia, 17 June: 8.9 µg/m³ Foggia, 18 June: 5.3 µg/m³ Foggia, 19 June: 13.3 µg/m³ Mortara Mortara, 10 June: no reading Mortara, 11 June: 24.6 µg/m³ Mortara, 12 June: no reading Mortara, 13 June: no reading Mortara, 14 June: 41.2 µg/m³, 3.7× its usual 11.1 Mortara, 15 June: no reading Mortara, 16 June: no reading Mortara, 17 June: no reading Mortara, 18 June: no reading Mortara, 19 June: no reading Vigevano Vigevano, 10 June: no reading Vigevano, 11 June: 24.6 µg/m³ Vigevano, 12 June: no reading Vigevano, 13 June: no reading Vigevano, 14 June: 41.2 µg/m³, 3.6× its usual 11.6 Vigevano, 15 June: no reading Vigevano, 16 June: no reading Vigevano, 17 June: no reading Vigevano, 18 June: no reading Vigevano, 19 June: no reading Pavia Pavia, 10 June: no reading Pavia, 11 June: 26.3 µg/m³ Pavia, 12 June: no reading Pavia, 13 June: no reading Pavia, 14 June: 37.8 µg/m³, 3.1× its usual 12.1 Pavia, 15 June: no reading Pavia, 16 June: no reading Pavia, 17 June: no reading Pavia, 18 June: no reading Pavia, 19 June: no reading Novara Novara, 10 June: 18.6 µg/m³ Novara, 11 June: 25.1 µg/m³ Novara, 12 June: no reading Novara, 13 June: no reading Novara, 14 June: 36.3 µg/m³, 3.0× its usual 12.2 Novara, 15 June: no reading Novara, 16 June: no reading Novara, 17 June: no reading Novara, 18 June: no reading Novara, 19 June: no reading Crescentino Crescentino, 10 June: 25.0 µg/m³ Crescentino, 11 June: 27.0 µg/m³ Crescentino, 12 June: no reading Crescentino, 13 June: no reading Crescentino, 14 June: 36.1 µg/m³, 2.8× its usual 12.9 Crescentino, 15 June: 25.4 µg/m³ Crescentino, 16 June: 16.6 µg/m³ Crescentino, 17 June: 10.0 µg/m³ Crescentino, 18 June: 15.5 µg/m³ Crescentino, 19 June: 25.1 µg/m³ Nichelino Nichelino, 10 June: 27.3 µg/m³ Nichelino, 11 June: 26.2 µg/m³ Nichelino, 12 June: no reading Nichelino, 13 June: no reading Nichelino, 14 June: 33.5 µg/m³, 2.7× its usual 12.6 Nichelino, 15 June: no reading Nichelino, 16 June: no reading Nichelino, 17 June: no reading Nichelino, 18 June: no reading Nichelino, 19 June: no reading Vinovo Vinovo, 10 June: 27.3 µg/m³ Vinovo, 11 June: 26.2 µg/m³ Vinovo, 12 June: no reading Vinovo, 13 June: no reading Vinovo, 14 June: 33.5 µg/m³, 2.6× its usual 12.7 Vinovo, 15 June: no reading Vinovo, 16 June: no reading Vinovo, 17 June: no reading Vinovo, 18 June: no reading Vinovo, 19 June: no reading Milan Milan, 10 June: no reading Milan, 11 June: no reading Milan, 12 June: no reading Milan, 13 June: no reading Milan, 14 June: 32.5 µg/m³, 3.1× its usual 10.5 Milan, 15 June: no reading Milan, 16 June: no reading Milan, 17 June: no reading Milan, 18 June: no reading Milan, 19 June: no reading Bra Bra, 10 June: 27.9 µg/m³ Bra, 11 June: 22.9 µg/m³ Bra, 12 June: no reading Bra, 13 June: no reading Bra, 14 June: 32.4 µg/m³, 2.7× its usual 11.8 Bra, 15 June: no reading Bra, 16 June: no reading Bra, 17 June: no reading Bra, 18 June: no reading Bra, 19 June: no reading Borgomanero Borgomanero, 10 June: 19.6 µg/m³ Borgomanero, 11 June: 24.4 µg/m³ Borgomanero, 12 June: 28.3 µg/m³ Borgomanero, 13 June: 35.0 µg/m³ Borgomanero, 14 June: 30.6 µg/m³, 3.0× its usual 10.1 Borgomanero, 15 June: 15.2 µg/m³ Borgomanero, 16 June: 10.2 µg/m³ Borgomanero, 17 June: 8.0 µg/m³ Borgomanero, 18 June: 11.7 µg/m³ Borgomanero, 19 June: 14.7 µg/m³ Vercelli Vercelli, 10 June: 17.8 µg/m³ Vercelli, 11 June: 23.7 µg/m³ Vercelli, 12 June: 28.4 µg/m³ Vercelli, 13 June: 34.3 µg/m³ Vercelli, 14 June: 29.9 µg/m³, 2.6× its usual 11.6 Vercelli, 15 June: 15.3 µg/m³ Vercelli, 16 June: 12.3 µg/m³ Vercelli, 17 June: 7.6 µg/m³ Vercelli, 18 June: 11.5 µg/m³ Vercelli, 19 June: 15.1 µg/m³ Genoa Genoa, 10 June: 27.4 µg/m³ Genoa, 11 June: 25.6 µg/m³ Genoa, 12 June: 27.5 µg/m³ Genoa, 13 June: 27.7 µg/m³ Genoa, 14 June: 29.6 µg/m³, 3.3× its usual 9.1 Genoa, 15 June: 25.1 µg/m³ Genoa, 16 June: 20.1 µg/m³ Genoa, 17 June: 7.3 µg/m³ Genoa, 18 June: 9.1 µg/m³ Genoa, 19 June: 10.8 µg/m³ Rovereto Rovereto, 10 June: 18.4 µg/m³ Rovereto, 11 June: 26.3 µg/m³ Rovereto, 12 June: 26.7 µg/m³ Rovereto, 13 June: no reading Rovereto, 14 June: 29.6 µg/m³, 2.6× its usual 11.5 Rovereto, 15 June: no reading Rovereto, 16 June: no reading Rovereto, 17 June: no reading Rovereto, 18 June: 18.1 µg/m³ Rovereto, 19 June: no reading Nice Nice, 10 June: 31.0 µg/m³ Nice, 11 June: 25.5 µg/m³ Nice, 12 June: 21.1 µg/m³ Nice, 13 June: 26.7 µg/m³ Nice, 14 June: 29.5 µg/m³, 3.2× its usual 9.2 Nice, 15 June: 25.4 µg/m³ Nice, 16 June: 21.3 µg/m³ Nice, 17 June: 15.0 µg/m³ Nice, 18 June: 10.7 µg/m³ Nice, 19 June: 14.5 µg/m³ Como Como, 10 June: no reading Como, 11 June: no reading Como, 12 June: no reading Como, 13 June: no reading Como, 14 June: 29.5 µg/m³, 3.0× its usual 9.7 Como, 15 June: no reading Como, 16 June: no reading Como, 17 June: no reading Como, 18 June: no reading Como, 19 June: no reading Bellinzona Bellinzona, 10 June: 36.0 µg/m³ Bellinzona, 11 June: 28.6 µg/m³ Bellinzona, 12 June: 29.6 µg/m³ Bellinzona, 13 June: no reading Bellinzona, 14 June: 29.4 µg/m³, 3.9× its usual 7.6 Bellinzona, 15 June: no reading Bellinzona, 16 June: no reading Bellinzona, 17 June: no reading Bellinzona, 18 June: 10.8 µg/m³ Bellinzona, 19 June: no reading Giubiasco Giubiasco, 10 June: 36.0 µg/m³ Giubiasco, 11 June: 28.6 µg/m³ Giubiasco, 12 June: 29.6 µg/m³ Giubiasco, 13 June: no reading Giubiasco, 14 June: 29.4 µg/m³, 3.8× its usual 7.7 Giubiasco, 15 June: no reading Giubiasco, 16 June: no reading Giubiasco, 17 June: no reading Giubiasco, 18 June: 10.8 µg/m³ Giubiasco, 19 June: no reading Cannes Cannes, 10 June: 34.3 µg/m³ Cannes, 11 June: 28.5 µg/m³ Cannes, 12 June: 21.9 µg/m³ Cannes, 13 June: 27.6 µg/m³ Cannes, 14 June: 29.1 µg/m³, 3.4× its usual 8.5 Cannes, 15 June: 23.6 µg/m³ Cannes, 16 June: 23.6 µg/m³ Cannes, 17 June: 14.1 µg/m³ Cannes, 18 June: 7.8 µg/m³ Cannes, 19 June: 11.5 µg/m³ Cava Dè Tirreni Cava Dè Tirreni, 10 June: 26.8 µg/m³ Cava Dè Tirreni, 11 June: 23.8 µg/m³ Cava Dè Tirreni, 12 June: no reading Cava Dè Tirreni, 13 June: no reading Cava Dè Tirreni, 14 June: 28.8 µg/m³, 3.0× its usual 9.7 Cava Dè Tirreni, 15 June: 28.5 µg/m³, 2.9× its usual 9.7 Cava Dè Tirreni, 16 June: 24.9 µg/m³ Cava Dè Tirreni, 17 June: 20.7 µg/m³ Cava Dè Tirreni, 18 June: 12.6 µg/m³ Cava Dè Tirreni, 19 June: 15.9 µg/m³ Trento Trento, 10 June: 19.3 µg/m³ Trento, 11 June: 26.5 µg/m³ Trento, 12 June: 30.5 µg/m³ Trento, 13 June: no reading Trento, 14 June: 28.8 µg/m³, 2.5× its usual 11.6 Trento, 15 June: no reading Trento, 16 June: no reading Trento, 17 June: no reading Trento, 18 June: 12.9 µg/m³ Trento, 19 June: no reading Turin Turin, 10 June: 24.1 µg/m³ Turin, 11 June: 24.5 µg/m³ Turin, 12 June: 28.8 µg/m³ Turin, 13 June: 31.1 µg/m³ Turin, 14 June: 28.7 µg/m³, 3.1× its usual 9.3 Turin, 15 June: 20.2 µg/m³ Turin, 16 June: 12.7 µg/m³ Turin, 17 June: 6.7 µg/m³ Turin, 18 June: 11.8 µg/m³ Turin, 19 June: 15.3 µg/m³ Valence Valence, 10 June: 33.3 µg/m³ Valence, 11 June: 44.0 µg/m³ Valence, 12 June: 32.0 µg/m³ Valence, 13 June: 22.6 µg/m³ Valence, 14 June: 27.7 µg/m³, 3.6× its usual 7.6 Valence, 15 June: 14.7 µg/m³ Valence, 16 June: 6.0 µg/m³ Valence, 17 June: 8.2 µg/m³ Valence, 18 June: 8.9 µg/m³ Valence, 19 June: 11.7 µg/m³ Alessandria Alessandria, 10 June: 13.3 µg/m³ Alessandria, 11 June: 22.0 µg/m³ Alessandria, 12 June: no reading Alessandria, 13 June: no reading Alessandria, 14 June: 27.5 µg/m³, 2.1× its usual 13.1 Alessandria, 15 June: no reading Alessandria, 16 June: no reading Alessandria, 17 June: no reading Alessandria, 18 June: no reading Alessandria, 19 June: no reading Bastia Bastia, 10 June: 19.6 µg/m³ Bastia, 11 June: 25.6 µg/m³ Bastia, 12 June: 25.7 µg/m³ Bastia, 13 June: 24.4 µg/m³ Bastia, 14 June: 27.1 µg/m³, 3.6× its usual 7.6 Bastia, 15 June: 18.5 µg/m³ Bastia, 16 June: 15.2 µg/m³ Bastia, 17 June: 6.5 µg/m³ Bastia, 18 June: 7.7 µg/m³ Bastia, 19 June: 10.4 µg/m³ Monaco Monaco, 10 June: no reading Monaco, 11 June: 28.0 µg/m³ Monaco, 12 June: no reading Monaco, 13 June: no reading Monaco, 14 June: 27.0 µg/m³, 2.8× its usual 9.5 Monaco, 15 June: no reading Monaco, 16 June: no reading Monaco, 17 June: no reading Monaco, 18 June: 9.2 µg/m³ Monaco, 19 June: no reading Menton Menton, 10 June: no reading Menton, 11 June: 28.0 µg/m³ Menton, 12 June: no reading Menton, 13 June: no reading Menton, 14 June: 27.0 µg/m³, 2.8× its usual 9.5 Menton, 15 June: no reading Menton, 16 June: no reading Menton, 17 June: no reading Menton, 18 June: 9.2 µg/m³ Menton, 19 June: no reading Contes Contes, 10 June: 30.1 µg/m³ Contes, 11 June: 28.6 µg/m³ Contes, 12 June: 27.9 µg/m³ Contes, 13 June: 27.3 µg/m³ Contes, 14 June: 26.9 µg/m³, 3.2× its usual 8.5 Contes, 15 June: 23.0 µg/m³ Contes, 16 June: 18.5 µg/m³ Contes, 17 June: 12.7 µg/m³ Contes, 18 June: 9.1 µg/m³ Contes, 19 June: 12.2 µg/m³ Savona Savona, 10 June: 24.1 µg/m³ Savona, 11 June: 26.1 µg/m³ Savona, 12 June: 21.0 µg/m³ Savona, 13 June: 24.6 µg/m³ Savona, 14 June: 26.8 µg/m³, 2.6× its usual 10.2 Savona, 15 June: 21.7 µg/m³ Savona, 16 June: 16.2 µg/m³ Savona, 17 June: 9.0 µg/m³ Savona, 18 June: 12.8 µg/m³ Savona, 19 June: 12.0 µg/m³ Lugano Lugano, 10 June: 24.0 µg/m³ Lugano, 11 June: 23.3 µg/m³ Lugano, 12 June: 26.2 µg/m³ Lugano, 13 June: no reading Lugano, 14 June: 26.1 µg/m³, 3.7× its usual 7.0 Lugano, 15 June: no reading Lugano, 16 June: no reading Lugano, 17 June: no reading Lugano, 18 June: 8.5 µg/m³ Lugano, 19 June: no reading Biella Biella, 10 June: 16.4 µg/m³ Biella, 11 June: 17.5 µg/m³ Biella, 12 June: no reading Biella, 13 June: no reading Biella, 14 June: 26.1 µg/m³, 2.7× its usual 9.5 Biella, 15 June: no reading Biella, 16 June: no reading Biella, 17 June: no reading Biella, 18 June: no reading Biella, 19 June: no reading Bolzano Bolzano, 10 June: 18.6 µg/m³ Bolzano, 11 June: 24.4 µg/m³ Bolzano, 12 June: 25.0 µg/m³ Bolzano, 13 June: no reading Bolzano, 14 June: 25.9 µg/m³, 2.8× its usual 9.1 Bolzano, 15 June: no reading Bolzano, 16 June: no reading Bolzano, 17 June: no reading Bolzano, 18 June: 10.5 µg/m³ Bolzano, 19 June: no reading Romans-sur-Isère Romans-sur-Isère, 10 June: 28.3 µg/m³ Romans-sur-Isère, 11 June: 45.9 µg/m³ Romans-sur-Isère, 12 June: 32.5 µg/m³ Romans-sur-Isère, 13 June: 24.7 µg/m³ Romans-sur-Isère, 14 June: 25.7 µg/m³, 3.2× its usual 8.1 Romans-sur-Isère, 15 June: 13.6 µg/m³ Romans-sur-Isère, 16 June: 6.2 µg/m³ Romans-sur-Isère, 17 June: 9.0 µg/m³ Romans-sur-Isère, 18 June: 9.8 µg/m³ Romans-sur-Isère, 19 June: 12.9 µg/m³ Capannori Capannori, 10 June: no reading Capannori, 11 June: no reading Capannori, 12 June: no reading Capannori, 13 June: no reading Capannori, 14 June: 25.3 µg/m³, 2.7× its usual 9.3 Capannori, 15 June: no reading Capannori, 16 June: no reading Capannori, 17 June: no reading Capannori, 18 June: no reading Capannori, 19 June: no reading Bellegarde-sur-Vals… Bellegarde-sur-Valserine, 10 June: 38.3 µg/m³ Bellegarde-sur-Valserine, 11 June: 55.2 µg/m³ Bellegarde-sur-Valserine, 12 June: 33.8 µg/m³ Bellegarde-sur-Valserine, 13 June: 29.4 µg/m³ Bellegarde-sur-Valserine, 14 June: 25.1 µg/m³, 3.3× its usual 7.6 Bellegarde-sur-Valserine, 15 June: 14.0 µg/m³ Bellegarde-sur-Valserine, 16 June: 5.4 µg/m³ Bellegarde-sur-Valserine, 17 June: 9.6 µg/m³ Bellegarde-sur-Valserine, 18 June: 10.3 µg/m³ Bellegarde-sur-Valserine, 19 June: 14.1 µg/m³ 10 Jun 11 12 13 14 15 16 17 18 19 Every counted city, in the order the episode reached them, 3 days before to 3 after. Each square is a day, coloured by that day's PM2.5; outlined: at twice the city's usual or more. Good 0–50
Moderate 51–100
Unhealthy for sensitive groups 101–150
Unhealthy 151–200
Very unhealthy 201–300
Hazardous 301+
Every city it reached
City Days Highest Usual Above usual
Bellinzona Ticino, Switzerland 1 14 June 7.6 3.9× Giubiasco Ticino, Switzerland 1 14 June 7.7 3.8× Mortara Lombardy, Italy 1 14 June 11.1 3.7× Lugano Ticino, Switzerland 1 14 June 7.0 3.7× Vigevano Lombardy, Italy 1 14 June 11.6 3.6× Valence Auvergne-Rhône-Alpes, France 1 14 June 7.6 3.6× Bastia Corsica, France 1 14 June 7.6 3.6× Casamassima Apulia, Italy 1 13 June 10.1 3.5× Santa Maria A Vico Campania, Italy 4 13 June 10.4 3.4× Cannes Provence-Alpes-Côte d'Azur, France 1 14 June 8.5 3.4× Genoa Liguria, Italy 1 14 June 9.1 3.3× Bellegarde-sur-Valserine Auvergne-Rhône-Alpes, France 1 14 June 7.6 3.3× Nice Provence-Alpes-Côte d'Azur, France 1 14 June 9.2 3.2× Contes Provence-Alpes-Côte d'Azur, France 1 14 June 8.5 3.2× Romans-sur-Isère Auvergne-Rhône-Alpes, France 1 14 June 8.1 3.2× Pavia Lombardy, Italy 1 14 June 12.1 3.1× Naples Campania, Italy 3 13 June 10.5 3.1× Milan Lombardy, Italy 1 14 June 10.5 3.1× Caserta Campania, Italy 4 13 June 9.9 3.1× Turin Piedmont, Italy 1 14 June 9.3 3.1× Novara Piedmont, Italy 1 14 June 12.2 3.0× Marigliano Campania, Italy 4 13 June 11.6 3.0× Acerra Campania, Italy 4 13 June 10.5 3.0× Nocera Inferiore Campania, Italy 4 13 June 10.2 3.0× Borgomanero Piedmont, Italy 1 14 June 10.1 3.0× Como Lombardy, Italy 1 14 June 9.7 3.0× Cava Dè Tirreni Campania, Italy 2 14 June 9.7 3.0× Foggia Apulia, Italy 1 13 June 9.4 2.9× Crescentino Piedmont, Italy 1 14 June 12.9 2.8× Falconara Marittima The Marches, Italy 1 13 June 12.5 2.8× Monaco Municipality of Monaco, Monaco 1 14 June 9.5 2.8× Menton Provence-Alpes-Côte d'Azur, France 1 14 June 9.5 2.8× Bolzano Trentino-Alto Adige, Italy 1 14 June 9.1 2.8× Nichelino Piedmont, Italy 1 14 June 12.6 2.7× Bra Piedmont, Italy 1 14 June 11.8 2.7× Andria Apulia, Italy 2 13 June 11.0 2.7× Biella Piedmont, Italy 1 14 June 9.5 2.7× Capannori Tuscany, Italy 1 14 June 9.3 2.7× Vinovo Piedmont, Italy 1 14 June 12.7 2.6× Jesi The Marches, Italy 3 13 June 11.6 2.6× Vercelli Piedmont, Italy 1 14 June 11.6 2.6× Rovereto Trentino-Alto Adige, Italy 1 14 June 11.5 2.6× Porto Potenza Picena The Marches, Italy 1 13 June 10.6 2.6× Savona Liguria, Italy 1 14 June 10.2 2.6× Trento Trentino-Alto Adige, Italy 1 14 June 11.6 2.5× Chiaravalle The Marches, Italy 2 13 June 13.6 2.3× Alessandria Piedmont, Italy 1 14 June 13.1 2.1×
Daily means in µg/m³, over the days each city counted in this episode. Highest: its highest of those days. Usual: the city's median for the time of year of that day (its days within 21 days of the date, every year, leaving out the week either side of it). Above usual: its highest day against that, with a usual under 5 µg/m³ taken as 5.
Compared with other episodes in Italy and France
Number 14 of 54 episodes in Italy and France since our records began, by cities reached.
Europe, February and March 2023 354 Europe, December 2025 to January 2026 231 Europe, January 2023 162 Western and southern Europe, January 2024 160 Southern Europe, June 2025 151 Europe, December 2024 108 Spain, France and Portugal, February 2023 87 France, Belgium and 2 more countries, January 2023 79 Western Europe, November and December 2023 59 Southern Europe, 4 to 7 February 2024 56 Western Europe, March 2025 53 France, Belgium and Germany, April 2023 51 Italy, France and 2 more countries, June 2025 47 Bars: cities reached; colour: the level of the episode's highest daily reading. All 54 .
Use this page SmogRank, Italy, France and 2 more countries, June 2025: 47 cities with PM2.5 at twice their usual or more, 13 to 16 June 2025, smogrank.com/episodes/2025-06-italy-france-and-2-more-countries (accessed 19 November 2026).
Share Copy citation Download top 10 (PNG)
You're welcome to reuse a single chart, image or figure with this citation and a link. Terms .
An episode is a run of days when many cities close to each other (four or more within 350 km on a day, 8 or more in all) each had a daily PM2.5 mean of at least 25 µg/m³ and at least 2 times their usual for that time of year. Found in our own measurements, not picked by hand. How we find episodes . Values are each city's daily mean of its own monitors; causes are the usual kinds for a pattern like this, not a confirmed source. Fire detections from NASA FIRMS; smoke maps from NOAA HMS. Dust: contains modified Copernicus Atmosphere Monitoring Service information 2025. Neither the European Commission nor ECMWF is responsible for any use that may be made of the Copernicus information or data it contains.