SmogRank / Episodes / United States
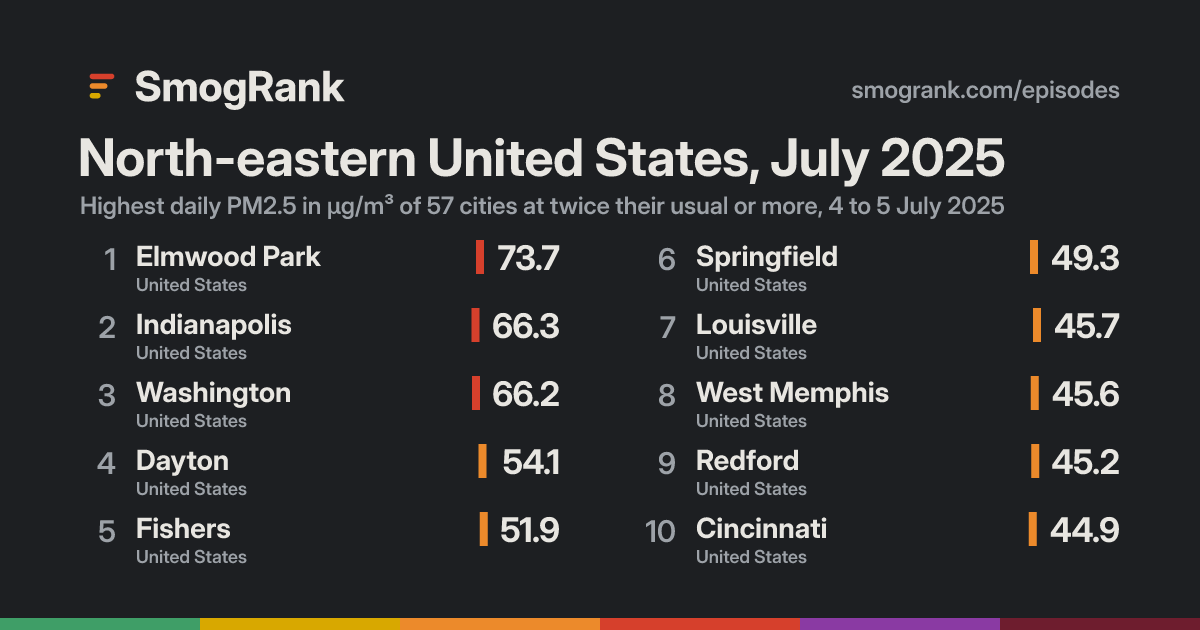
North-eastern United States, July 2025
For 2 days, from 4 to 5 July 2025, 57 cities in the United States had PM2.5 at least twice their usual for the time of year. The worst reading was Elmwood Park, Illinois, United States: 73.7 µg/m³ on 4 July, about 7.2× its usual 10.3.
Day by day
How it spread
Every city it reached
| City | Days | Highest | Above usual |
|---|---|---|---|
| Elmwood ParkIllinois, United States | 1 | 73.74 July | 7.2× |
| WashingtonDistrict of Columbia, United States | 2 | 66.25 July | 7.1× |
| UticaNew York, United States | 1 | 35.94 July | 6.6× |
| White OakOhio, United States | 1 | 43.55 July | 6.3× |
| IndianapolisIndiana, United States | 2 | 66.35 July | 6.1× |
| SpringfieldVirginia, United States | 2 | 49.35 July | 6.0× |
| DaytonOhio, United States | 1 | 54.15 July | 5.5× |
| ClarksvilleTennessee, United States | 2 | 40.64 July | 5.2× |
| HolbrookNew York, United States | 1 | 33.75 July | 5.1× |
| LouisvilleKentucky, United States | 1 | 45.75 July | 4.9× |
| FishersIndiana, United States | 2 | 51.95 July | 4.8× |
| New AlbanyIndiana, United States | 1 | 36.15 July | 4.7× |
| AshburnVirginia, United States | 2 | 36.54 July | 4.6× |
| West MemphisArkansas, United States | 1 | 45.65 July | 4.6× |
| RedfordMichigan, United States | 1 | 45.25 July | 4.5× |
| Hunt ValleyMaryland, United States | 1 | 32.64 July | 4.5× |
| Oxon Hill-GlassmanorMaryland, United States | 2 | 32.75 July | 4.4× |
| JacksonTennessee, United States | 2 | 38.85 July | 4.4× |
| ArnoldMissouri, United States | 2 | 33.24 July | 4.3× |
| CincinnatiOhio, United States | 2 | 44.95 July | 4.2× |
| WarrenOhio, United States | 2 | 40.64 July | 4.0× |
| LindenNew Jersey, United States | 1 | 36.34 July | 4.0× |
| JeffersonvilleIndiana, United States | 1 | 33.75 July | 3.9× |
| NashvilleTennessee, United States | 1 | 29.35 July | 3.8× |
| PerrysburgOhio, United States | 1 | 38.65 July | 3.7× |
| AltoonaPennsylvania, United States | 1 | 29.75 July | 3.7× |
| AllentownPennsylvania, United States | 1 | 29.85 July | 3.6× |
| SouthfieldMichigan, United States | 1 | 28.65 July | 3.6× |
| Fort WayneIndiana, United States | 1 | 27.95 July | 3.5× |
| HuntsvilleAlabama, United States | 1 | 26.25 July | 3.5× |
| BuffaloNew York, United States | 2 | 30.65 July | 3.5× |
| NorwoodOhio, United States | 2 | 38.25 July | 3.5× |
| EssexMaryland, United States | 1 | 26.24 July | 3.4× |
| MiddletownOhio, United States | 2 | 38.64 July | 3.4× |
| Rose HillVirginia, United States | 1 | 26.85 July | 3.4× |
| MuncieIndiana, United States | 1 | 30.25 July | 3.3× |
| East Saint LouisIllinois, United States | 1 | 33.84 July | 3.3× |
| Saint MatthewsKentucky, United States | 1 | 27.05 July | 3.2× |
| YoungstownOhio, United States | 2 | 27.65 July | 3.2× |
| PennsaukenNew Jersey, United States | 1 | 28.25 July | 3.1× |
| EvansvilleIndiana, United States | 1 | 28.65 July | 3.0× |
| WestervilleOhio, United States | 1 | 31.85 July | 3.0× |
| Terre HauteIndiana, United States | 1 | 32.05 July | 3.0× |
| PittsburghPennsylvania, United States | 1 | 28.75 July | 3.0× |
| JeffersontownKentucky, United States | 1 | 25.95 July | 3.0× |
| Upper AltonIllinois, United States | 1 | 25.45 July | 3.0× |
| PortageIndiana, United States | 1 | 27.44 July | 2.9× |
| WilkinsburgPennsylvania, United States | 1 | 25.55 July | 2.7× |
| West MifflinPennsylvania, United States | 2 | 30.65 July | 2.7× |
| CantonOhio, United States | 1 | 27.84 July | 2.6× |
| BridgeviewIllinois, United States | 1 | 27.24 July | 2.6× |
| SpringfieldOhio, United States | 1 | 26.05 July | 2.6× |
| ElkhartIndiana, United States | 1 | 25.64 July | 2.6× |
| East RidgeTennessee, United States | 1 | 25.35 July | 2.5× |
| SteubenvilleOhio, United States | 1 | 25.35 July | 2.5× |
| ClevelandOhio, United States | 1 | 25.84 July | 2.5× |
| Wake ForestNorth Carolina, United States | 2 | 27.54 July | 2.3× |
Daily means in µg/m³. Usual: the city's median for this time of year (its days within 21 days of the date, every year, leaving out the week around it). Above usual: its highest day against that.
Against other episodes in the United States
Number 17 of 98 episodes in the United States since our records began, by cities reached.
- North-eastern United States and Canada, June and July 2023279
- North-eastern United States and Canada, July 2026264
- North-eastern United States and Canada, May and June 2023260
- North-eastern United States and Canada, July and August 2025241
- North-eastern United States and Canada, July 2023241
- North-eastern United States and Canada, June 2025196
- North-eastern United States and Canada, June 2023161
- North-eastern United States and Canada, July 2025119
- North-western United States and Canada, August 2023110
- North-eastern United States, June 2025104
- North-western United States and Canada, August 202699
- North-eastern United States and Canada, February 202696
- North-eastern United States, July 202557
Bars: cities reached; colour: the level of the episode's highest daily reading. All 98.
Use this page
SmogRank, North-eastern United States, July 2025: 57 cities with PM2.5 at twice their usual or more, 4 to 5 July 2025, smogrank.com/episodes/2025-07-north-eastern-united-states (accessed 2 October 2026).
You're welcome to reuse a single chart, image or figure with this citation and a link. Terms.
An episode is a run of days when many cities close to each other (four or more within 350 km on a day, 8 or more in all) each had a daily PM2.5 mean of at least 25 µg/m³ and at least 2 times their usual for that time of year. Found in our own measurements, not picked by hand. How we find episodes. Values are each city's daily mean of its own monitors; causes are the usual kinds for a pattern like this, not a confirmed source.