SmogRank / Episodes / Poland
Eastern Europe, 27 to 30 October 2026
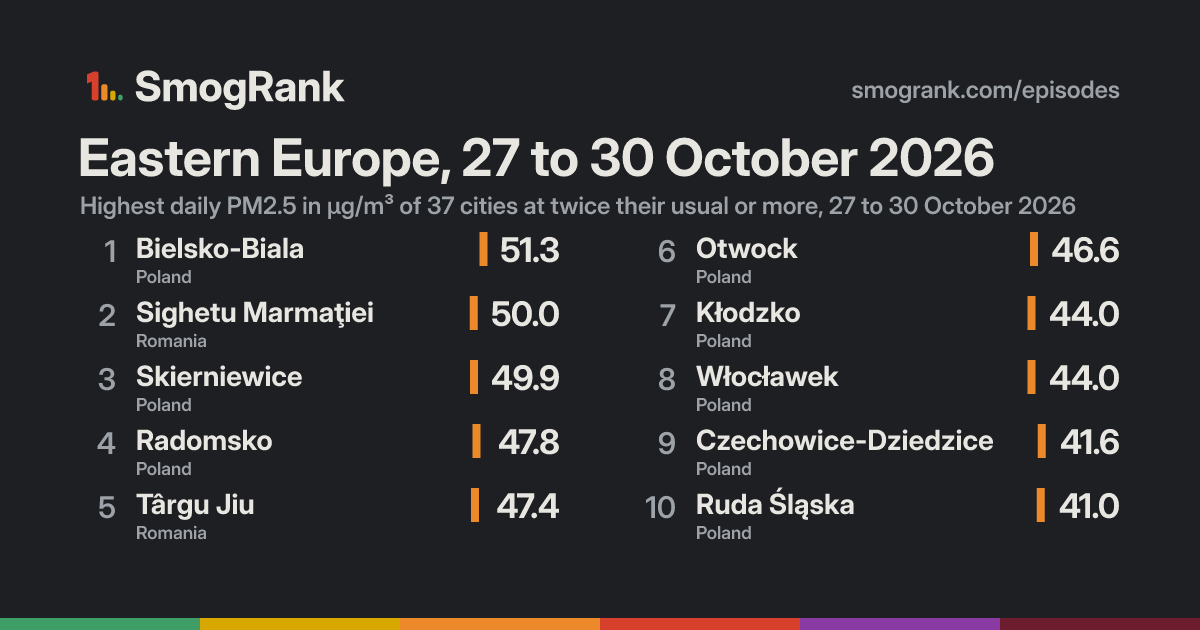
For 4 days, from 27 to 30 October 2026, 37 cities in Poland, Czechia, Romania and 4 more countries had PM2.5 at least twice their usual for the time of year. The worst reading was Bielsko-Biala, Silesia, Poland: 51.3 µg/m³ on 29 October, about 2.9× its usual 17.4. Ended 30 October.
Few fires were detected near these cities on those days. Spreads like this usually come from still weather trapping smoke from heating, traffic and industry, or from dust.
Cities reached 37 in 7 countries
Days 4 27 to 30 October 2026
Worst day 29 October 24 cities counted
Furthest above usual 3.6× Skierniewice
Day by day
Play 29 October 24 cities at twice their usual or more
Krompachy Košice Prešov Čaňa Bardejov Vranov nad Topľou Trebišov Kazincbarcika Miskolc Veľká Lomnica Poprad Humenné Revúca Snina Hnúšťa Krosno Dębica Debrecen Liptovský Mikuláš Lučenec Gyöngyös Bieńczyce Połaniec Skawina Ružomberok Banská Bystrica Zvolen Przemyśl Nisko Żywiec Kielce Martin Vác Fót Žiar nad Hronom Oświęcim Šahy Dunakeszi Jaworzno Handlová Gyál Žilina Mysłowice Žarnovica Budapest Dąbrowa Górnicza Prievidza Dunaharaszti Ustroń Tychy Budaörs Katowice Esztergom Zalău Érd Radom Bytom Partizánske Szeged Zabrze Jastrzębie Zdrój Tarnowskie Góry Púchov Baia Mare Częstochowa Knurów Havířov Dunaújváros Gliwice Frýdek-Místek Lublin Zamość Ostrava Nitra Trenčín Kikinda Subotica Timişoara Komárno Racibórz Studénka Valašské Meziříčí Kolárovo Kędzierzyn-Koźle Cluj-Napoca Dej Piaseczno Konstancin-Jeziorna Żyrardów Grodzisk Mazowiecki Milanówek Ursynów Sereď Łódź Wawer Zlín Mińsk Mazowiecki Warsaw Wesoła Zgierz Zrenjanin Trnava Bielany Białołeka Łomianki Wołomin Kluczbork Veszprém Győr Nowy Dwór Mazowiecki Senica Kroměříž Senec Liberpolis Novi Sad Futog Pezinok Chorvátsky Grob - Čierna Voda Inđija Olomouc Hodonín Pécs Pančevo Bratislava Starčevo Belgrade Malacky Vinča Surčin Sremska Mitrovica Ciechanów Smederevo Brzeg Hainburg an der Donau Târgu Mureş Kalisz Ripanj Obrenovac Šabac Slatina Oleśnica Mikulov Rovinari Brno Lazarevac Moravská Třebová Groß-Enzersdorf Psie Pole Zawidawie Eisenstadt Loznica Wrocław Krzyki-Partynice Valjevo Gądów-Popowice Południowe Vienna Klosterneuburg Kragujevac Negotin Gornji Milanovac Mödling Jagodina Bor Perchtoldsdorf Inowrocław Toruń Szczytna Tuzla Baden Wiener Neustadt Paraćin Čačak Koprivnica Znojmo Olsztyn Ostróda Tulln Eisenzicken Zaječar Užice Kraljevo Srbac Solec Kujawski Arilje Calafat Žďár nad Sázavou Strzegom Trstenik Fordon Kruševac Craiova Suceava Murska Sobota Knjazevac Swarzędz Hradec Králové Kutina Pardubice Sankt Pölten Luboń Poznań Piteşti Jihlava Braşov Niš Nakło nad Notecią Banja Luka Prokuplje Elbląg Piatra Neamţ Wschowa Suwałki Sarajevo Weiz Novi Pazar Pljevlja Ptuj Jelenia Góra Starogard Gdański Prijedor Pirot Maribor Leskovac Leibnitz Graz Zagreb Bijelo Polje Berkovitsa Jičín Bruck an der Mur Gdańsk Kościerzyna Voitsberg Sopot Osowa Amstetten Gdynia Vranje Liberec Celje Rumia Mladá Boleslav Zielona Góra Nikšić Chrastava Pleven Bogatynia Buftea Sofia Pernik Trbovlje Baloteşti Żary Otopeni Novo Mesto Podgorica Zagorje ob Savi Bragadiru Trebinje Bucharest Voluntari Kumanovo Kyustendil Jilava Kaunas Lovech Popeşti-Leordeni Tetovo Skopje Cernica Ilinden Dupnitsa Ruse Kostel Bar Gorzów Wielkopolski Sevlievo Blagoevgrad Gabrovo Veliko Tŭrnovo Gorna Oryahovitsa Biograd na Moru Kazanlak Plovdiv Kołobrzeg Asenovgrad Stara Zagora Sliven Dimitrovgrad Oščadnica Wodzisław Śląski Płock Jarosław Přerov Codlea Starachowice Ruda Śląska Sighetu Marmaţiei Tarnów Karviná Opole Rzeszów Legionowo Pruszków Włocławek Botevgrad Białystok Kraków Jasło Târgu Jiu Vršac Bydgoszcz Otwock Hranice Czechowice-Dziedzice Kłodzko Třinec Mielec Vratsa Svishtov Bielsko-Biala Cieszyn Radomsko Vilnius Ełk Skierniewice On the map: 4 fire detections.
24 Oct 25 26 27 28 29 30 31 1 Nov 2 Every measured city in the area, coloured by its PM2.5 that day; a dark ring marks a city at twice its usual or more. Bars: cities counted each day, coloured by their median level. Choose a day or press play; without JavaScript, the days link to that day's world ranking. Fires, seen Heat satellites detected that day (via NASA FIRMS); bigger and glowing means more detections in the area. Farm burning and other fires count too, not only wildfires.Volcanic ash, warned A volcano with an ash warning for aircraft that day; shaded where forecasters saw the ash cloud.Under the cities, for each UTC day: fires satellites detected (via NASA FIRMS), smoke NOAA analysts traced and volcanic ash warnings for aircraft. They show what was in the air, not that it caused the readings.
Fires: NASA FIRMS (VIIRS). Traced smoke: NOAA Hazard Mapping System. Volcanic ash: aviation ash warnings (SIGMETs) via NOAA's Aviation Weather Center.
How it spread
Otwock Otwock, 24 October: 18.9 µg/m³ Otwock, 25 October: 24.9 µg/m³ Otwock, 26 October: 22.7 µg/m³ Otwock, 27 October: 46.6 µg/m³, 2.5× its usual 18.7 Otwock, 28 October: 45.9 µg/m³, 2.5× its usual 18.6 Otwock, 29 October: 31.6 µg/m³ Otwock, 30 October: 24.8 µg/m³ Otwock, 31 October: 16.3 µg/m³ Otwock, 1 November: 20.5 µg/m³ Otwock, 2 November: 23.3 µg/m³ Radomsko Radomsko, 24 October: 14.1 µg/m³ Radomsko, 25 October: 14.6 µg/m³ Radomsko, 26 October: 19.0 µg/m³ Radomsko, 27 October: 45.8 µg/m³, 2.8× its usual 16.1 Radomsko, 28 October: 35.6 µg/m³, 2.2× its usual 16.1 Radomsko, 29 October: 47.8 µg/m³, 3.0× its usual 15.8 Radomsko, 30 October: 30.8 µg/m³ Radomsko, 31 October: 19.7 µg/m³ Radomsko, 1 November: 19.4 µg/m³ Radomsko, 2 November: 27.6 µg/m³ Mielec Mielec, 24 October: 18.4 µg/m³ Mielec, 25 October: 22.7 µg/m³ Mielec, 26 October: 12.5 µg/m³ Mielec, 27 October: 38.2 µg/m³, 2.7× its usual 13.9 Mielec, 28 October: 26.2 µg/m³ Mielec, 29 October: 32.8 µg/m³, 2.4× its usual 13.9 Mielec, 30 October: 16.0 µg/m³ Mielec, 31 October: 13.0 µg/m³ Mielec, 1 November: 13.0 µg/m³ Mielec, 2 November: 21.3 µg/m³ Ełk Ełk, 24 October: 13.8 µg/m³ Ełk, 25 October: 18.1 µg/m³ Ełk, 26 October: 11.2 µg/m³ Ełk, 27 October: 36.8 µg/m³, 3.3× its usual 11.2 Ełk, 28 October: 24.7 µg/m³ Ełk, 29 October: 17.2 µg/m³ Ełk, 30 October: 9.6 µg/m³ Ełk, 31 October: 3.7 µg/m³ Ełk, 1 November: 7.4 µg/m³ Ełk, 2 November: 12.3 µg/m³ Starachowice Starachowice, 24 October: 16.0 µg/m³ Starachowice, 25 October: 16.4 µg/m³ Starachowice, 26 October: 12.8 µg/m³ Starachowice, 27 October: 34.1 µg/m³, 2.1× its usual 16.2 Starachowice, 28 October: 23.6 µg/m³ Starachowice, 29 October: 23.9 µg/m³ Starachowice, 30 October: 14.7 µg/m³ Starachowice, 31 October: 10.7 µg/m³ Starachowice, 1 November: 12.6 µg/m³ Starachowice, 2 November: 19.3 µg/m³ Pruszków Pruszków, 24 October: no reading Pruszków, 25 October: 18.7 µg/m³ Pruszków, 26 October: 22.6 µg/m³ Pruszków, 27 October: 32.7 µg/m³, 2.1× its usual 15.9 Pruszków, 28 October: 29.4 µg/m³ Pruszków, 29 October: 35.3 µg/m³, 2.2× its usual 16.1 Pruszków, 30 October: 28.7 µg/m³ Pruszków, 31 October: 13.4 µg/m³ Pruszków, 1 November: 15.2 µg/m³ Pruszków, 2 November: 14.1 µg/m³ Białystok Białystok, 24 October: 11.9 µg/m³ Białystok, 25 October: 13.4 µg/m³ Białystok, 26 October: 14.6 µg/m³ Białystok, 27 October: 28.7 µg/m³, 2.3× its usual 12.4 Białystok, 28 October: 21.6 µg/m³ Białystok, 29 October: 29.2 µg/m³, 2.3× its usual 12.5 Białystok, 30 October: 14.9 µg/m³ Białystok, 31 October: 6.6 µg/m³ Białystok, 1 November: 11.3 µg/m³ Białystok, 2 November: 15.6 µg/m³ Opole Opole, 24 October: 10.2 µg/m³ Opole, 25 October: 9.3 µg/m³ Opole, 26 October: 9.0 µg/m³ Opole, 27 October: 28.5 µg/m³, 2.2× its usual 13.0 Opole, 28 October: 25.0 µg/m³ Opole, 29 October: 18.5 µg/m³ Opole, 30 October: 14.1 µg/m³ Opole, 31 October: 9.7 µg/m³ Opole, 1 November: 11.4 µg/m³ Opole, 2 November: 17.8 µg/m³ Kłodzko Kłodzko, 24 October: 7.7 µg/m³ Kłodzko, 25 October: 4.3 µg/m³ Kłodzko, 26 October: 12.1 µg/m³ Kłodzko, 27 October: 32.6 µg/m³ Kłodzko, 28 October: 44.0 µg/m³, 2.6× its usual 17.0 Kłodzko, 29 October: 32.5 µg/m³ Kłodzko, 30 October: 40.1 µg/m³ Kłodzko, 31 October: 11.1 µg/m³ Kłodzko, 1 November: 9.8 µg/m³ Kłodzko, 2 November: 19.1 µg/m³ Włocławek Włocławek, 24 October: no reading Włocławek, 25 October: no reading Włocławek, 26 October: no reading Włocławek, 27 October: no reading Włocławek, 28 October: 42.6 µg/m³, 2.1× its usual 20.1 Włocławek, 29 October: 44.0 µg/m³, 2.2× its usual 20.1 Włocławek, 30 October: 29.3 µg/m³ Włocławek, 31 October: 11.6 µg/m³ Włocławek, 1 November: 10.7 µg/m³ Włocławek, 2 November: 21.0 µg/m³ Czechowice-Dziedzice Czechowice-Dziedzice, 24 October: 11.7 µg/m³ Czechowice-Dziedzice, 25 October: 9.8 µg/m³ Czechowice-Dziedzice, 26 October: 9.0 µg/m³ Czechowice-Dziedzice, 27 October: 27.7 µg/m³ Czechowice-Dziedzice, 28 October: 36.5 µg/m³, 2.3× its usual 15.7 Czechowice-Dziedzice, 29 October: 41.6 µg/m³, 2.6× its usual 15.7 Czechowice-Dziedzice, 30 October: 18.9 µg/m³ Czechowice-Dziedzice, 31 October: 16.8 µg/m³ Czechowice-Dziedzice, 1 November: 11.2 µg/m³ Czechowice-Dziedzice, 2 November: 19.6 µg/m³ Bydgoszcz Bydgoszcz, 24 October: 10.1 µg/m³ Bydgoszcz, 25 October: 9.3 µg/m³ Bydgoszcz, 26 October: 11.6 µg/m³ Bydgoszcz, 27 October: 22.1 µg/m³ Bydgoszcz, 28 October: 36.2 µg/m³, 2.5× its usual 14.5 Bydgoszcz, 29 October: 25.4 µg/m³ Bydgoszcz, 30 October: 17.0 µg/m³ Bydgoszcz, 31 October: 9.5 µg/m³ Bydgoszcz, 1 November: 11.6 µg/m³ Bydgoszcz, 2 November: 31.5 µg/m³ Bielsko-Biala Bielsko-Biala, 24 October: 9.7 µg/m³ Bielsko-Biala, 25 October: 12.9 µg/m³ Bielsko-Biala, 26 October: 13.7 µg/m³ Bielsko-Biala, 27 October: 27.2 µg/m³ Bielsko-Biala, 28 October: 35.4 µg/m³, 2.0× its usual 17.5 Bielsko-Biala, 29 October: 51.3 µg/m³, 2.9× its usual 17.4 Bielsko-Biala, 30 October: 25.6 µg/m³ Bielsko-Biala, 31 October: 22.0 µg/m³ Bielsko-Biala, 1 November: 14.3 µg/m³ Bielsko-Biala, 2 November: 23.7 µg/m³ Legionowo Legionowo, 24 October: 15.7 µg/m³ Legionowo, 25 October: 18.6 µg/m³ Legionowo, 26 October: 10.3 µg/m³ Legionowo, 27 October: 28.8 µg/m³ Legionowo, 28 October: 33.7 µg/m³, 2.2× its usual 15.4 Legionowo, 29 October: 26.9 µg/m³ Legionowo, 30 October: 22.1 µg/m³ Legionowo, 31 October: 10.1 µg/m³ Legionowo, 1 November: 14.3 µg/m³ Legionowo, 2 November: 14.4 µg/m³ Jasło Jasło, 24 October: 10.1 µg/m³ Jasło, 25 October: 18.4 µg/m³ Jasło, 26 October: 10.3 µg/m³ Jasło, 27 October: 22.4 µg/m³ Jasło, 28 October: 29.4 µg/m³, 2.4× its usual 12.4 Jasło, 29 October: 25.4 µg/m³, 2.1× its usual 12.3 Jasło, 30 October: 16.1 µg/m³ Jasło, 31 October: 10.5 µg/m³ Jasło, 1 November: 9.6 µg/m³ Jasło, 2 November: 17.8 µg/m³ Hranice Hranice, 24 October: 8.4 µg/m³ Hranice, 25 October: 7.8 µg/m³ Hranice, 26 October: 7.2 µg/m³ Hranice, 27 October: 18.9 µg/m³ Hranice, 28 October: 29.1 µg/m³, 2.6× its usual 11.4 Hranice, 29 October: 15.2 µg/m³ Hranice, 30 October: 10.0 µg/m³ Hranice, 31 October: 5.1 µg/m³ Hranice, 1 November: 7.4 µg/m³ Hranice, 2 November: 12.5 µg/m³ Přerov Přerov, 24 October: 8.6 µg/m³ Přerov, 25 October: 8.0 µg/m³ Přerov, 26 October: 8.4 µg/m³ Přerov, 27 October: 19.0 µg/m³ Přerov, 28 October: 26.0 µg/m³, 2.1× its usual 12.5 Přerov, 29 October: 17.6 µg/m³ Přerov, 30 October: 7.5 µg/m³ Přerov, 31 October: 4.3 µg/m³ Přerov, 1 November: 6.7 µg/m³ Přerov, 2 November: 11.0 µg/m³ Sighetu Marmaţiei Sighetu Marmaţiei, 24 October: 21.6 µg/m³ Sighetu Marmaţiei, 25 October: 25.1 µg/m³ Sighetu Marmaţiei, 26 October: 35.1 µg/m³ Sighetu Marmaţiei, 27 October: 27.1 µg/m³ Sighetu Marmaţiei, 28 October: 37.9 µg/m³ Sighetu Marmaţiei, 29 October: 50.0 µg/m³, 2.1× its usual 23.3 Sighetu Marmaţiei, 30 October: 43.7 µg/m³ Sighetu Marmaţiei, 31 October: 29.7 µg/m³ Sighetu Marmaţiei, 1 November: 16.4 µg/m³ Sighetu Marmaţiei, 2 November: 23.6 µg/m³ Skierniewice Skierniewice, 24 October: 14.1 µg/m³ Skierniewice, 25 October: 12.2 µg/m³ Skierniewice, 26 October: 8.4 µg/m³ Skierniewice, 27 October: 24.1 µg/m³ Skierniewice, 28 October: 21.2 µg/m³ Skierniewice, 29 October: 49.9 µg/m³, 3.6× its usual 13.7 Skierniewice, 30 October: 29.3 µg/m³ Skierniewice, 31 October: 14.4 µg/m³ Skierniewice, 1 November: no reading Skierniewice, 2 November: no reading Târgu Jiu Târgu Jiu, 24 October: 13.9 µg/m³ Târgu Jiu, 25 October: 23.9 µg/m³ Târgu Jiu, 26 October: 26.5 µg/m³ Târgu Jiu, 27 October: 14.9 µg/m³ Târgu Jiu, 28 October: 27.2 µg/m³ Târgu Jiu, 29 October: 47.4 µg/m³, 2.4× its usual 19.7 Târgu Jiu, 30 October: 41.8 µg/m³, 2.3× its usual 18.4 Târgu Jiu, 31 October: 18.1 µg/m³ Târgu Jiu, 1 November: 4.3 µg/m³ Târgu Jiu, 2 November: 8.5 µg/m³ Ruda Śląska Ruda Śląska, 24 October: 10.0 µg/m³ Ruda Śląska, 25 October: 13.1 µg/m³ Ruda Śląska, 26 October: 9.4 µg/m³ Ruda Śląska, 27 October: 17.0 µg/m³ Ruda Śląska, 28 October: 25.3 µg/m³ Ruda Śląska, 29 October: 41.0 µg/m³, 2.1× its usual 19.2 Ruda Śląska, 30 October: 14.5 µg/m³ Ruda Śląska, 31 October: 14.6 µg/m³ Ruda Śląska, 1 November: 13.8 µg/m³ Ruda Śląska, 2 November: 17.1 µg/m³ Kraków Kraków, 24 October: 14.1 µg/m³ Kraków, 25 October: 11.9 µg/m³ Kraków, 26 October: 7.6 µg/m³ Kraków, 27 October: 20.7 µg/m³ Kraków, 28 October: 21.9 µg/m³ Kraków, 29 October: 38.8 µg/m³, 2.3× its usual 16.7 Kraków, 30 October: 15.0 µg/m³ Kraków, 31 October: 13.0 µg/m³ Kraków, 1 November: 9.1 µg/m³ Kraków, 2 November: 18.3 µg/m³ Cieszyn Cieszyn, 24 October: 10.3 µg/m³ Cieszyn, 25 October: 7.6 µg/m³ Cieszyn, 26 October: 7.1 µg/m³ Cieszyn, 27 October: 17.4 µg/m³ Cieszyn, 28 October: 18.8 µg/m³ Cieszyn, 29 October: 36.0 µg/m³, 3.0× its usual 12.1 Cieszyn, 30 October: 12.2 µg/m³ Cieszyn, 31 October: 10.6 µg/m³ Cieszyn, 1 November: 11.5 µg/m³ Cieszyn, 2 November: 16.9 µg/m³ Jarosław Jarosław, 24 October: 24.0 µg/m³ Jarosław, 25 October: 34.5 µg/m³ Jarosław, 26 October: 11.3 µg/m³ Jarosław, 27 October: 21.0 µg/m³ Jarosław, 28 October: 27.4 µg/m³ Jarosław, 29 October: 30.7 µg/m³, 2.0× its usual 15.0 Jarosław, 30 October: 21.2 µg/m³ Jarosław, 31 October: 14.7 µg/m³ Jarosław, 1 November: 13.1 µg/m³ Jarosław, 2 November: 21.5 µg/m³ Rzeszów Rzeszów, 24 October: 16.9 µg/m³ Rzeszów, 25 October: 21.0 µg/m³ Rzeszów, 26 October: 17.7 µg/m³ Rzeszów, 27 October: 27.1 µg/m³ Rzeszów, 28 October: 27.0 µg/m³ Rzeszów, 29 October: 30.4 µg/m³, 2.2× its usual 13.9 Rzeszów, 30 October: 20.2 µg/m³ Rzeszów, 31 October: 12.6 µg/m³ Rzeszów, 1 November: 11.8 µg/m³ Rzeszów, 2 November: 22.6 µg/m³ Codlea Codlea, 24 October: 19.5 µg/m³ Codlea, 25 October: 25.7 µg/m³ Codlea, 26 October: 12.5 µg/m³ Codlea, 27 October: 6.7 µg/m³ Codlea, 28 October: 13.9 µg/m³ Codlea, 29 October: 30.1 µg/m³, 2.1× its usual 14.1 Codlea, 30 October: 20.0 µg/m³ Codlea, 31 October: 16.7 µg/m³ Codlea, 1 November: 7.9 µg/m³ Codlea, 2 November: 8.4 µg/m³ Płock Płock, 24 October: 15.6 µg/m³ Płock, 25 October: 13.4 µg/m³ Płock, 26 October: 11.3 µg/m³ Płock, 27 October: 22.7 µg/m³ Płock, 28 October: 24.8 µg/m³ Płock, 29 October: 29.2 µg/m³, 2.0× its usual 14.6 Płock, 30 October: 21.0 µg/m³ Płock, 31 October: 11.6 µg/m³ Płock, 1 November: 11.5 µg/m³ Płock, 2 November: 15.0 µg/m³ Třinec Třinec, 24 October: 9.7 µg/m³ Třinec, 25 October: 6.7 µg/m³ Třinec, 26 October: 7.7 µg/m³ Třinec, 27 October: 12.1 µg/m³ Třinec, 28 October: 12.3 µg/m³ Třinec, 29 October: 28.3 µg/m³, 2.7× its usual 10.6 Třinec, 30 October: 14.0 µg/m³ Třinec, 31 October: 10.7 µg/m³ Třinec, 1 November: 9.9 µg/m³ Třinec, 2 November: 16.3 µg/m³ Karviná Karviná, 24 October: 7.4 µg/m³ Karviná, 25 October: 6.2 µg/m³ Karviná, 26 October: 7.1 µg/m³ Karviná, 27 October: 19.4 µg/m³ Karviná, 28 October: 20.2 µg/m³ Karviná, 29 October: 27.9 µg/m³, 2.2× its usual 12.7 Karviná, 30 October: 14.1 µg/m³ Karviná, 31 October: 13.7 µg/m³ Karviná, 1 November: 10.1 µg/m³ Karviná, 2 November: 19.3 µg/m³ Wodzisław Śląski Wodzisław Śląski, 24 October: 9.8 µg/m³ Wodzisław Śląski, 25 October: 12.2 µg/m³ Wodzisław Śląski, 26 October: 10.7 µg/m³ Wodzisław Śląski, 27 October: 23.2 µg/m³ Wodzisław Śląski, 28 October: 27.4 µg/m³ Wodzisław Śląski, 29 October: 27.4 µg/m³, 2.0× its usual 13.7 Wodzisław Śląski, 30 October: 14.3 µg/m³ Wodzisław Śląski, 31 October: 12.0 µg/m³ Wodzisław Śląski, 1 November: 12.2 µg/m³ Wodzisław Śląski, 2 November: 16.9 µg/m³ Oščadnica Oščadnica, 24 October: 13.8 µg/m³ Oščadnica, 25 October: 13.8 µg/m³ Oščadnica, 26 October: 7.4 µg/m³ Oščadnica, 27 October: 10.2 µg/m³ Oščadnica, 28 October: 13.6 µg/m³ Oščadnica, 29 October: 26.9 µg/m³, 2.0× its usual 13.3 Oščadnica, 30 October: 11.7 µg/m³ Oščadnica, 31 October: 11.0 µg/m³ Oščadnica, 1 November: 8.6 µg/m³ Oščadnica, 2 November: 12.2 µg/m³ Vilnius Vilnius, 24 October: 9.1 µg/m³ Vilnius, 25 October: 7.4 µg/m³ Vilnius, 26 October: 6.8 µg/m³ Vilnius, 27 October: 11.6 µg/m³ Vilnius, 28 October: 19.3 µg/m³ Vilnius, 29 October: 26.5 µg/m³, 3.2× its usual 8.2 Vilnius, 30 October: 10.0 µg/m³ Vilnius, 31 October: 3.3 µg/m³ Vilnius, 1 November: 7.0 µg/m³ Vilnius, 2 November: 5.9 µg/m³ Tarnów Tarnów, 24 October: 9.7 µg/m³ Tarnów, 25 October: 15.8 µg/m³ Tarnów, 26 October: 6.8 µg/m³ Tarnów, 27 October: 18.7 µg/m³ Tarnów, 28 October: 22.7 µg/m³ Tarnów, 29 October: 26.3 µg/m³, 2.2× its usual 11.9 Tarnów, 30 October: 13.7 µg/m³ Tarnów, 31 October: 10.2 µg/m³ Tarnów, 1 November: 9.2 µg/m³ Tarnów, 2 November: 17.7 µg/m³ Vratsa Vratsa, 24 October: 9.9 µg/m³ Vratsa, 25 October: 22.9 µg/m³ Vratsa, 26 October: 13.5 µg/m³ Vratsa, 27 October: 6.2 µg/m³ Vratsa, 28 October: 13.5 µg/m³ Vratsa, 29 October: 22.1 µg/m³ Vratsa, 30 October: 31.8 µg/m³, 2.8× its usual 11.4 Vratsa, 31 October: 15.9 µg/m³ Vratsa, 1 November: 19.1 µg/m³ Vratsa, 2 November: 5.6 µg/m³ Vršac Vršac, 24 October: 7.2 µg/m³ Vršac, 25 October: 26.5 µg/m³ Vršac, 26 October: 15.6 µg/m³ Vršac, 27 October: 12.4 µg/m³ Vršac, 28 October: 17.4 µg/m³ Vršac, 29 October: 21.4 µg/m³ Vršac, 30 October: 27.1 µg/m³, 2.5× its usual 10.8 Vršac, 31 October: 12.1 µg/m³ Vršac, 1 November: 15.3 µg/m³ Vršac, 2 November: 10.3 µg/m³ Svishtov Svishtov, 24 October: 8.1 µg/m³ Svishtov, 25 October: 23.1 µg/m³ Svishtov, 26 October: 14.8 µg/m³ Svishtov, 27 October: 6.3 µg/m³ Svishtov, 28 October: 10.9 µg/m³ Svishtov, 29 October: 20.6 µg/m³ Svishtov, 30 October: 26.3 µg/m³, 2.9× its usual 9.2 Svishtov, 31 October: 20.3 µg/m³ Svishtov, 1 November: 12.8 µg/m³ Svishtov, 2 November: 9.9 µg/m³ Botevgrad Botevgrad, 24 October: 7.9 µg/m³ Botevgrad, 25 October: no reading Botevgrad, 26 October: no reading Botevgrad, 27 October: no reading Botevgrad, 28 October: 11.2 µg/m³ Botevgrad, 29 October: 22.4 µg/m³ Botevgrad, 30 October: 26.1 µg/m³, 2.3× its usual 11.4 Botevgrad, 31 October: 16.0 µg/m³ Botevgrad, 1 November: 9.3 µg/m³ Botevgrad, 2 November: 4.4 µg/m³ 24 Oct 25 26 27 28 29 30 31 1 Nov 2 Every counted city, in the order the episode reached them, 3 days before to 3 after. Each square is a day, coloured by that day's PM2.5; outlined: at twice the city's usual or more. Good 0–50
Moderate 51–100
Unhealthy for sensitive groups 101–150
Unhealthy 151–200
Very unhealthy 201–300
Hazardous 301+
Every city it reached
City Days Highest Usual Above usual
Skierniewice Łódź Voivodeship, Poland 1 29 October 13.7 3.6× Ełk Warmia-Masuria, Poland 1 27 October 11.2 3.3× Vilnius Vilnius, Lithuania 1 29 October 8.2 3.2× Radomsko Łódź Voivodeship, Poland 3 29 October 15.8 3.0× Cieszyn Silesia, Poland 1 29 October 12.1 3.0× Bielsko-Biala Silesia, Poland 2 29 October 17.4 2.9× Svishtov Veliko Tarnovo, Bulgaria 1 30 October 9.2 2.9× Vratsa Vratsa, Bulgaria 1 30 October 11.4 2.8× Mielec Subcarpathia, Poland 2 27 October 13.9 2.7× Třinec Moravian-Silesian Region, Czechia 1 29 October 10.6 2.7× Kłodzko Lower Silesia, Poland 1 28 October 17.0 2.6× Czechowice-Dziedzice Silesia, Poland 2 29 October 15.7 2.6× Hranice Olomouc Region, Czechia 1 28 October 11.4 2.6× Otwock Mazovia, Poland 2 27 October 18.7 2.5× Bydgoszcz Kujawsko-Pomorskie, Poland 1 28 October 14.5 2.5× Vršac Vojvodina, Serbia 1 30 October 10.8 2.5× Târgu Jiu Gorj County, Romania 2 29 October 19.7 2.4× Jasło Subcarpathia, Poland 2 28 October 12.4 2.4× Kraków Lesser Poland, Poland 1 29 October 16.7 2.3× Białystok Podlasie, Poland 2 29 October 12.5 2.3× Botevgrad Sofia, Bulgaria 1 30 October 11.4 2.3× Włocławek Kujawsko-Pomorskie, Poland 2 29 October 20.1 2.2× Pruszków Mazovia, Poland 2 29 October 16.1 2.2× Legionowo Mazovia, Poland 1 28 October 15.4 2.2× Rzeszów Subcarpathia, Poland 1 29 October 13.9 2.2× Opole Opole Voivodeship, Poland 1 27 October 13.0 2.2× Karviná Moravian-Silesian Region, Czechia 1 29 October 12.7 2.2× Tarnów Lesser Poland, Poland 1 29 October 11.9 2.2× Sighetu Marmaţiei Maramureş, Romania 1 29 October 23.3 2.1× Ruda Śląska Silesia, Poland 1 29 October 19.2 2.1× Starachowice Świętokrzyskie, Poland 1 27 October 16.2 2.1× Codlea Brașov County, Romania 1 29 October 14.1 2.1× Přerov Olomouc Region, Czechia 1 28 October 12.5 2.1× Jarosław Subcarpathia, Poland 1 29 October 15.0 2.0× Płock Mazovia, Poland 1 29 October 14.6 2.0× Wodzisław Śląski Silesia, Poland 1 29 October 13.7 2.0× Oščadnica Žilina Region, Slovakia 1 29 October 13.3 2.0×
Daily means in µg/m³, over the days each city counted in this episode. Highest: its highest of those days. Usual: the city's median for the time of year of that day (its days within 21 days of the date, every year, leaving out the week either side of it). Above usual: its highest day against that, with a usual under 5 µg/m³ taken as 5.
Compared with other episodes in Poland and Czechia
Number 15 of 41 episodes in Poland and Czechia since our records began, by cities reached.
Poland, Czechia and 15 more countries, October 2024 234 Eastern Europe, November and December 2025 129 Eastern Europe, November and December 2023 116 Europe, 5 to 10 November 2025 115 Eastern Europe, November and December 2024 101 Germany, Poland and 2 more countries, February 2026 89 Europe, 21 to 25 November 2025 89 Europe, March 2023 84 Eastern Europe, 14 to 17 April 2026 76 Europe, October 2026 75 Eastern Europe, March 2024 67 Poland, Czechia and 2 more countries, October 2023 62 Eastern Europe, 27 to 30 October 2026 37 Bars: cities reached; colour: the level of the episode's highest daily reading. All 41 .
Use this page SmogRank, Eastern Europe, 27 to 30 October 2026: 37 cities with PM2.5 at twice their usual or more, 27 to 30 October 2026, smogrank.com/episodes/2026-10-27-eastern-europe (accessed 17 November 2026).
Share Copy citation Download top 10 (PNG)
You're welcome to reuse a single chart, image or figure with this citation and a link. Terms .
An episode is a run of days when many cities close to each other (four or more within 350 km on a day, 8 or more in all) each had a daily PM2.5 mean of at least 25 µg/m³ and at least 2 times their usual for that time of year. Found in our own measurements, not picked by hand. How we find episodes . Values are each city's daily mean of its own monitors; causes are the usual kinds for a pattern like this, not a confirmed source. Fire detections from NASA FIRMS; smoke maps from NOAA HMS. Dust: contains modified Copernicus Atmosphere Monitoring Service information 2026. Neither the European Commission nor ECMWF is responsible for any use that may be made of the Copernicus information or data it contains.