SmogRank / Episodes / Germany
Germany, Poland and 2 more countries, June 2023
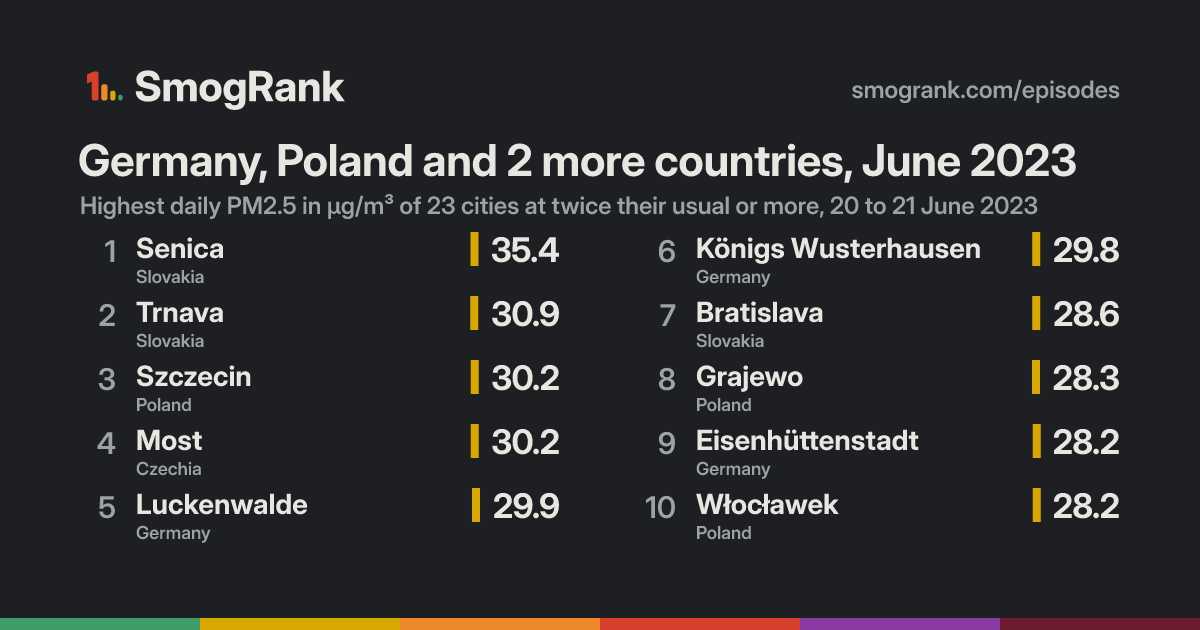
For 2 days, from 20 to 21 June 2023, 23 cities in Germany, Slovakia, Poland and 1 more countries had PM2.5 at least twice their usual for the time of year. The worst reading was Senica, Trnava Region, Slovakia: 35.4 µg/m³ on 21 June, about 3.6× its usual 9.7. Ended 21 June.
Few fires were detected near these cities on those days. Spreads like this usually come from still weather trapping smoke from heating, traffic and industry, or from dust.
Cities reached 23 in 4 countries
Days 2 20 to 21 June 2023
Worst day 20 June 17 cities counted
Furthest above usual 4.8× Königs Wusterhausen
Day by day
Play 20 June 17 cities at twice their usual or more
Opole Krapkowice Nysa Kędzierzyn-Koźle Wrocław Kalisz Racibórz Opava Wodzisław Śląski Bohumín Ostrava Kłodzko Studénka Jastrzębie Zdrój Karviná Havířov Frýdek-Místek Hranice Olomouc Katowice Český Těšín Valašské Meziříčí Přerov Třinec Moravská Třebová Czechowice-Dziedzice Kościan Kroměříž Zlín Bielsko-Biala Radomsko Wschowa Poznań Oščadnica Púchov Łódź Žilina Trenčín Slatina Jelenia Góra Židenice Hradec Králové Brno Kutno Pardubice Martin Lwówek Śląski Włoszczowa Bydgoszcz Nakło nad Notecią Toruń Prievidza Kraków Partizánske Mikulov Handlová Zielona Góra Žiar nad Hronom Płock Banská Bystrica Malacky Liptovský Mikuláš Świecie Sereď Jihlava Pezinok Znojmo Międzyrzecz Liberec Zvolen Chorvátsky Grob - Čierna Voda Żary Chrastava Bogatynia Karlova Ves Kielce Hainburg an der Donau Mladá Boleslav Żyrardów Groß-Enzersdorf Klosterneuburg Kolárovo Vienna Šahy Tulln Poprad Veľká Lomnica Perchtoldsdorf Komárno Mödling Lučenec Hnúšťa Revúca Esztergom Eisenstadt Pruszków Starachowice Bad Vöslau Tarnów Smižany Spišská Nová Ves Radom Sankt Pölten Prague Legionowo Warsaw Cottbus Děčín Konstancin-Jeziorna Wawer Krompachy Otwock Mielec Kladno Ústí nad Labem Dębica Pułtusk Beroun České Budějovice Bardejov Jasło Kazincbarcika Lubnjow Teplice Prešov Olsztyn Amstetten Schwedt (Oder) Košice Litvínov Krosno Strausberg Čaňa Sankt Valentin Enns Elsterwerda Rokycany Rzeszów Linz Schöneiche Ansfelden Eberswalde Steyr Nisko Vranov nad Topľou Traun Pilsen Bernau bei Berlin Trebišov Blankenfelde-Mahlow Humenné Wels Świnoujście Siedlce Łuków Kleinmachnow Snina Kętrzyn Lublin Passau Falkensee Attnang-Puchheim Dallgow-Döberitz Jarosław Przemyśl Sokolov Nauen Wittenberg Neubrandenburg Bad Belzig Altenburg Neuruppin Brandenburg an der Havel Ełk Bitterfeld-Wolfen Zamość Oberviechtach Greiz Burghausen Arzberg Weiden Marktredwitz Weißenfels Halle (Saale) Osternienburger Land Białystok Köthen Schwandorf in Bayern Malchow Trostberg an der Alz Traunreut Augustów Burg bei Magdeburg Jena Kahla Kelheim Magdeburg Güstrow Neustadt an der Donau Wittenberge Saalfeld Weimar Rostock Bützow Ingolstadt Ludwigslust Munich Schwerin Wismar Starnberg Cieszyn Senec Nitra Ružomberok Łask Bratislava Trnava Mahlow Kadaň Włocławek Berlin Grajewo Most Teltow Senica Gorzów Wielkopolski Szczecin Potsdam Neuenhagen Frankfurt (Oder) Eisenhüttenstadt Luckenwalde Königs Wusterhausen On the map: 29 fire detections.
17 Jun 18 19 20 21 22 23 24 Every measured city in the area, coloured by its PM2.5 that day; a dark ring marks a city at twice its usual or more. Bars: cities counted each day, coloured by their median level. Choose a day or press play; without JavaScript, the days link to that day's world ranking. Fires, seen Heat satellites detected that day (via NASA FIRMS); bigger and glowing means more detections in the area. Farm burning and other fires count too, not only wildfires.Under the cities, for each UTC day: fires satellites detected (via NASA FIRMS), smoke NOAA analysts traced and volcanic ash warnings for aircraft. They show what was in the air, not that it caused the readings.
Fires: NASA FIRMS (VIIRS). Traced smoke: NOAA Hazard Mapping System. Volcanic ash: aviation ash warnings (SIGMETs) via NOAA's Aviation Weather Center.
How it spread
Szczecin Szczecin, 17 June: 21.9 µg/m³ Szczecin, 18 June: 15.3 µg/m³ Szczecin, 19 June: 16.5 µg/m³ Szczecin, 20 June: 30.2 µg/m³, 3.7× its usual 8.2 Szczecin, 21 June: 23.5 µg/m³ Szczecin, 22 June: 10.9 µg/m³ Szczecin, 23 June: 12.7 µg/m³ Szczecin, 24 June: 12.4 µg/m³ Most Most, 17 June: 10.5 µg/m³ Most, 18 June: 12.5 µg/m³ Most, 19 June: 19.5 µg/m³ Most, 20 June: 30.2 µg/m³, 3.5× its usual 8.6 Most, 21 June: 16.0 µg/m³ Most, 22 June: 14.7 µg/m³ Most, 23 June: 8.9 µg/m³ Most, 24 June: 7.1 µg/m³ Luckenwalde Luckenwalde, 17 June: 15.2 µg/m³ Luckenwalde, 18 June: 15.6 µg/m³ Luckenwalde, 19 June: 19.1 µg/m³ Luckenwalde, 20 June: 29.9 µg/m³, 4.5× its usual 6.7 Luckenwalde, 21 June: 18.6 µg/m³ Luckenwalde, 22 June: 14.3 µg/m³ Luckenwalde, 23 June: 14.5 µg/m³ Luckenwalde, 24 June: 12.7 µg/m³ Königs Wusterhausen Königs Wusterhausen, 17 June: 10.8 µg/m³ Königs Wusterhausen, 18 June: 11.9 µg/m³ Königs Wusterhausen, 19 June: 18.7 µg/m³ Königs Wusterhausen, 20 June: 29.8 µg/m³, 4.8× its usual 6.2 Königs Wusterhausen, 21 June: 19.6 µg/m³ Königs Wusterhausen, 22 June: 9.6 µg/m³ Königs Wusterhausen, 23 June: 9.0 µg/m³ Königs Wusterhausen, 24 June: 8.6 µg/m³ Trnava Trnava, 17 June: 11.9 µg/m³ Trnava, 18 June: 16.8 µg/m³ Trnava, 19 June: 25.3 µg/m³ Trnava, 20 June: 29.5 µg/m³, 2.7× its usual 10.9 Trnava, 21 June: 30.9 µg/m³, 2.8× its usual 10.9 Trnava, 22 June: 21.3 µg/m³ Trnava, 23 June: 21.7 µg/m³ Trnava, 24 June: 7.1 µg/m³ Senica Senica, 17 June: 11.9 µg/m³ Senica, 18 June: 17.0 µg/m³ Senica, 19 June: 24.9 µg/m³ Senica, 20 June: 29.2 µg/m³, 3.0× its usual 9.7 Senica, 21 June: 35.4 µg/m³, 3.6× its usual 9.7 Senica, 22 June: no reading Senica, 23 June: no reading Senica, 24 June: no reading Eisenhüttenstadt Eisenhüttenstadt, 17 June: 12.5 µg/m³ Eisenhüttenstadt, 18 June: 12.8 µg/m³ Eisenhüttenstadt, 19 June: 20.0 µg/m³ Eisenhüttenstadt, 20 June: 28.2 µg/m³, 4.1× its usual 6.8 Eisenhüttenstadt, 21 June: 16.8 µg/m³ Eisenhüttenstadt, 22 June: 12.6 µg/m³ Eisenhüttenstadt, 23 June: 10.6 µg/m³ Eisenhüttenstadt, 24 June: 9.4 µg/m³ Mahlow Mahlow, 17 June: 15.5 µg/m³ Mahlow, 18 June: 16.6 µg/m³ Mahlow, 19 June: 20.1 µg/m³ Mahlow, 20 June: 27.2 µg/m³, 2.9× its usual 9.4 Mahlow, 21 June: 21.0 µg/m³ Mahlow, 22 June: 11.6 µg/m³ Mahlow, 23 June: 13.7 µg/m³ Mahlow, 24 June: 11.6 µg/m³ Frankfurt (Oder) Frankfurt (Oder), 17 June: 15.6 µg/m³ Frankfurt (Oder), 18 June: 13.7 µg/m³ Frankfurt (Oder), 19 June: 19.7 µg/m³ Frankfurt (Oder), 20 June: 26.9 µg/m³, 4.1× its usual 6.6 Frankfurt (Oder), 21 June: 17.0 µg/m³ Frankfurt (Oder), 22 June: 11.2 µg/m³ Frankfurt (Oder), 23 June: 11.6 µg/m³ Frankfurt (Oder), 24 June: 9.6 µg/m³ Neuenhagen Neuenhagen, 17 June: 13.6 µg/m³ Neuenhagen, 18 June: 15.3 µg/m³ Neuenhagen, 19 June: 19.4 µg/m³ Neuenhagen, 20 June: 26.7 µg/m³, 4.0× its usual 6.7 Neuenhagen, 21 June: 18.5 µg/m³ Neuenhagen, 22 June: 11.0 µg/m³ Neuenhagen, 23 June: 11.4 µg/m³ Neuenhagen, 24 June: 9.6 µg/m³ Gorzów Wielkopolski Gorzów Wielkopolski, 17 June: 12.4 µg/m³ Gorzów Wielkopolski, 18 June: 14.0 µg/m³ Gorzów Wielkopolski, 19 June: 16.6 µg/m³ Gorzów Wielkopolski, 20 June: 26.5 µg/m³, 3.7× its usual 7.1 Gorzów Wielkopolski, 21 June: 20.0 µg/m³ Gorzów Wielkopolski, 22 June: 10.9 µg/m³ Gorzów Wielkopolski, 23 June: 8.4 µg/m³ Gorzów Wielkopolski, 24 June: 8.2 µg/m³ Berlin Berlin, 17 June: 14.8 µg/m³ Berlin, 18 June: 16.7 µg/m³ Berlin, 19 June: 21.3 µg/m³ Berlin, 20 June: 26.5 µg/m³, 3.2× its usual 8.3 Berlin, 21 June: 19.8 µg/m³ Berlin, 22 June: 11.2 µg/m³ Berlin, 23 June: 13.2 µg/m³ Berlin, 24 June: 11.0 µg/m³ Nitra Nitra, 17 June: 10.2 µg/m³ Nitra, 18 June: 13.1 µg/m³ Nitra, 19 June: 22.4 µg/m³ Nitra, 20 June: 26.1 µg/m³, 2.5× its usual 10.4 Nitra, 21 June: 25.1 µg/m³, 2.4× its usual 10.4 Nitra, 22 June: no reading Nitra, 23 June: no reading Nitra, 24 June: no reading Teltow Teltow, 17 June: 15.4 µg/m³ Teltow, 18 June: 15.7 µg/m³ Teltow, 19 June: 19.8 µg/m³ Teltow, 20 June: 25.9 µg/m³, 3.6× its usual 7.2 Teltow, 21 June: 20.0 µg/m³ Teltow, 22 June: 11.1 µg/m³ Teltow, 23 June: 13.0 µg/m³ Teltow, 24 June: 10.9 µg/m³ Potsdam Potsdam, 17 June: 11.6 µg/m³ Potsdam, 18 June: 12.8 µg/m³ Potsdam, 19 June: 19.8 µg/m³ Potsdam, 20 June: 25.2 µg/m³, 3.9× its usual 6.5 Potsdam, 21 June: 19.8 µg/m³ Potsdam, 22 June: 10.4 µg/m³ Potsdam, 23 June: 8.8 µg/m³ Potsdam, 24 June: 8.7 µg/m³ Kadaň Kadaň, 17 June: 9.6 µg/m³ Kadaň, 18 June: 11.7 µg/m³ Kadaň, 19 June: 21.2 µg/m³ Kadaň, 20 June: 25.2 µg/m³, 3.0× its usual 8.3 Kadaň, 21 June: 15.4 µg/m³ Kadaň, 22 June: 15.4 µg/m³ Kadaň, 23 June: 7.7 µg/m³ Kadaň, 24 June: 8.7 µg/m³ Senec Senec, 17 June: 11.4 µg/m³ Senec, 18 June: 15.3 µg/m³ Senec, 19 June: 18.8 µg/m³ Senec, 20 June: 25.2 µg/m³, 2.3× its usual 10.8 Senec, 21 June: 25.9 µg/m³, 2.4× its usual 10.8 Senec, 22 June: 20.0 µg/m³ Senec, 23 June: 19.6 µg/m³ Senec, 24 June: 5.1 µg/m³ Bratislava Bratislava, 17 June: 8.3 µg/m³ Bratislava, 18 June: 13.5 µg/m³ Bratislava, 19 June: 17.5 µg/m³ Bratislava, 20 June: 22.9 µg/m³ Bratislava, 21 June: 28.6 µg/m³, 2.8× its usual 10.3 Bratislava, 22 June: 19.0 µg/m³ Bratislava, 23 June: 15.0 µg/m³ Bratislava, 24 June: 4.5 µg/m³ Grajewo Grajewo, 17 June: 19.5 µg/m³ Grajewo, 18 June: 18.5 µg/m³ Grajewo, 19 June: 17.6 µg/m³ Grajewo, 20 June: 20.1 µg/m³ Grajewo, 21 June: 28.3 µg/m³, 3.3× its usual 8.6 Grajewo, 22 June: 19.8 µg/m³ Grajewo, 23 June: 11.4 µg/m³ Grajewo, 24 June: 9.8 µg/m³ Włocławek Włocławek, 17 June: 26.9 µg/m³ Włocławek, 18 June: 22.6 µg/m³ Włocławek, 19 June: 19.2 µg/m³ Włocławek, 20 June: 18.3 µg/m³ Włocławek, 21 June: 28.2 µg/m³, 3.1× its usual 9.0 Włocławek, 22 June: 16.4 µg/m³ Włocławek, 23 June: 12.8 µg/m³ Włocławek, 24 June: 11.7 µg/m³ Łask Łask, 17 June: 16.8 µg/m³ Łask, 18 June: 17.6 µg/m³ Łask, 19 June: 16.9 µg/m³ Łask, 20 June: 21.7 µg/m³ Łask, 21 June: 25.6 µg/m³, 2.6× its usual 10.0 Łask, 22 June: 11.4 µg/m³ Łask, 23 June: 13.4 µg/m³ Łask, 24 June: 9.9 µg/m³ Ružomberok Ružomberok, 17 June: 14.7 µg/m³ Ružomberok, 18 June: 9.8 µg/m³ Ružomberok, 19 June: 10.8 µg/m³ Ružomberok, 20 June: 18.5 µg/m³ Ružomberok, 21 June: 25.2 µg/m³, 2.6× its usual 9.7 Ružomberok, 22 June: 19.3 µg/m³ Ružomberok, 23 June: 28.2 µg/m³ Ružomberok, 24 June: 11.3 µg/m³ Cieszyn Cieszyn, 17 June: 13.1 µg/m³ Cieszyn, 18 June: 11.8 µg/m³ Cieszyn, 19 June: 14.6 µg/m³ Cieszyn, 20 June: 21.7 µg/m³ Cieszyn, 21 June: 25.0 µg/m³, 2.3× its usual 11.0 Cieszyn, 22 June: 15.0 µg/m³ Cieszyn, 23 June: 18.9 µg/m³ Cieszyn, 24 June: 9.5 µg/m³ 17 Jun 18 19 20 21 22 23 24 Every counted city, in the order the episode reached them, 3 days before to 3 after. Each square is a day, coloured by that day's PM2.5; outlined: at twice the city's usual or more. Good 0–50
Moderate 51–100
Unhealthy for sensitive groups 101–150
Unhealthy 151–200
Very unhealthy 201–300
Hazardous 301+
Every city it reached
City Days Highest Usual Above usual
Königs Wusterhausen Brandenburg, Germany 1 20 June 6.2 4.8× Luckenwalde Brandenburg, Germany 1 20 June 6.7 4.5× Eisenhüttenstadt Brandenburg, Germany 1 20 June 6.8 4.1× Frankfurt (Oder) Brandenburg, Germany 1 20 June 6.6 4.1× Neuenhagen Brandenburg, Germany 1 20 June 6.7 4.0× Potsdam Brandenburg, Germany 1 20 June 6.5 3.9× Szczecin West Pomerania, Poland 1 20 June 8.2 3.7× Gorzów Wielkopolski Lubusz, Poland 1 20 June 7.1 3.7× Senica Trnava Region, Slovakia 2 21 June 9.7 3.6× Teltow Brandenburg, Germany 1 20 June 7.2 3.6× Most Ústí nad Labem Region, Czechia 1 20 June 8.6 3.5× Grajewo Podlasie, Poland 1 21 June 8.6 3.3× Berlin State of Berlin, Germany 1 20 June 8.3 3.2× Włocławek Kujawsko-Pomorskie, Poland 1 21 June 9.0 3.1× Kadaň Ústí nad Labem Region, Czechia 1 20 June 8.3 3.0× Mahlow Brandenburg, Germany 1 20 June 9.4 2.9× Trnava Trnava Region, Slovakia 2 21 June 10.9 2.8× Bratislava Bratislava Region, Slovakia 1 21 June 10.3 2.8× Łask Łódź Voivodeship, Poland 1 21 June 10.0 2.6× Ružomberok Žilina Region, Slovakia 1 21 June 9.7 2.6× Nitra Nitra Region, Slovakia 2 20 June 10.4 2.5× Senec Bratislava Region, Slovakia 2 21 June 10.8 2.4× Cieszyn Silesia, Poland 1 21 June 11.0 2.3×
Daily means in µg/m³, over the days each city counted in this episode. Highest: its highest of those days. Usual: the city's median for the time of year of that day (its days within 21 days of the date, every year, leaving out the week either side of it). Above usual: its highest day against that, with a usual under 5 µg/m³ taken as 5.
Compared with other episodes in Germany and Slovakia
Number 19 of 28 episodes in Germany and Slovakia since our records began, by cities reached.
Europe, January and February 2026 759 Europe, 1 to 14 February 2025 736 Europe, February and March 2026 665 Germany, United Kingdom and 26 more countries, March 2025 660 Germany, France and 25 more countries, January 2024 620 Europe, March 2025 532 Europe, March 2026 522 Europe, February and March 2024 398 Europe, March and April 2024 380 Europe, September 2024 242 Europe, December 2025 to January 2026 231 Germany, Poland and 2 more countries, February 2026 89 Germany, Poland and 2 more countries, June 2023 23 Bars: cities reached; colour: the level of the episode's highest daily reading. All 28 .
Use this page SmogRank, Germany, Poland and 2 more countries, June 2023: 23 cities with PM2.5 at twice their usual or more, 20 to 21 June 2023, smogrank.com/episodes/2023-06-germany-poland-and-2-more-countries (accessed 17 November 2026).
Share Copy citation Download top 10 (PNG)
You're welcome to reuse a single chart, image or figure with this citation and a link. Terms .
An episode is a run of days when many cities close to each other (four or more within 350 km on a day, 8 or more in all) each had a daily PM2.5 mean of at least 25 µg/m³ and at least 2 times their usual for that time of year. Found in our own measurements, not picked by hand. How we find episodes . Values are each city's daily mean of its own monitors; causes are the usual kinds for a pattern like this, not a confirmed source. Fire detections from NASA FIRMS; smoke maps from NOAA HMS. Dust: contains modified Copernicus Atmosphere Monitoring Service information 2023. Neither the European Commission nor ECMWF is responsible for any use that may be made of the Copernicus information or data it contains.